Prevalence of eating disorders in the general population:a systematic review
2013-12-09 06:28:31JieQIANQiangHUYumeiWANTingLIMudanWUZhiqunRENDehuaYU
上海精神醫學 2013年4期
Jie QIAN, Qiang HU, Yumei WAN, Ting LI, Mudan WU, Zhiqun REN, Dehua YU*
1上海市楊浦區中心醫院;同濟大學附屬楊浦醫院 上海
2 上海交通大學醫學院附屬精神衛生中心 上海
?Meta-analysis?
Prevalence of eating disorders in the general population:a systematic review
Jie QIAN1, Qiang HU2, Yumei WAN2, Ting LI2, Mudan WU2, Zhiqun REN1, Dehua YU1*
1. Introduction
Eating disorders are common conditions that have gained increasing attention over the last two decades.A growing body of literature has demonstrated their association with decreased quality of life,[1]substantial disease burden,[2,3]and an increased risk of depression,substance abuse and suicide.[4-7]Both the types of conditions included in this category of disorders and the diagnostic criteria for the specific disorders have changed over time: ‘anorexia nervosa’ (AN) and ‘bulimia nervosa’ (BN) - the most important types of eating disorders - are included in all diagnostic classifications of eating disorders, but the American Psychiatric Association Diagnostic and Statistical Manual of Mental Disorders (DSM)[8,9]also includes ‘binge eating disorder’(BED) and ‘eating disorder not otherwise specified’;the International Classification of Diseases (ICD)[10]also includes ‘atypical anorexia nervosa’, ‘atypical bulimia nervosa’ and several other eating disorders; and theChinese Classification and Diagnostic Criteria of Mental Disorders (CCMD)[11]also includes ‘psychogenia nervosa’(pathological vomiting) and some other eating disorders.
The prevalence of these conditions is rising in many countries[12,13]and is typically higher in young females[14-16]and in high-income countries,[17,18]possibly due to cultural and economic factors. There is an 18-fold difference in the reported overall prevalence of eating disorders in the general population; estimates range from 0.2%[19]to 3.7%[20]in community-based surveys.But there has been little systematic research focused on understanding the reasons for such large variations in prevalence. To address this issue, the current study uses meta-analysis methods to pool data from community surveys from around the world and analyzes these pooled data to estimate the global prevalence of these conditions and to identify factors that may help explain the large differences in reported prevalence.
2. Methods
2.1 Data retrieval strategies
The process of identifying articles for inclusion in the analysis is shown in Figure 1. The following key words(in both English and Chinese) were used to search PubMed/Medline (1966-2013), PsycINFO (1966-2013),ISI web of knowledge (1994-2013), Ovid (1970-2013),Chinese National Knowledge Infrastructure (1979-2013),Chongqing VIP database for Chinese Technical Periodicals(1989-2013), WANFANG DATA (1990-2013), and China BioMedical Literature Services System (SinoMed)(1978-2013): ‘eating disorders’, ‘anorexia nervosa’, ‘bulimianervosa’, ‘prevalence’, and ‘epidemiology’. All articles published before April 30, 2013 were included in the search.
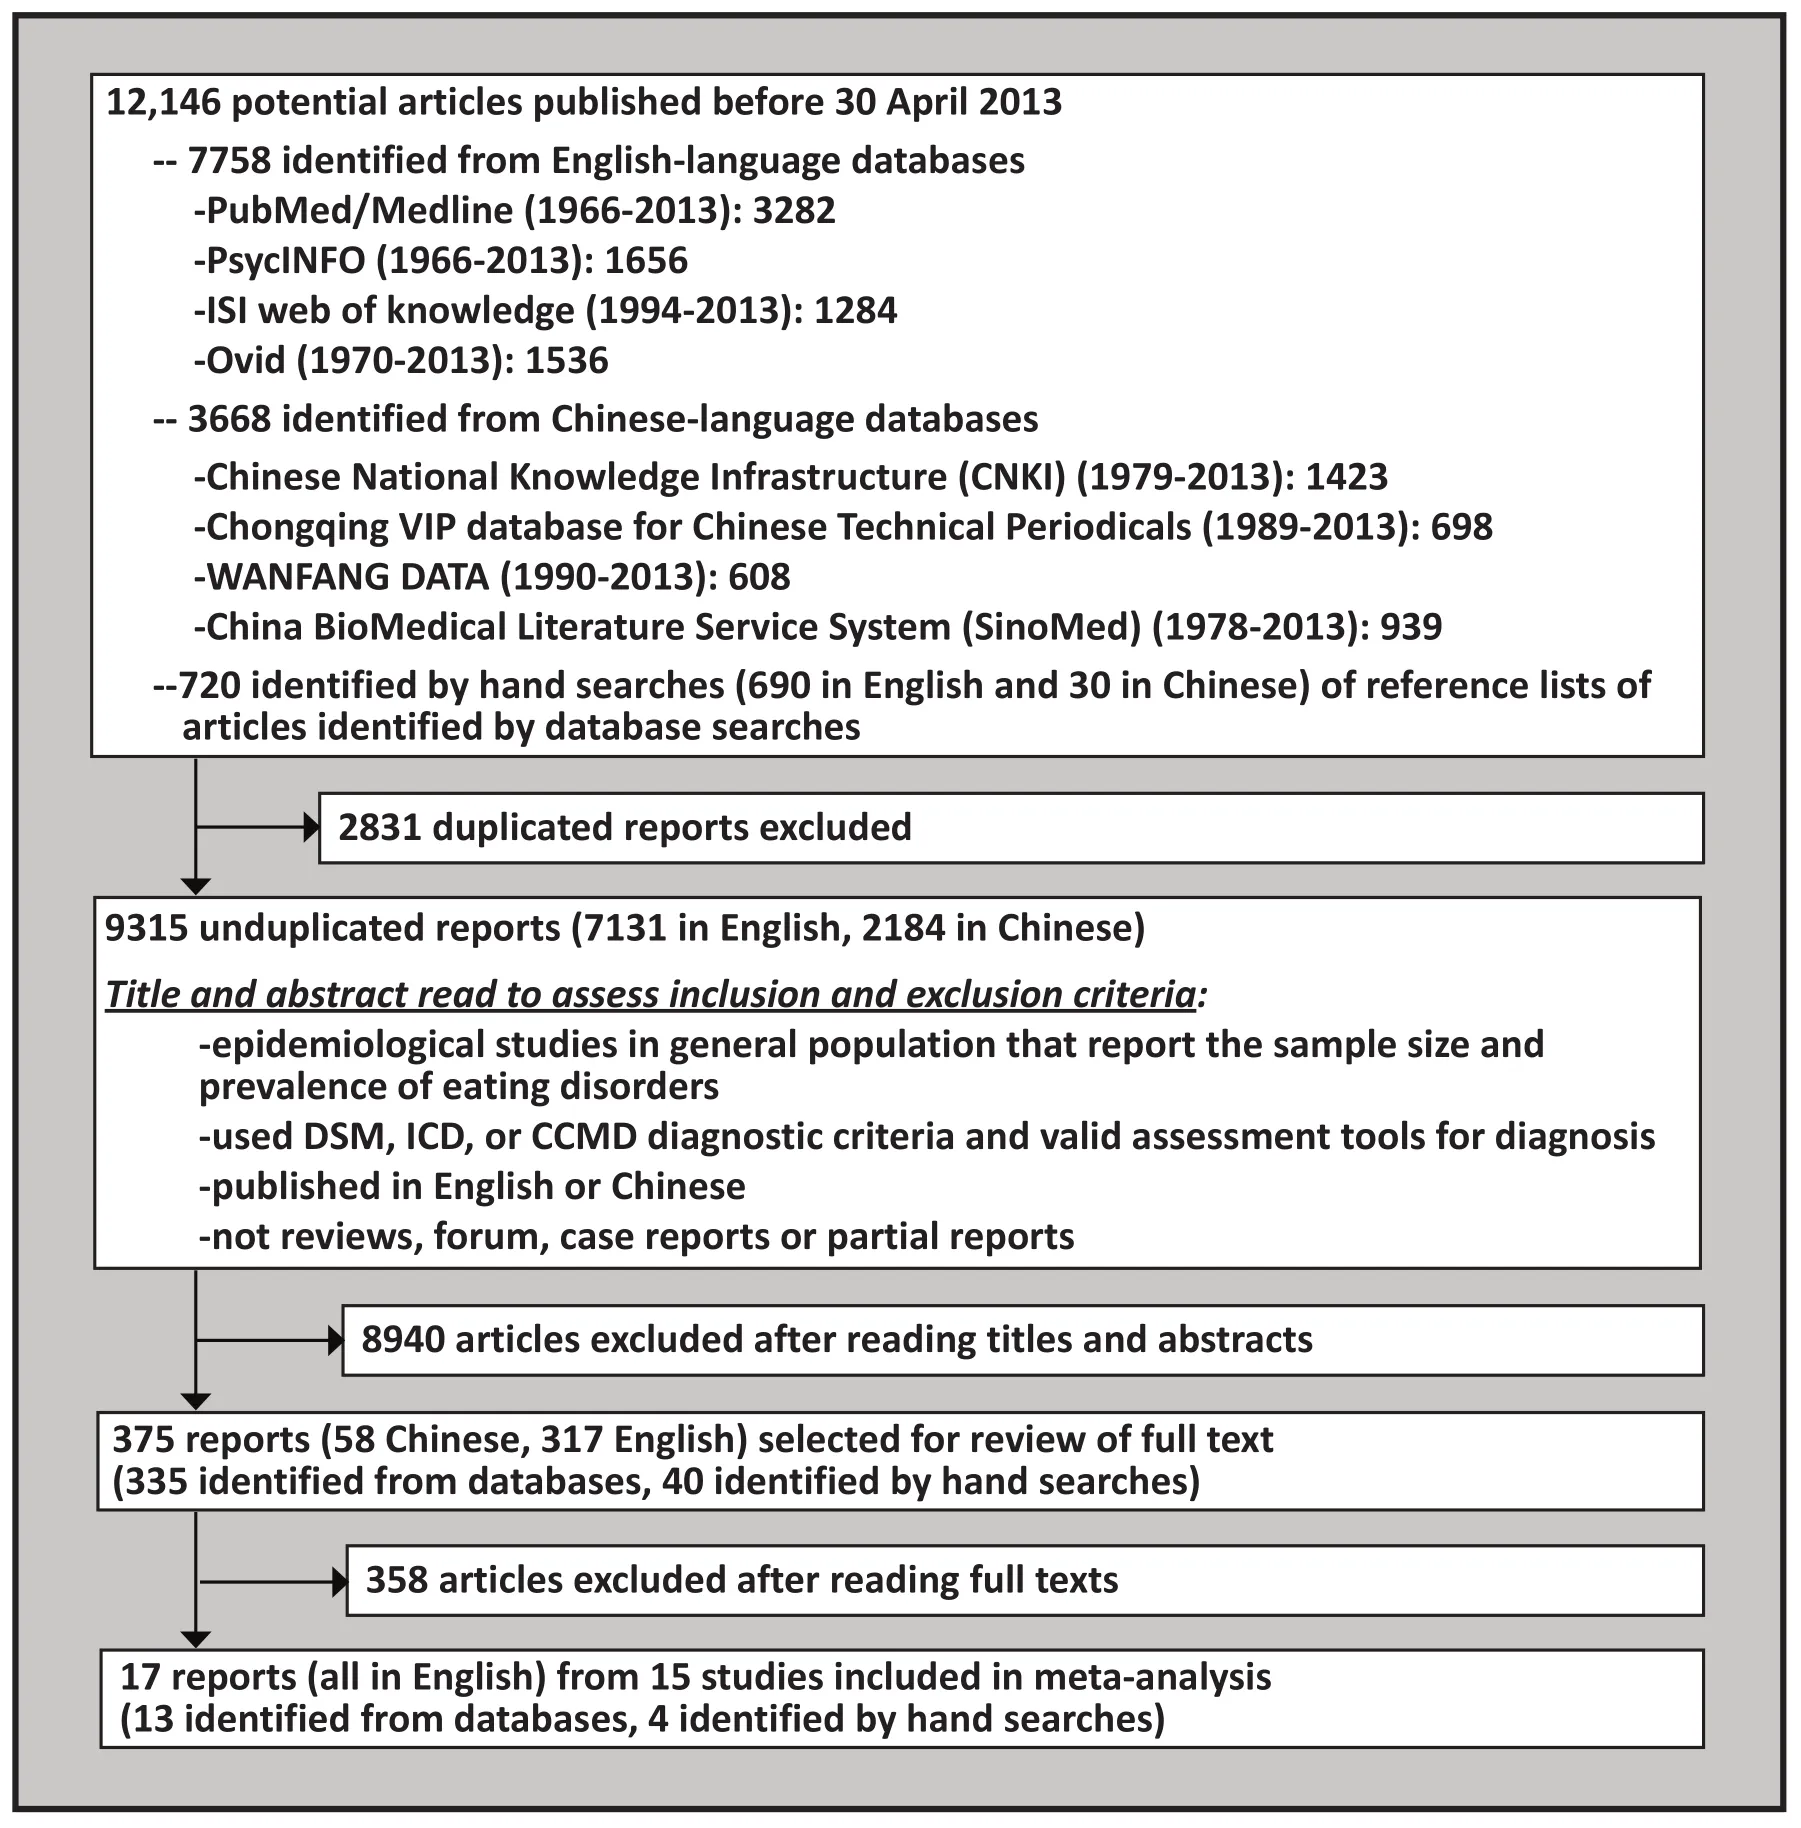
Figure 1. Identification of studies included in the analysis
After removal of duplicates using Endnote X5 software, two authors (QJ and HQ) evaluated all articles independently. Full-text of articles were downloaded when either the reviewers believed the title or abstract of the article met inclusion criteria or when there was no clear indication whether or not the article met the inclusion criteria. The reference lists of 720 articles were hand-checked to identify any other potential articles that had not been identified during the screening of databases. These two authors then read the full-text articles and screened them according to pre-defined inclusion and exclusion criteria. A third author (WY) was consulted when these two authors disagreed about an article, which occurred for 10 of the 375 full-text articles reviewed.
2.2 Inclusion and exclusion criteria
All studies included in this meta-analysis (a) were epidemiological studies about the prevalence of eating disorders in the general population; (b) used DSM, ICD, or CCMD diagnostic criteria; (c) used validated assessment tools (primarily the Composite International Diagnostic Interview [CIDI] or the Schedules for Clinical Assessment in Neuropsychiatry [SCAN]); (d) had information about prevalence and sample size; and (e) were written in English or Chinese. Articles were excluded if they were reviews, case reports, duplicated studies, non-human studies, conducted in specific subgroups of the general population (e.g., females, students, adolescents), or conducted in special settings (e.g., hospitals, military bases).
2.3 Data extraction
Two authors (QJ and HQ) independently extracted relevant information from identified studies including the name of the first author, the year of publication, the year(s) the study was conducted, location of the survey,sampling methods, total sample size, total number of cases, and the prevalence (lifetime, 12-month, and 4-week) of eating disorders for the total sample and for different demographic subgroups.
2.4 Evaluation of the quality of reports on the studies
Two authors rated the title, abstract, methods, results,discussion, and other parts of each included study according to 22 standard items listed in the Strengthening the Reporting of Observational Studies in Epidemiology,(STROBE).[21]The range of the total score was zero to 22 with each item counting for one point. The inter-rater reliability of the two authors for this quality measure was high (intraclass correlation coefficient [ICC], 0.92).
2.5 Statistical analysis
The data were entered into a database and analyzed using the ‘Metaprop’ package in R-2.15.2 statistical software. Prevalence was logit transformed to generate pooled estimates.[22]The I2statistic (variation in effect size attributable to heterogeneity) was calculated to assess heterogeneity across studies. Studies were considered homogeneous when I2was less than 50% and p>0.10,in which case a fixed effect model was used to generate pooled estimates; otherwise, the random-effect model was used.[23]When there was heterogeneity, sensitivity analysis and sub-group analysis were conducted to explore the source of heterogeneity. Begg’s rank method was used to assess publication bias.[24]
3. Results
As shown in Figure 1, a total of 9315 unduplicated studies were identified, including 2184 (23.4%) reported in Chinese. All of the Chinese studies were conducted in specific subgroups of the population (e.g., students), not in the general population, so none of them were selected for inclusion in the systematic review and meta-analysis.Seventeen reports meet the inclusion criteria; three of the reports were based on the same sample (Well,[25]Browne,[26]and Browne[27]), so data from 15 separate studies were included in the analysis.
3.1 General characteristics of included studies
The characteristics of the 15 included studies are shown in Table 1. Two were conducted in the United States,[30,37]two in Latin America,[35,38]six in Western Europe,[20,31-34,36]three in South Korea,[19,28,29]one in New Zealand,[25-27]and one study covered 14 countries from different regions of the world.[39]These studies were conducted between 1984 and 2009 with a cumulative sample of 72,961 individuals who were at least 15 years of age. Nine studies reported results for anorexia nervosa [AN],[19,20,25-29,31,33,35,37]nine reported results for bulimia nervosa[BN],[19,20,25-27,30,31,33,35,37,39]eight for the general category of ‘eating disorder’ [ED],[19,20,25-27,31-34,36]and four for binge eating disorder [BED].[20,37-39]Except for two studies which used ICD-10 diagnostic criteria,[34,35]all others used DSM diagnostic criteria.
3.2 Evaluation of study quality and assessment of publication bias
The mean (sd) quality score for the reports of the studies based on the STROBE items was 20.3 (1.8) and the range in this score varied from 16.5[28]to 22.0.[19,20,31,35,36]The most common problems in the reports of these 15 studies were inadequate description of the sample characteristics (10 studies), of the statistical methods (6 studies), and of the methods for determining the sample size (4 studies).
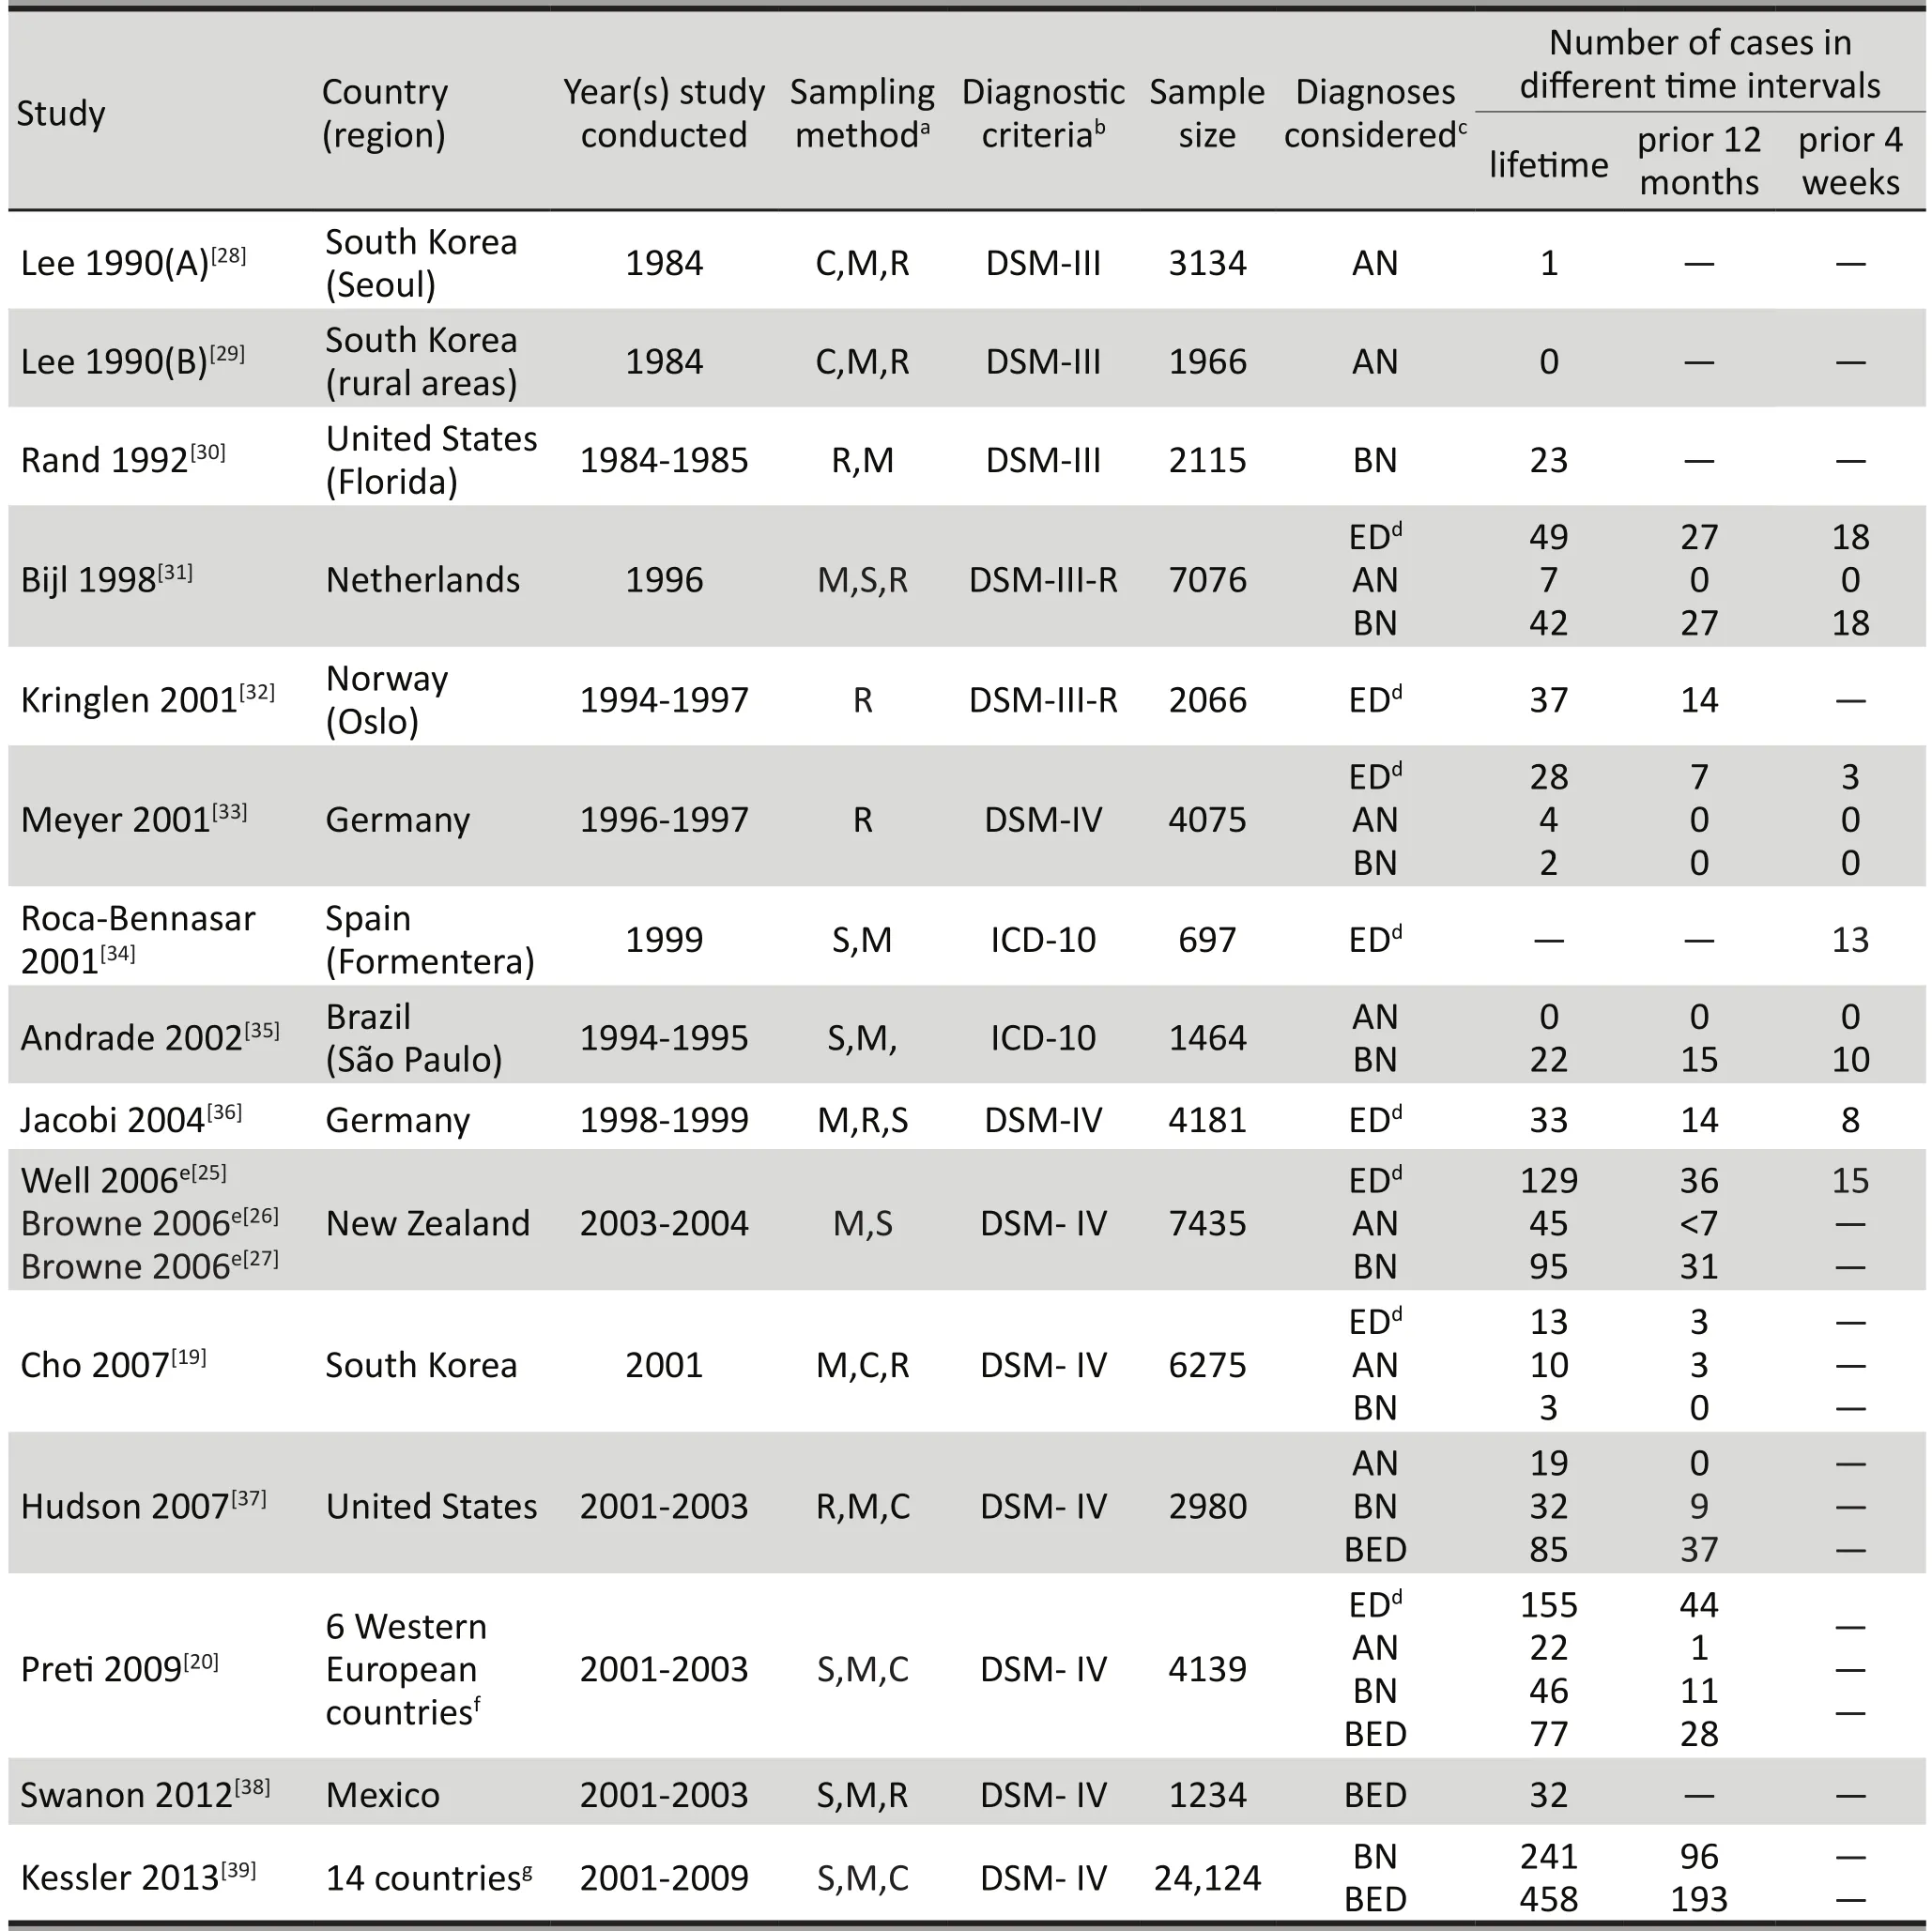
Table 1. Characteristics of the 15 studies included in the meta-analysis
Begg’s adjusted rank correlation test found evidence of publication bias for reports of the lifetime prevalence of ED (Z=2.40, p=0.016) and for reports of the lifetime prevalence of AN (Z=2.10, p=0.035); studies with smaller samples had higher reported prevalence. There was no statistically significant publication bias in reports of the lifetime prevalence of BN (Z=0.10, p=0.917) or in the 12-month prevalence of ED (Z=1.50, p=0.133),AN (Z=0.00, p=1.000) or BN (Z=0.00, p=1.000). There were not enough reports of the 4-week prevalence of these conditions or of the prevalence of BED to assess publication bias.
3.3 Assessment of heterogeneity and sensitivity analysis
As shown in Table 2, several of the prevalence estimates were based on studies that were quite heterogeneous and, thus, the estimated pooled prevalence was based on using random-effect models. We conducted sensitivity analysis to identify outlier studies that adversely affected the homogeneity of the results. Only one such study was identified. The high level of heterogeneity found in the five studies that reported 4-week prevalence of ED (I2=93.7%,p<0.001) was substantially reduced after removal of the Roca-Bennasar study,[34]a small study (n=697) conductedon a small island in Spain; the remaining four studies had sample sizes greater than 4000 and were national studies that were quite homogeneous (I2=25.6%, p=0.259).
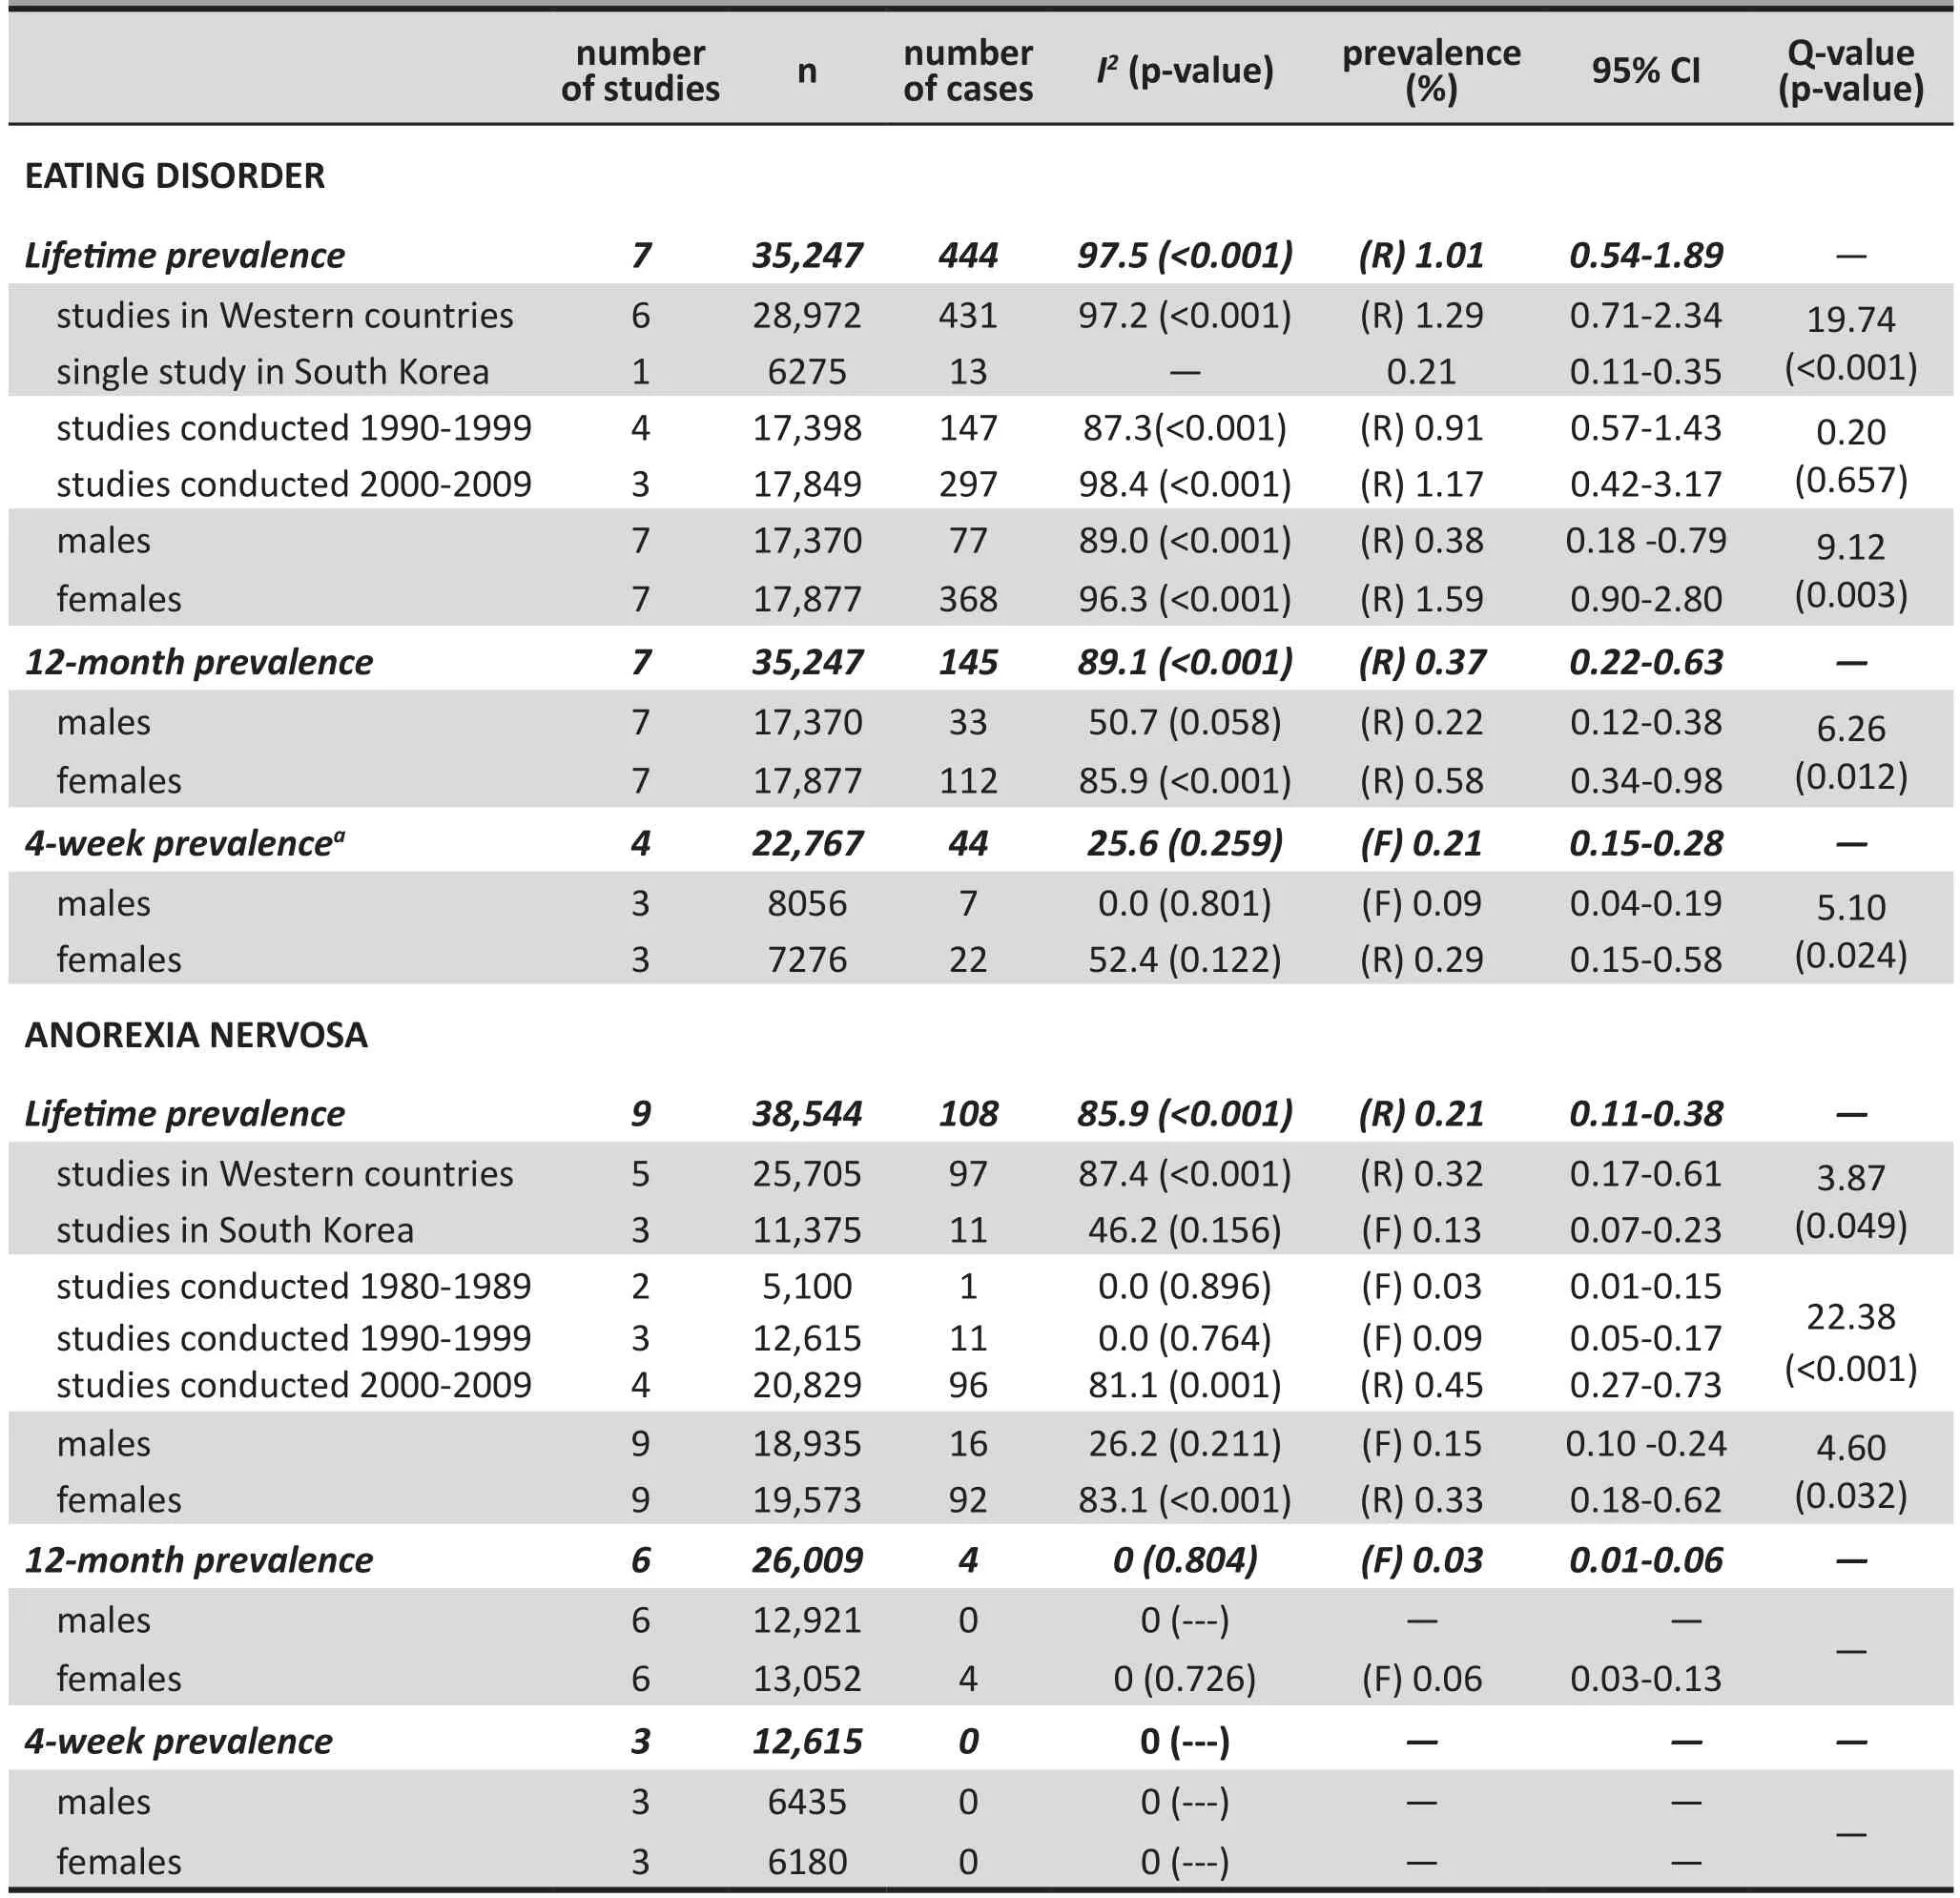
Table 2. Overall and subgroup prevalence of eating disorders
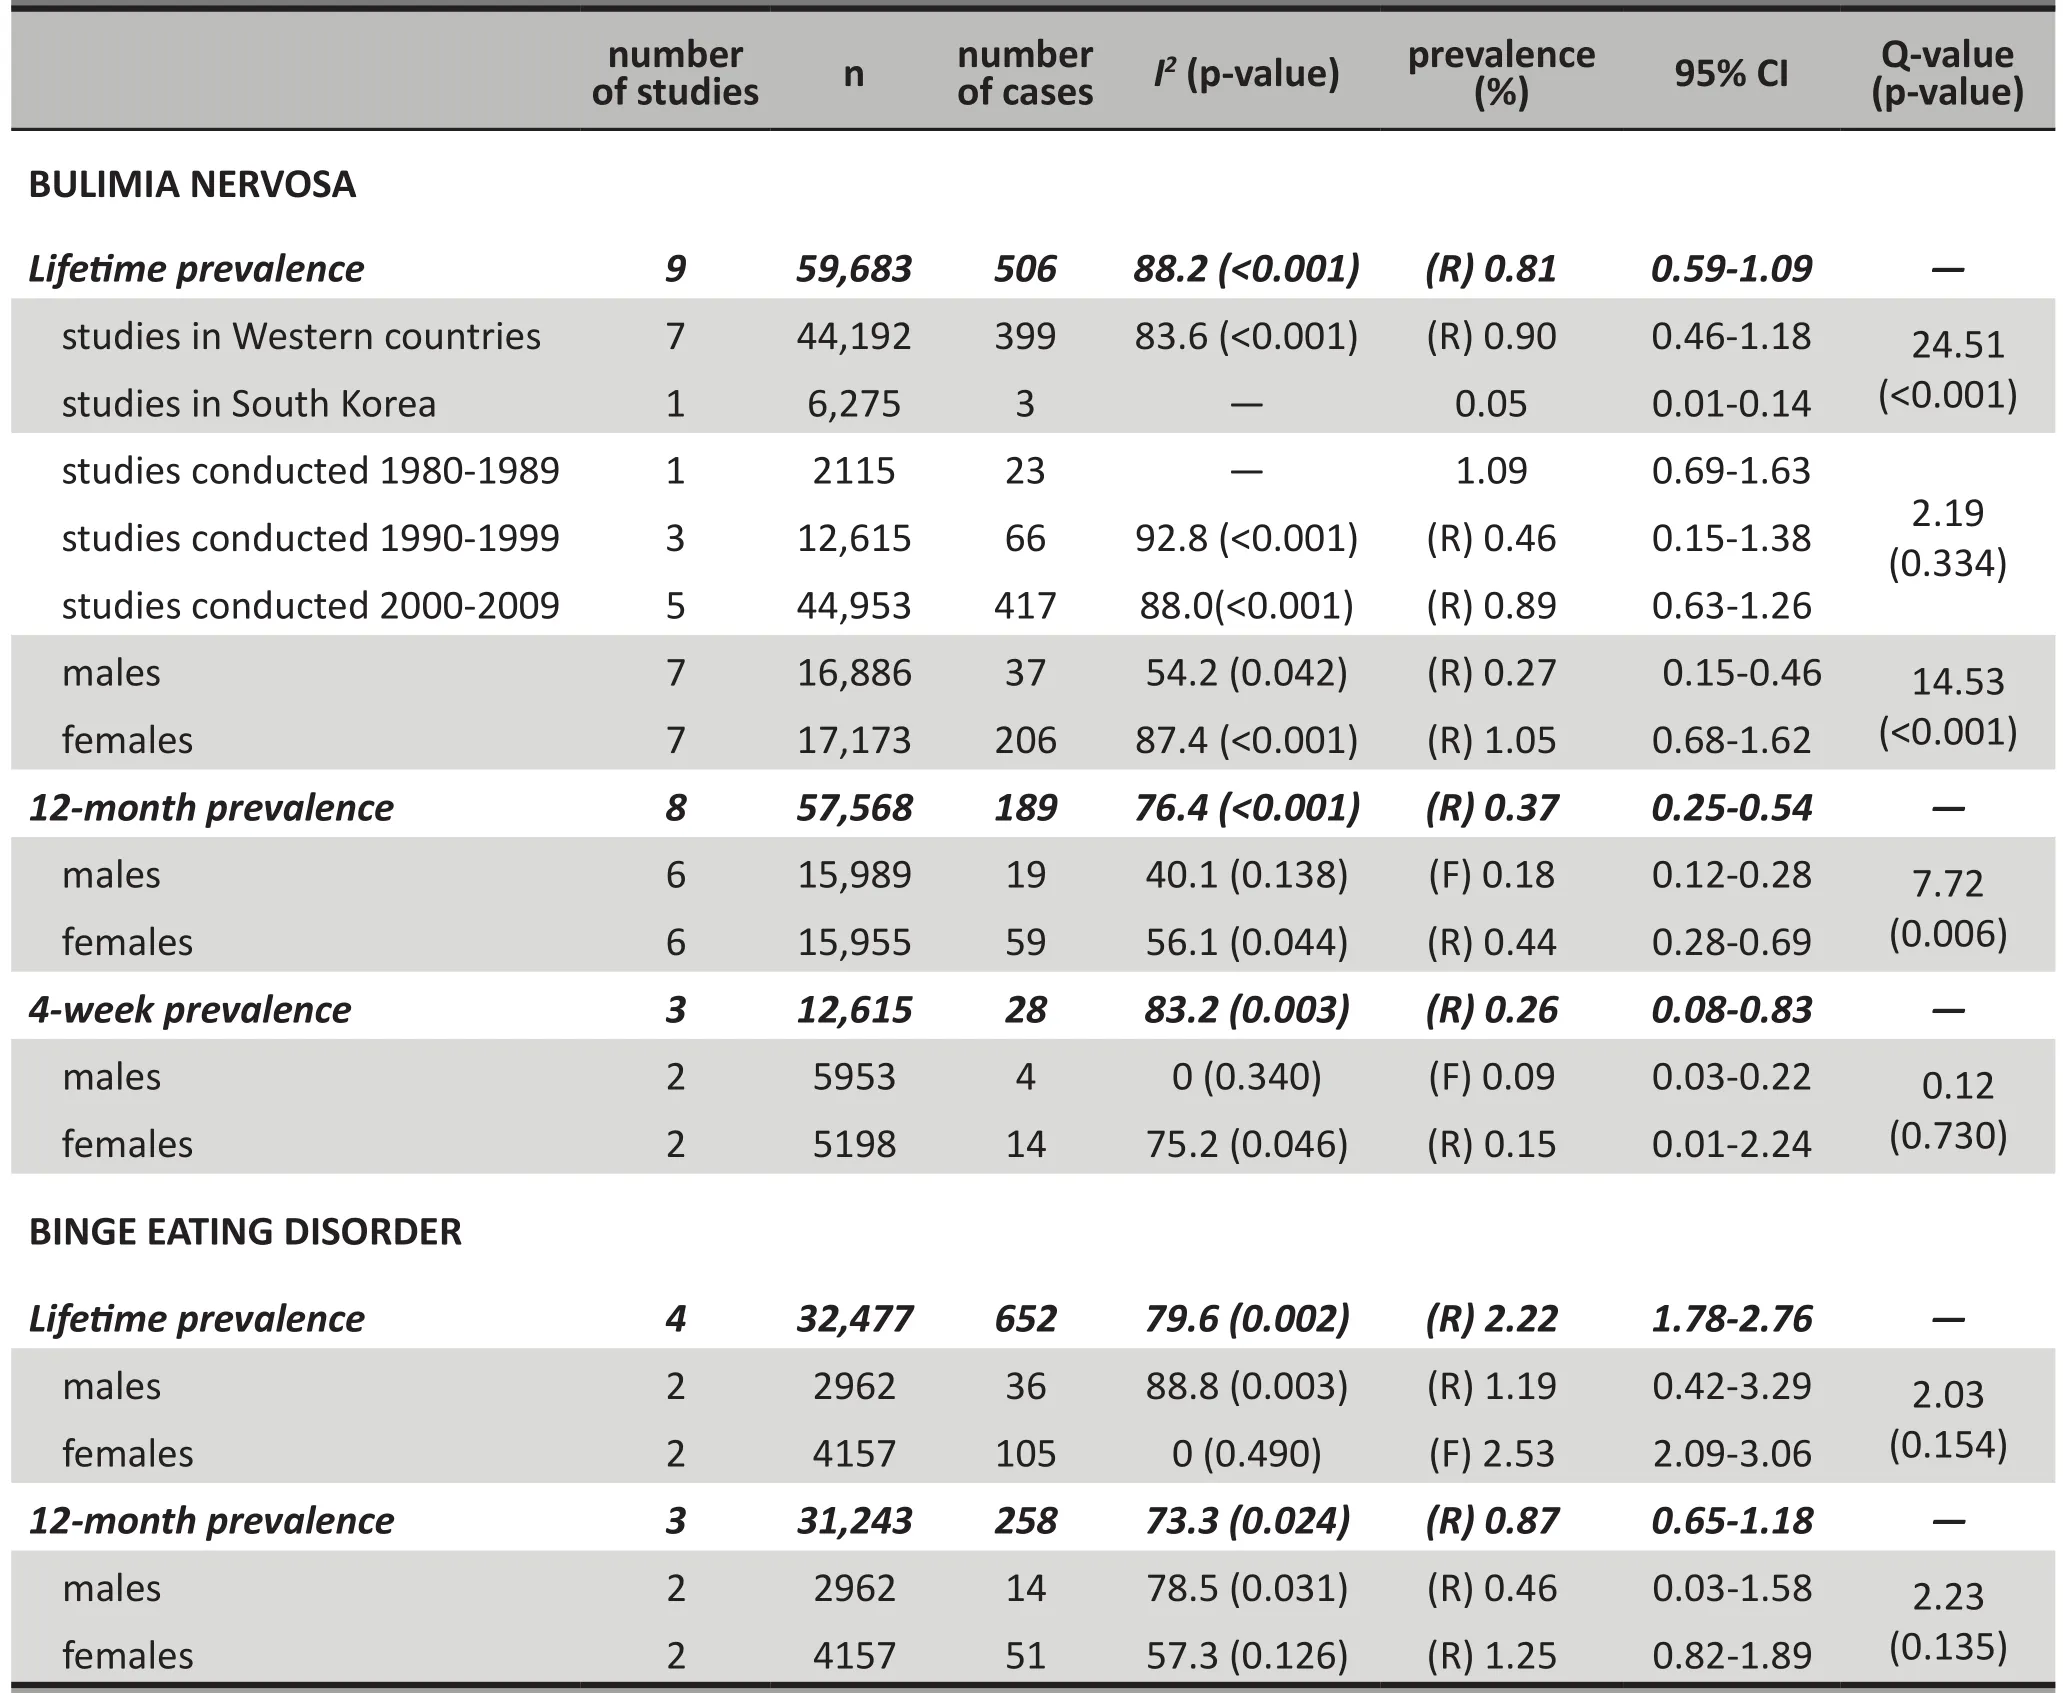
Table 2. Overall and subgroup prevalence of eating disorders (continued)
3.4 Prevalence of eating disorders
The estimated prevalence of the different conditions are shown in Table 2 and in Figures 2 to 4. Summarized from seven studies, the lifetime and 12-month prevalence of ED in the pooled sample of 35,247 individuals was 1.01% (95% CI=0.54-1.89) and 0.37% (95% CI=0.22-0.63),respectively. After excluding one of the five studies that reported 4-week prevalence due to high heterogeneity,the 4-week prevalence of ED in the pooled cumulative sample in the remaining four studies of 22,767 individuals was 0.21% (95% CI=0.15-0.28).
For specific types of eating disorders, the highest lifetime prevalence was found for BED (2.22%), followed by BN (0.81%) and AN (0.21%); the 12-month prevalence was also highest in BED (0.87%), followed by BN(0.37%) and AN (0.03%). None of the studies reported 4-week prevalence of BED; pooling results from three studies,[31,33,35]the 4-week prevalence of BN was 0.26%;and the three studies that reported 4-week prevalence of AN[31,33,35]all reported a prevalence of zero.
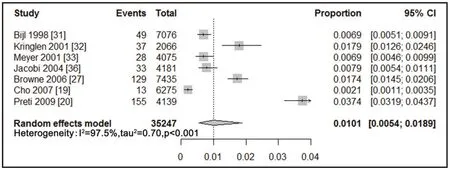
Figure 2. Forest plot of lifetime prevalence of eating disorders
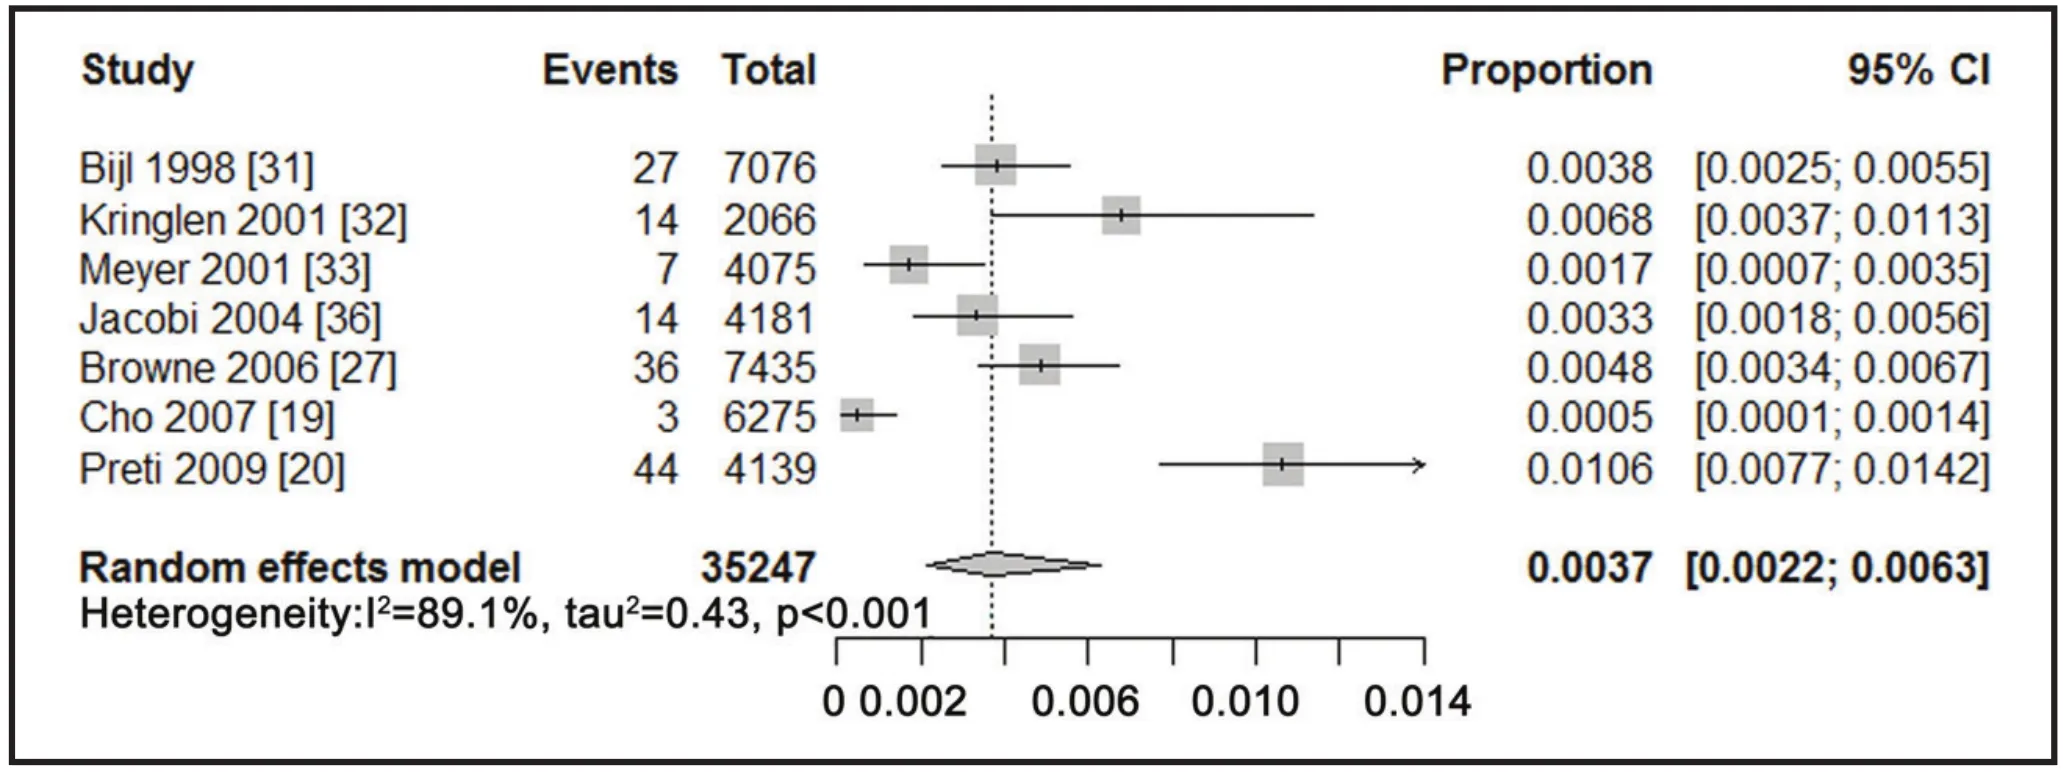
Figure 3. Forest plot of 12-month prevalence estimates of eating disorders
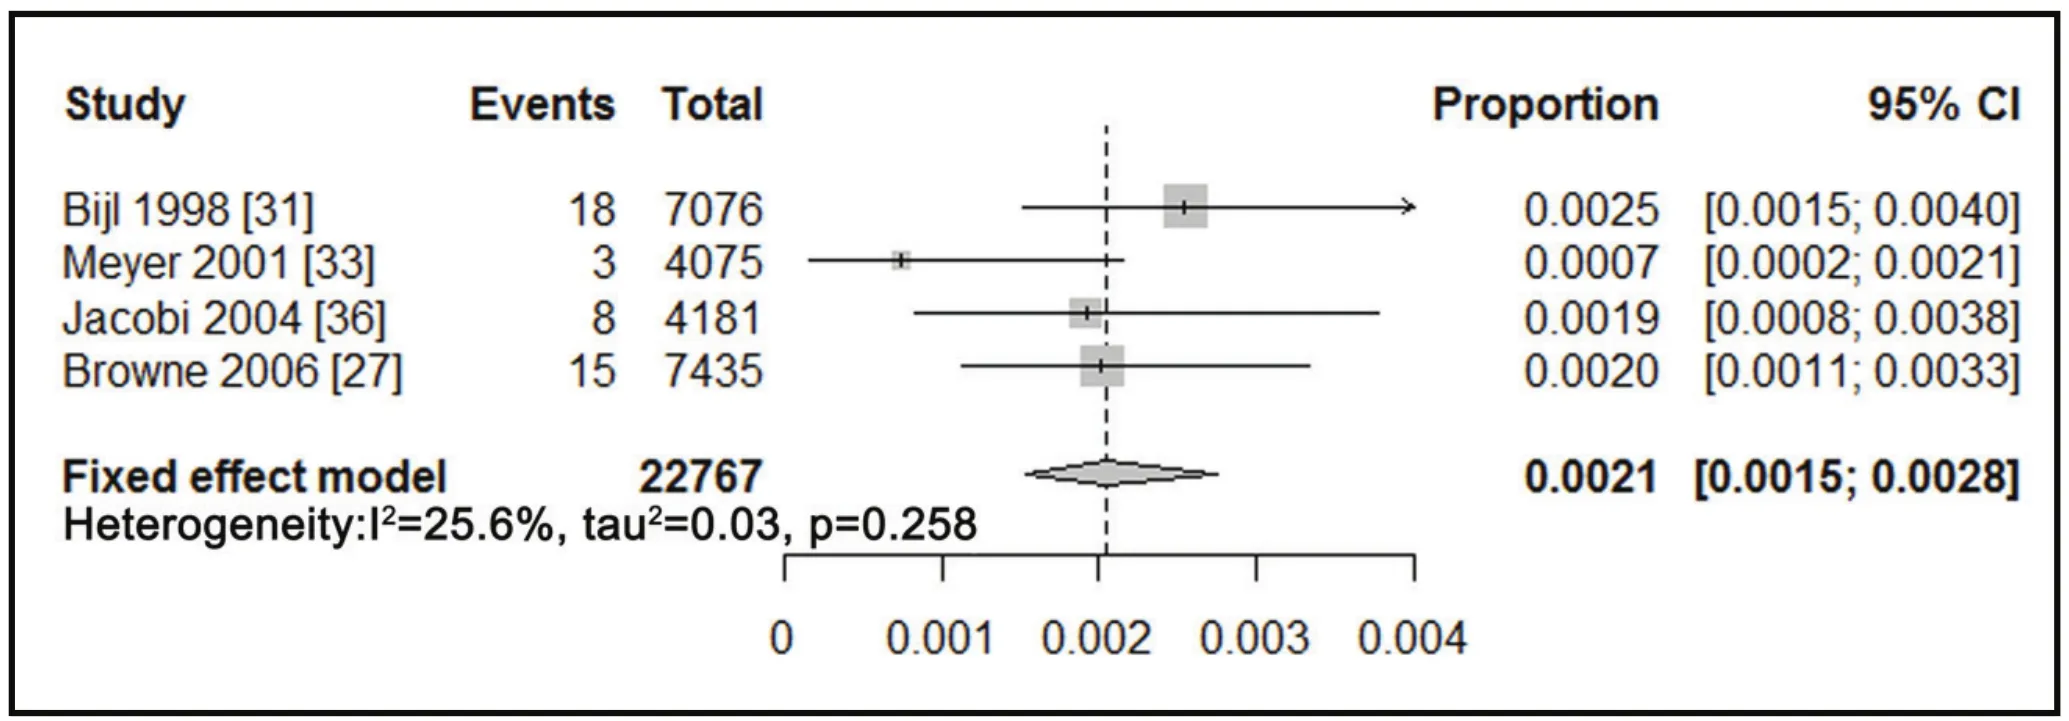
Figure 4. Forest plot of 4-week prevalence estimates of eating disorders
3.5 Subgroup analysis
As shown in Table 2, among females, the lifetime,12-month, and 4-week prevalence of ED was 4.2-, 2.6-,and 3.2-fold the corresponding prevalence in males,respectively. Similarly, the lifetime prevalence of AN,BN and BED in females were 2.2-, 3.9-, and 2.1-fold the corresponding prevalence in males. With the exception of the lifetime prevalence of BED (which was only reported by gender in two relatively small studies) all these gender ratios were statistically significant (i.e.,greater than 1).
The reported prevalence of different eating disorders varied by geographic regions. We pooled data from highincome countries in Western Europe (Netherlands,[31]Norway,[32]Germany,[33,36]and the six-nation Western European study[20]), from the United States,[30,37]from New Zealand,[25-27]and from the 10 western countries included in the WHO global study[39]to estimate the pooled prevalence of the different eating disorders for ‘Western countries’. Data from the three studies in South Korea[19,28,29]were pooled to estimate the pooled prevalence in Asia. As shown in the table, the lifetime prevalence of ED from six studies in Western European countries and New Zealand was 6.1-fold higher than the prevalence in the single study from Asia (South Korea)that reported lifetime prevalence of ED (1.29% v. 0.21%).The lifetime prevalence of AN reported in five studies from Western Europe, New Zealand and the United States was 2.5-fold that reported in three studies from South Korea (0.32% v. 0.13%). And the lifetime prevalence of BN in seven studies from Western Europe, New Zealand and the United States was 18-fold that reported from a single study in South Korea (0.90% v. 0.05%). None of the South Korean studies reported the prevalence of BED, so it was not possible to make regional comparisons of the prevalence of BED.
There was also some variation in prevalence by the time the studies were conducted with a general trend of increasing prevalence over time. The pooled lifetime prevalence of ED reported in three studies conducted from 2000 to 2009 was 29% higher that the prevalence reported in four studies conducted from 1990 to 1999 (1.17% v. 0.91%, p=0.657). The pooled lifetime prevalence of AN in four studies conducted from 2000 to 2009 was 5.0-fold higher than the pooled prevalence in three studies conducted from 1990 to 1999 and this prevalence was, in turn, 3.0-fold higher than the pooled prevalence in two studies conducted from 1980 to 1989(0.45% v. 0.09% v. 0.03%, respectively; p<0.001).However, the prevalence of BN did not show a clear increasing pattern over time; the lifetime prevalence of BN from one study conducted from 1980-1989 was 1.09%, the pooled prevalence of three studies conducted from 1990 to 1999 was 0.46%, and the pooled prevalence of four studies conducted from 2000 to 2009 was 0.89%(p=0.334).
Only one study[25](from New Zealand) reported the prevalence in different age groups. This study found lifetime prevalence of ED of 2.0%, 2.9%, 1.0% and 0.1%for individuals who were, respectively, 16 to 24 years of age, 25 to 44 years of age, 45 to 64 years of age, and 65 years of age or older. For AN and BN, both lifetime and 12-month prevalence in individuals 16 to 24 years of age and 25 to 44 years of age were higher than the corresponding prevalence in individuals 45 to 64 years of age and 65 years of age or older.
4. Discussion
4.1 Main findings
Despite our effort to identify suitable Chinese-language publications, no studies from mainland China were included in this meta-analysis. The main reasons for failure to identify suitable studies from China are that large-scale psychiatric epidemiological surveys in China do not assess subjects for eating disorders[40,41]and the epidemiological studies of eating disorders that are available are all conducted in population subgroups[42](primarily students) and do not use internationally accepted diagnostic screening instruments.[43.44]With the exception of the three studies from South Korea, we also failed to identify suitable studies from other parts of Asia or from Africa.
Results from this meta-analysis indicate that eating disorders are not rare in the general population;the prevalence of eating disorders is similar to that of impulse control disorders and illegal drug use disorder.[45]Among specific types of eating disorders, the highest prevalence was found for BED, followed by BN, and AN.This is consistent with findings from recent studies[20,37,46]and highlights the importance of BED, which was recently added to the group of eating disorders consider in the DSM-5.[9]This study also found an elevated prevalence of eating disorders among females which is consistent with previous findings.[47,48]
We found a non-significant increase in the reported prevalence of ED over time and a statistically significant increase in the reported prevalence of AN over time.Other studies have also suggested that there is an increase in eating disorders over time.[13,49]It is not possible to confirm the reasons for the increasing prevalence, but we expect that inclusion of new disorders (such as BED)in the eating disorder category and relaxation of the rigorous diagnostic criteria of AD[50]are the major reasons for increases in the reported prevalence over time.
Based on the single study that provided prevalence by age (in New Zealand), we also found a higher prevalence of eating disorders among individuals who were 16 to 44 years of age than in those who were 45 or older. This finding is consistent with previous evidence that eating disorder is more common among adolescents.[51,52]A study among Chinese college students[43]reported a lifetime prevalence of eating disorders of 3.3% and the United States National Comorbidity Survey reported a lifetime prevalence of eating disorder of 2.7% among adolescents.[51]Clearly, prevention and intervention strategies should focus on adolescents and young adults.
The observed 6.1-fold difference in the prevalence of eating disorders between Western countries and Asian countries (representated by a single study in South Korea) is consistent with findings from earlier studies.[17,18]Cultural discrepancies and variations in dietary habits may contribute to this difference, but only one country from Asia was included in the analysis, so the result must be considered preliminary.
4.2 Limitations
There are two main limitations to our results. First,different studies – even those that use the same diagnostic instruments – included different conditions under the broad category of ‘eating disorders’. Some studies limited ED to the combination of AN and BN;others included AN, BN and BED; some included atypical types of eating disorders; and some did not indicate which conditions were included. This variability in the included conditions is probably the main reason for the substantial heterogeneity in the prevalence of ED. The reported increase in prevalence over time may reflect diagnostic changes, not real changes in the prevalence of these conditions.
Second, the included studies were predominantly from high-income countries so it is unclear how representative these results are of the prevalence of eating disorders in low- and middle-income countries.This makes it is difficult to clarify the association between the prevalence of eating disorders and economic development. Moreover, there was only one country from Asia included in the analysis (South Korea) and this was a high-income country which may not be representative of other Asian countries. The reported lower prevalence in ‘Asia’ compared to Western countries may need to be reconsidered when new studies from Asian countries are conducted.
There were also some other limitations to the study. The quality measure developed from the STROBE assessed the quality of the report of the studies; it is not a direct measure of the quality of the data provided in the studies. Assessment of publication bias generally requires a minimum of 10 studies; the current report only had 7 to 9 studies that reported the lifetime and one-year prevalence of ED, AN, and BN, so the findings related to publication bias must be considered preliminary.
4.3 Implications
To the best of our knowledge, this is the first report that uses meta-analysis to summarize prevalence studies on eating disorders from around the world. Our results indicate that eating disorders are common in the general population and may be increasing, though the perceived increase may primarily be due to changes in diagnostic criteria. There is a clear elevated risk of these conditions in females and there may be a higher prevalence in western countries than in Asian countries.There are, however, serious limitations in the available epidemiological data, primarily the lack of consistency in the conditions included under the category of‘eating disorders’ and the virtual absence of acceptable epidemiological studies from low- and middle-income countries (including China).
Conflict of interest
Authors declare no conflict of interest related to this article.
Funding
The preparation of this report was supported by the Research Leadership Development Plan of the city of Shanghai (XBR2011005).
1. Mond JM, Owen C, Hay P, Rodgers B, Beumont P. Assessing quality of life in eating disorder patients. Qual Life Res 2005;14(1): 171-178.
2. Wang LY, Nichols LP, Austin SB. The economic effect of Planet Health on preventing bulimia nervosa. Arch Pediatr Adolesc Med 2011; 165(8): 756-762.
3. Padierna A, Martín J, Aguirre U, González N, Mu?oz P,Quintana JM. Burden of caregiving amongst family caregivers of patients with eating disorders. Soc Psychiatry Psychiatr Epidemiol 2013; 48(1): 151-161.
4. Johnson JG, Cohen P, Kasen S, Brook JS. Eating disorders during adolescence and the risk for physical and mental disorders during early adulthood. Arch Gen Psychiatry 2002;59(6): 545-552.
5. Swinbourne J, Hunt C, Abbott M, Russell J, St Clare T, Touyz S. The comorbidity between eating disorders and anxiety disorders: Prevalence in an eating disorder sample and anxiety disorder sample. Aust N Z J Psychiatry 2012; 46(2): 118-131.
6. Preti A, Rocchi M, Sisti D, Camboni M, Miotto P. A comprehensive meta-analysis of the risk of suicide in eating disorders. Acta Psychiatr Scand 2011; 124(1): 6-17.
7. Arcelus J, Mitchell AJ, Wales J, Nielsen S. Mortality rates in patients with anorexia nervosa and other eating disorders: a meta-analysis of 36 studies. Arch Gen Psychiatry 2011; 68(7):724-731.
8. American Psychiatric Association. Diagnostic and Statistical Manual of Mental Disorders, 4thed. Washington: American Psychiatric Association; 1994.
9. American Psychiatric Association. Desk Reference to the Diagnostic Criteria From DSM-5. Arlington: American Psychiatric Association; 2013.
10. World Health Organization. The International Classification of Diseases (10threvison). Geneva: World Health Organization; 1992.
11. Chinese Society of Psychiatry. Chinese Classification and Diagnostic Criteria of Mental Disorders (3rdedition). Jinan:Shandong Science and Technology Publisher; 2001, p.115-118. (in Chinese)
12. Hoek HW. Incidence, prevalence and mortality of anorexia nervosa and other eating disorders. Curr Opin Psychiatry 2006; 19(4): 389-394.
13. Hay PJ, Mond J, Buttner P, Darby A. Eating disorder behaviors are increasing: findings from two sequential community surveys in South Australia. PloS One 2008; 3(2): e1541.
14. Favaro A, Ferrara S, Santonastaso P. The spectrum of eating disorders in young women: a prevalence study in a general population sample. Psychosom Med 2003; 65(4): 701-708.
15. Smink FR, van Hoeken D, Hoek HW. Epidemiology of eating disorders: Incidence, prevalence and mortality rates.Curr Psychiatry Rep 2012; 14(4): 406-414.
16. Neumark-Sztainer D, Hannan PJ. Weight-related behaviors among adolescent girls and boys: results from a national survey. Arch Pediatr Adolesc Med 2000; 154(6): 569-577.
17. Makino M, Tsuboi K, Dennerstein L. Prevalence of eating disorders: a comparison of Western and non-Western countries. Med Gen Med 2004; 6(3): 49.
18. Chisuwa N, O’Dea JA. Body image and eating disorders amongst Japanese adolescents. A review of the literature.Appetite 2010; 54(1): 5-15.
19. Cho MJ, Kim J-K, Jeon HJ, Suh T, Chung I-W, Hong JP, et al.Lifetime and 12-month prevalence of DSM-IV psychiatric disorders among Korean adults. J Nerv Ment Dis 2007;195(3): 203-210.
20. Preti A, Girolamo G, Vilagut G, Alonso J, Graaf R, Bruffaerts R, et al. The epidemiology of eating disorders in six European countries: results of the ESEMeD-WMH project. J Psychiatr Res 2009; 43(14): 1125-1132.
21. Vandenbroucke JP von Elm E, Altman DG, G?tzsche PC,Mulrow CD, Pocock SJ. Strengthening the reporting of observational studies in epidemiology (STROBE): explanation and elaboration. Epidemiology 2007; 18(6): 805-835. DOI:10.1097/EDE.0b013e3181577511.
22. Williams JG, Higgins JP, Brayne CE. Systematic review of prevalence studies of autism spectrum disorders. Arch Dis Child 2006; 91(1): 8-15.
23. Higgins JP, Thompson SG, Deeks JJ, Altman DG. Measuring inconsistency in meta-analyses. BMJ 2003; 327(7414): 557-560.
24. Fang J, Lu Y. Modern Medical Statistics. Beijing: People’s Medical Publishing House; 2002, p. 202-204. (in Chinese)
25. Wells JE, Browne MAO, Scott KM, McGee MA, Baxter J,Kokaua J, et al. Prevalence, interference with life and severity of 12 month DSM-IV disorders in Te Rau Hinengaro: The New Zealand Mental Health Survey. Aust NZ J Psychiatry 2006;40(10): 845-854.
26. Browne MAO, Wells JE, Scott KM, McGee MA. Lifetime prevalence and projected lifetime risk of DSM-IV disorders in Te Rau Hinengaro: The New Zealand Mental Health Survey.Aust NZ J Psychiatry 2006; 40(10): 865-874.
27. Browne MAO, Wells JE, Scott KM. Te rau hinengaro: the New Zealand mental health survey. Wellington: Ministry of Health;2006.
28. Lee CK, Kwak YS, Yamamoto J, Rhee H, KIM YS, HAN JH, et al. Psychiatric epidemiology in Korea: Part I: gender and age differences in Seoul. J Nerv Ment Dis 1990; 178(4): 242-246.
29. Lee CK, Kwak YS, Yamamoto J, Rhee H, Kim YS, Han JH, et al.Psychiatric epidemiology in Korea: Part II: urban and rural differences. J Nerv Ment Dis 1990; 178(4): 247-252.
30. Rand CS, Kuldau JM. Epidemiology of bulimia and symptoms in a general population: sex, age, race, and socioeconomic status. Int J Eating Disord 1992; 11(1): 37-44.
31. Bijl R, Ravelli A, Van Zessen G. Prevalence of psychiatric disorder in the general population: results of the Netherlands Mental Health Survey and Incidence Study (NEMESIS).Soc Psychiatry Psychiatr Epidemiol 1998; 33(12): 587-595.
32. Kringlen E, Torgersen S, Cramer V. A Norwegian psychiatric epidemiological study. Am J Psychiatry 2001; 158(7): 1091-1098.
33. Meyer C, Rumpf HJ, Hapke U, John U. Prevalence of DSM-IV psychiatric disorders including nicotine dependence in the general population: results from the northern German TACOS study. Neurol Psychiat BR 2001; 9(2): 75-80.
34. Roca-Bennasar M, Gili-Planas M, Ferrer-Pérez V, Bernardo-Arroyo M. Mental disorders and medical conditions: a community study in a small island in Spain. J Psychosom Res 2001; 50(1): 39-44.
35. Andrade L, Walters EE, Gentil V, Laurenti R. Prevalence of ICD-10 mental disorders in a catchment area in the city of S?o Paulo, Brazil. Soc Psychiatry Psychiatr Epidemiol 2002; 37(7):316-325.
36. Jacobi F, Wittchen HU, Holting C, Hofler M, Pfister H, Muller N, et al. Prevalence, co-morbidity and correlates of mental disorders in the general population: results from the German Health Interview and Examination Survey (GHS). Psychol Med 2004; 34(4): 597-611.
37. Hudson JI, Hiripi E, Pope HG, Jr., Kessler RC. The prevalence and correlates of eating disorders in the National Comorbidity Survey Replication. Biol Psychiatry 2007; 61(3): 348-358.
38. Swanson SA, Saito N, Borges G, Benjet C, Aguilar-Gaxiola S,Medina-Mora ME, et al. Change in binge eating and binge eating disorder associated with migration from Mexico to the U.S. J Psychiatr Res 2012; 46(1): 31-37.
39. Kessler RC, Berglund PA, Chiu WT, Deitz AC, Hudson JI,Shahly V, et al. The prevalence and correlates of binge eating disorder in the World Health Organization World Mental Health Surveys. Biol Psychiatry 2013; 73(9): 904-914.
40. Zhang W, Shen Y, Li S. Epidemiological survey of mental disorders in seven areas of China. Chinese Journal of Psychiatry 1998; 31(2): 69-71. (in Chinese)
41. Phillips MR, Zhang J, Shi Q, Song Z, Ding Z, Pang S, et al.Prevalence, treatment, and associated disability of mental disorders in four provinces in China during 2001–05: an epidemiological survey. The Lancet 2009; 373(9680): 2041-2053.
42. Tong J, Miao S, Wang J, Yang F, Lai H, Zhang C, et al. A two-stage epidemiologic study on prevalence of eating disorders in female university students in Wuhan, China.Soc Psychiatry Psychiatr Epidemiol 2013; 1-7.
43. Liang X, Guo L, Liu K. Cross-sectional survey of eating disorders in 1486 female college students in Chengdu city.Chinese Journal of Epidemiology 2008; 29(4): 321-324. (in Chinese)
44. Huon GF, Mingyi Q, Oliver K, Xiao G. A large-scale survey of eating disorder symptomatology among female adolescents in the People’s Republic of China. Int J Eating Disord 2002;32(2): 192-205.
45. Demyttenaere K, Bruffaerts R, Posada-Villa J, Gasquet I,Kovess V, Lepine JP, et al. Prevalence, severity, and unmet need for treatment of mental disorders in the World Health Organization World Mental Health Surveys. JAMA 2004;291(21): 2581-2590.
46. Garrusi B, Baneshi MR. Eating Disorders and their associated risk factors among Iranian population–a community based study. Glob J Health Sci 2012; 5(1): 193-202.
47. Kjels?s E, Bj?rnstr?m C, G?testam KG. Prevalence of eating disorders in female and male adolescents (14-15 years). Eat Behav 2004; 5(1): 13-25..
48. Merikangas KR, He MJ, Burstein M, Swanson MSA,Avenevoli S, Cui ML, et al. Lifetime prevalence of mental disorders in US adolescents: Results from the National Comorbidity Study-Adolescent Supplement (NCS-A). J Am Acad Child Adolesc Psychiatry 2010; 49(10): 980.
49. Zachrisson HD, Vedul-Kjels?s E, G?testam KG, Mykletun A. Time trends in obesity and eating disorders. Int J Eating Disord 2008; 41(8): 673-680.
50. Bunnell DW, Shenker IR, Nussbaum MP, Jacobson MS, Cooper P. Subclinical versus formal eating disorders: differentiating psychological features. Int. J. Eating Disord 1990; 9(3):357-362.
51. Swanson SA, Crow SJ, Le Grange D, Swendsen J, Merikangas KR. Prevalence and correlates of eating disorders in adolescents: results from the national comorbidity survey replication adolescent supplement. Arch Gen Psychiatry 2011; 68(7): 714-723.
52. Sancho C, Asorey O. Epidemiology of eating disorders.Eur Child Adolesc Psychiatry 2007; 16(8): 495-504.
普通人群進食障礙患病率的系統綜述
錢潔1胡強2萬玉美2李婷2武牡丹2任致群1于德華1*
背景: 世界各地關于進食障礙的流行病學研究得到的患病率數據不盡一致,目前尚缺乏系統綜述研究以明確這些差別的原因所在。目的運用Meta分析的方法匯總不同地區普通人群進食障礙的患病率數據,以確定與患病率相關的因素。方法系統檢索PubMed/Medline、PsycINFO、ISI web of knowledge、Ovid、中國知識資源總庫,中國科技期刊數據庫,萬方數據,中國生物醫學文獻服務系統的數據庫,收集關于進食障礙患病率的文獻,按照預先制定的納入及排除標準篩選相關研究。采用R-2.15.2軟件進行統計分析。結果共檢索到9315篇不重復的文獻(約四分之一為中文文獻),其中僅15項研究符合納入標準,累計調查72 961人。納入的15項中無國內研究,僅一項來自于亞洲國家(韓國)。估計的進食障礙的終生患病率為1.01%(95%CI,0.54~1.89%),12個月患病率為0.37%(95%CI,0.22~0.63%),4周患病率為0.21%(95%CI,0.15~0.28%)。神經性厭食、神經性貪食、暴食性障礙的終生患病率分別為0.21%(95%CI,0.11~0.38%)、0.81%(95%CI,0.59~1.09%)、2.22%(95%CI,1.78~2.76%)。女性進食障礙終生患病率與男性之比為4.2。歐洲國家進食障礙的終生患病率約為韓國研究報告數據的6.1倍。隨著時間推移,總的進食障礙患病率有所升高,但無統計學意義,但神經性厭食癥的患病率有統計學意義的升高。結論普通人群中進食障礙較為常見,女性比男性多,西方國家比亞洲國家多。可能由于進食障礙的診斷標準有了變動,近年來報道的患病率有增高趨勢。研究局限性包括可獲得的流行病學資料非常有限,不同研究中進食障礙包括的類別有所不同以及缺少中低收入國家(包括中國)中合適的流行病學研究。
Background:The estimated prevalence of eating disorders reported in community surveys from different parts of the world varies widely but there has been no systematic attempt to identify the reasons for these differences. Objective: Use meta-analysis methods to pool data from community surveys about the prevalence of eating disorders in different locations and to identify the factors that are associated with the reported prevalence of eating disorders.Methods:Based on pre-defined inclusion and exclusion criteria, studies were identified from the following databases: PubMed/Medline, PsycINFO, ISI web of knowledge, Ovid, Chinese National Knowledge Infrastructure, Chongqing VIP database for Chinese Technical Periodicals, WANFANG DATA, and Chinese Biological Literature Service System. Statistical analysis was conducted using R software.Results:Among the 9315 unduplicated reports reviewed (one-fourth of which were published in Chinese)only 15 – with a pooled sample size of 72,961 individuals – met the inclusion criteria for the analysis. None of the included studies were from China and only one Asian country (South Korea) was included in the analysis.The estimated lifetime prevalence, 12-month prevalence, and 4-week prevalence of any eating disorder was 1.01% (95% confidence interval [CI], 0.54-1.89), 0.37% (CI, 0.22-0.63), and 0.21% (CI, 0.15-0.28), respectively.Estimated lifetime prevalence of anorexia nervosa, bulimia nervosa, and binge eating disorder was 0.21% (CI,0.11-0.38), 0.81% (CI, 0.59-1.09), and 2.22% (CI, 1.78-2.76), respectively. The estimated female-male ratio for lifetime prevalence of any eating disorder was 4.2. The lifetime prevalence of any eating disorder reported from studies conducted in Western countries was 6.1-fold greater than that reported in a single study from South Korea. Over time there has been a non-significant increase in reported prevalence of any eating disorder and a significant increase in reported prevalence of anorexia nervosa.Conclusions:Eating disorders are common in the general population, more common in women than men,and more common in Western countries than in Asian countries.The reported prevalence is increasing over time, but this may be due to changes in diagnostic criteria. There are serious limitations in the available epidemiological data, primarily differences in the conditions included among eating disorders and the lack of acceptable epidemiological studies from low- and middle-income countries (including China).
10.3969/j.issn.1002-0829.2013.04.003
1Shanghai Yangpu District Central Hospital, Tongji University School of Medicine, Shanghai, China
2Shanghai Mental Health Center, Shanghai Jiao Tong University School of Medicine, Shanghai, China
*correspondence: ydh@tongji.edu.cn
(received: 2013-08-05; accepted: 2013-08-26)
Dr. Jie Qian obtained a bachelor’s degree in clinical medicine (2007) and then received a master degree in Psychiatry and Mental Health (2010) from Tongji University School of Medicine in Shanghai. She completed her residency at the Shanghai Mental Health Center and is currently an attending physician in the clinical psychology department of the Shanghai Yangpu District Central Hospital. Her research interests include the conduct of systematic reviews and anxiety disorders.
1上海市楊浦區中心醫院;同濟大學附屬楊浦醫院 上海
2上海交通大學醫學院附屬精神衛生中心 上海
* 通信作者:ydh@tongji.edu.cn
猜你喜歡
體育科技文獻通報(2022年3期)2022-05-23 13:46:54
健康體檢與管理(2022年2期)2022-04-15 22:33:17
現代畜牧科技(2021年9期)2021-10-13 06:39:12
遼金歷史與考古(2021年0期)2021-07-29 01:06:54
現代畜牧科技(2021年3期)2021-07-21 08:42:02
昆明醫科大學學報(2021年1期)2021-02-07 01:06:44
世界科學技術-中醫藥現代化(2020年2期)2020-07-25 02:05:36
科技傳播(2019年22期)2020-01-14 03:06:54
民用飛機設計與研究(2019年4期)2019-05-21 07:21:24
首都公共衛生(2017年5期)2018-01-03 08:15:39

- 上海精神醫學的其它文章
- Power analysis for cross-sectional and longitudinal study designs
- A case of recurrent neuroleptic malignant syndrome
- Should repetitive Transcranial Magnetic Stimulation (rTMS)be considered an effective adjunctive treatment for auditory hallucinations in patients with schizophrenia?
- Effectiveness and safety of generic memantine hydrochloride manufactured in China in the treatment of moderate to severe Alzheimer’s disease: a multicenter, double-blind randomized controlled trial
- Twelve-year retrospective analysis of outpatients with Attention-Deficit/Hyperactivity Disorder in Shanghai
- Mental health literacy among residents in Shanghai