Quasi-biennial oscillation signal detected in the stratospheric zonal wind at 55-65°N
2016-11-23 02:37:00ZHANGYuandZHOULiBo
關鍵詞:信號
ZHANG Yuand ZHOU Li-Bo
aState Key Laboratory of Atmospheric Boundary Layer Physics and Atmospheric Chemistry, Institute of Atmospheric Physics, Chinese Academy of Sciences, Beijing, China;bDepartment of Lower Atmosphere Observation and Research, Institute of Atmospheric Physics, Chinese Academy of Sciences, Beijing, China;cCollege of Earth Science, University of the Chinese Academy of Sciences, Beijing, China
Quasi-biennial oscillation signal detected in the stratospheric zonal wind at 55-65°N
ZHANG Yua,b,cand ZHOU Li-Boa,b
aState Key Laboratory of Atmospheric Boundary Layer Physics and Atmospheric Chemistry, Institute of Atmospheric Physics, Chinese Academy of Sciences, Beijing, China;bDepartment of Lower Atmosphere Observation and Research, Institute of Atmospheric Physics, Chinese Academy of Sciences, Beijing, China;cCollege of Earth Science, University of the Chinese Academy of Sciences, Beijing, China
To investigate the impacts of the quasi-biennial oscillation (QBO) on high-latitude circulation and the Arctic vortex, stratospheric zonal wind at 55—65°N is analyzed. The seasonal cycle, solar cycle,and linear trend in the zonal wind at these latitudes are analyzed and removed, and the QBO signal is retrieved from the monthly zonal wind for the period 1979—2014. The zonal wind has a strong decreasing trend in winter, with a maximum decrease (less than -0.35 m s-1yr-1) occurring within 70—100°E. The zonal wind has an in-phase response of 1.6 m s-1to the solar cycle, with a maximum within 100—140°E. A clear QBO signal is detected in the zonal wind during the period 1979—2014,with an amplitude of 2.5 m s-1and a period of 30 months. The latitudinal distribution of the QBO signal is inhomogeneous, with a maximum within 120—180°E and a minimum within 25—45°E.
ARTICLE HISTORY
Revised 12 December 2015
Accepted 27 January 2016
Quasi-Biennial Oscillation;zonal wind; Arctic vortex
北極極渦是一個存在于極區對流層中上層和平流層的大尺度氣旋性環流系統, 是極區大氣運動的主要特征。赤道平流層風場的準兩年振蕩,可以對行星波的傳播進行調制,從而對北極極渦的強度產生影響。為了定量描述,赤道平流層風場的準兩年振蕩對北極極渦的影響,我們對表征北極極渦強度的55-65°N緯度帶平流層緯向風進行了分析,提取出了北極極渦中的準兩年振蕩信號,并發現了該信號的緯向不均一性,120-180°E為高值區,25-45°E為低值區。
1. Introduction
The Arctic vortex is a large-scale cyclonic circulation in the winter troposphere and stratosphere around the North Pole (Andrews, Holton, and Leovy 1987). The strong circumpolar westerly isolates the Arctic atmosphere from the lower latitudes, and formulates the nature of the Arctic atmosphere (Karpetchko, Kyr?, and Knudsen 2005). For example, total ozone in the Arctic region is much lower than in the middle and low latitudes (Zhou et al. 2001). As the edge of the Arctic atmosphere, the Arctic vortex plays an important role in the interaction between the Arctic and lower-latitude air, through large-scale dynamic processes such as blocking highs, cut-of lows, and Rossby-wave breaking (Akiyoshi and Zhou 2007; Baldwin and Holton 1988). The variation of the Arctic vortex can impact upon tropospheric systems at lower latitudes, the East Asian winter monsoon, extreme-cold events in North America,and precipitation over the North Atlantic, among other climatic phenomena (Thompson and Wallace 1998, 2002; Walter and Graf 2005; Wu and Wang 2002; Zhang, Gao,and Liu 2008). On the contrary, the Arctic vortex can also be infuenced by external factors, such as solar irradiance,ENSO, and the quasi-biennial oscillation (QBO) (Angell 1992; Labitzke and Loon 1988). Camp and Tung (2007)pointed out the important impact of solar irradiance on the variation in the Arctic vortex. Butler and Polvani (2011)revealed the infuence of ENSO on the frequency of stratospheric sudden warming. Holton and Tan (1980) found a close relationship between the strength of the Arctic vortex and the equatorial QBO, with a weaker vortex being associated with the easterly phase of the QBO.
The QBO is the dominant oscillation in the wind of the equatorial stratosphere, with easterly and westerly wind shifting in a period of about 28 months, which can propagate downwards without a decrease in amplitude (Holton 1992). Holton and Lindzen (1972) and Andrews, Holton,and Leovy (1987) discussed the momentum driving source for the QBO, and attributed it to vertically propagating equatorial Kelvin and Rossby-gravity waves. Consideringthe consistency of the QBO period, Dunkerton (1997) suggested the importance of laterally propagating Rossby waves in driving the QBO.
Through modulating the propagation of planetary waves, the impact of the QBO can spread to the atmospheric circulations of higher latitudes (Holton and Tan 1980, 1982). Since the tropical easterly of the QBO prevents the difusion of planetary-wave energy via waveguides from the higher to the lower latitudes, the mean fows in the middle and high latitudes—including the Arctic vortex—could be weakened during the easterly phase of the QBO, and vice versa (Baldwin et al. 2001). The impacts of the QBO on the mid- and high-latitude atmosphere have been widely reported (Anstey and Shepherd 2014; Dunkerton and Baldwin 1991; Gray and Russell 1999;Shi et al. 2009; Sitnov 1996; Zou and Gao 1997; Zou et al. 2005). For example, Sitnov (1996) found the QBO signal in the temperature, wind and tropopause height outside of the tropical region. Zou and Gao (1997) and Zou et al.(2005) detected an impact of the QBO on ozone variation at 60—70°S and 50—60°N. However, the impact of the QBO on the general circulation at high latitudes of the NH, especially the Arctic vortex, has yet to be detected.
As the westerly jet of the Arctic vortex generally exists within 55—65°N (Waugh and Randel 1999), the zonal wind in this zone could present the features of the circulation at the high latitudes, including the Arctic vortex. In the present study, to investigate the impacts of the QBO on high-latitude circulation and the Arctic vortex, the zonal wind at 55—65°N is analyzed, and the QBO signal in the zonal wind investigated.
2. Data and methods
The zonal wind data are from ERA-Interim (Berrisford et al. 2009; Dee et al. 2011), with a horizontal resolution of 1.5° latitude × 1.5° longitude, and 37 pressure levels from 1000 to 1 hPa. In this study, the monthly averaged zonal wind at 30 hPa within 55—65°N is selected to investigate the zonal wind variation. The zonal wind at 30 hPa over Singapore is normalized as the QBO index, and the 10.7-cm solar fux is adopted from the National Research Council of Canada(http://www.spaceweather.ca/solarfux/sx-4-en.php/) as the solar irradiance index.
The seasonal cycle, solar cycle, and linear trend in the zonal wind at 55—65°N are removed and then the ‘superimposed epoch' method (Sitnov 1996) is utilized to retrieve the QBO signal in the zonal wind within that latitudinal range. In this method, the QBO ‘key-0' time points are frstly set as the monthly easterly to westerly wind shifts at 30 hPa over Singapore, and then the monthly zonal wind anomalies at 55—65°N are averaged with ±27 month lags according to the QBO ‘key-0' time points. Negative lags correspond to the months preceding the zonal wind phase shift, and vice versa.
3. Results
3.1. Seasonal cycle
Averaging the zonal wind between 55°N and 65°N, the zonal-mean zonal wind is obtained and its seasonal variation for 1979—2014 is shown in Figure 1(a). The zonal-mean zonal wind over the 55—65°N latitude belt decreases from winter to summer and increases thereafter. The zonal-mean zonal wind reaches a minimum (-6.4 m s-1) in June and a maximum (25.3 m s-1) in January, with an amplitude of 31.7 m s-1. This seasonal cycle of zonal-mean zonal wind refects the evolution of the Arctic vortex; the vortex forms in late autumn (November) with a weak circumpolar westerly, develops in winter (December—January—February)with a strong westerly jet at the edge of the vortex (large positive zonal wind value at 55—65°N), and decays in late spring (May) with a weak easterly (small negative zonal wind value) (Akiyoshi and Zhou 2007; Nash et al. 1996;Waugh and Randel 1999).
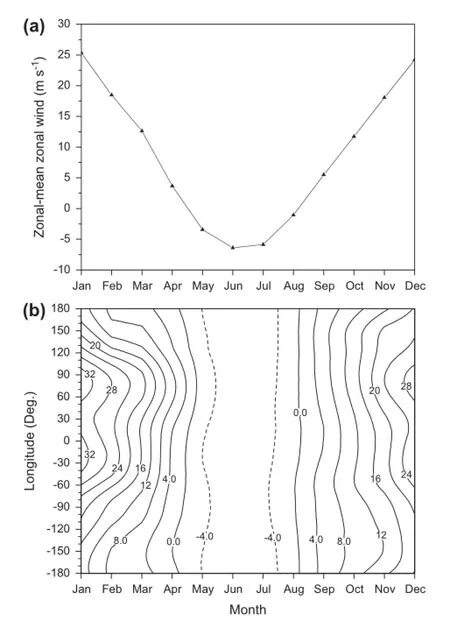
Figure 1.Seasonal cycle of zonal wind between 55°N and 65°N,averaged for 1979—2014, for the (a) zonal mean and (b) for each longitude.
Figure 1(b) further shows the longitudinal distribution of the seasonal cycle of zonal wind within 55—65°N. The zonal wind at each longitude has the same seasonal cycle as the zonal-mean situation described above, with the zonal wind decreasing from winter to summer and increasing from summer to winter. The maximum zonal wind is located in the Siberia section (60—90°E) in January with a value larger than 32.0 m s-1, while the minimum is in the Pacifc section (165°E—170°W) with a value less than -6.5 m s-1in June. The strongest zonal wind (above 34.0 m s-1) is centered at 80°E in central Russia, while the weakest (below -6.5 m s-1) is at 175°E in the Bering Sea,resulting in variability above 40.5 m s-1. The second maximum zonal wind, with a value between 32.0 and 34.0 m s-1,is found in the Atlantic section (30°W—0°).
Therefore, the zonal wind at 55—65°N has strong seasonal variation, with a weak easterly in summer and a strong westerly in winter, refecting the evolution of the Arctic vortex. The latitudinal distribution of the zonal wind is inhomogeneous, with a strong westerly in the Siberia section in winter.
3.2. Trends
Using linear regression, the seasonal trends are calculated for the zonal-mean zonal wind. The 55—65°N zonal-mean zonal wind has a strong decreasing trend in winter(December—January—February) and a weak increase in spring (March and April) during 1979—2014 (Figure 2(a)). The maximum decrease (-0.29 ± 0.05 m s-1yr-1) occurs in January and the maximum increase (0.13 ± 0.03 m s-1yr-1)in April. The winter zonal wind decrease over the 55—65°N latitudinal belt suggests a weakening of the Arctic vortex during 1979—2014, while the spring zonal wind increase indicates a long duration of the Arctic vortex, which has been reported previously for certain years, such as 1979/1980 and 1998/1999 (Langematz and Kunze 2006).
Figure 2(b) presents the seasonal trends of zonal wind at each longitude averaged for the 55—65°N latitude belt,in which statistically signifcant values are shaded. The zonal wind decreases in winter and increases in spring at each longitude during 1979—2014. The maximum decrease(less than -0.35 m s-1yr-1) occurs in the Siberia section between 70°E and 110°E from January to February, with a center (-0.38 m s-1yr-1) at 95°E in February. The maximum increase (larger than 0.20 m s-1yr-1) occurs in the south Norwegian Sea between 10°W and 20°E from March to April, with a center (-0.22 m s-1yr-1) at 10°E in April.
Therefore, the zonal wind between 55°N and 65°N has a strong decreasing trend in winter, with the maximum decrease in the Siberia section, and a weak increase in spring within 10°W—20°E during 1979—2014. This may indicate a weakening and long duration of the Arctic vortex in this period.
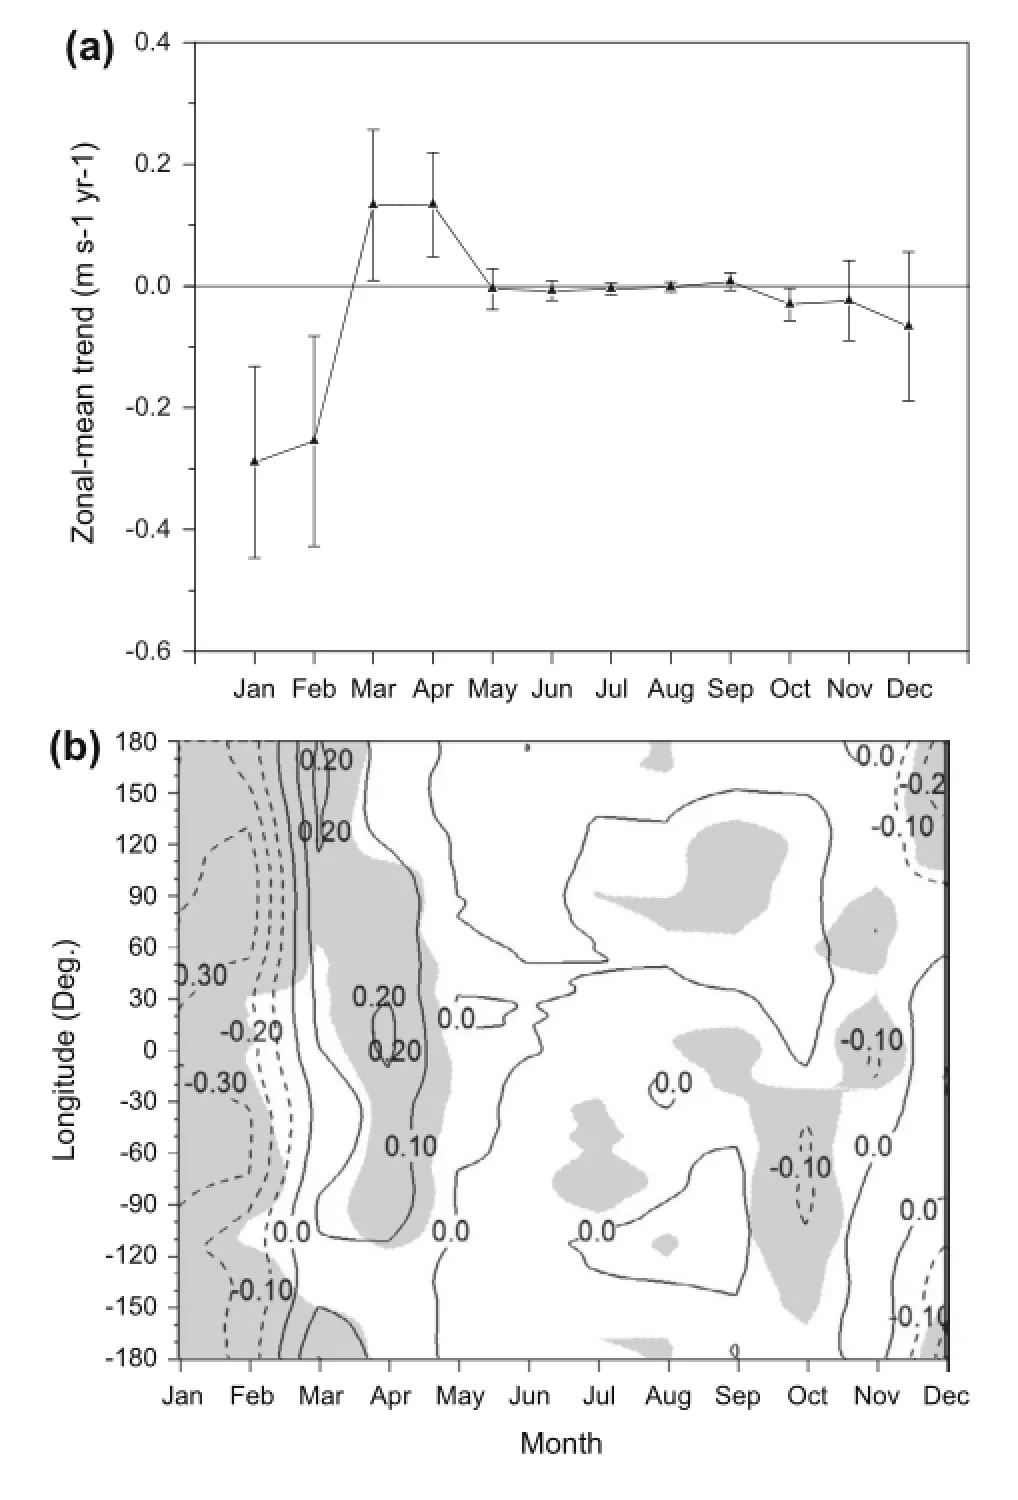
Figure 2.Seasonal trends of zonal wind at 55—65°N for the (a)zonal mean and (b) for each longitude, during 1979—2014.
3.3. Eleven-year solar cycle
Solar irradiance has important impacts on wind variation (Angell 1992), and therefore should be included as a possible factor of infuence with respect to the long-term variation in zonal wind. The zonal wind responses to the solar cycle can be obtained via a statistical regression model for the long-term variation in zonal wind, which includes the seasonal cycle, trends, and solar cycle. Figure 3 illustrates the zonal wind responses to the solar cycle during 1979—2014, in which negative areas are shaded. The zonal wind responses at 55—65°N are in-phase with the solar cycle, with a zonally averaged value of 1.6 m s-1. The maximum responses (more than 2.0 m s-1) occur within 100—140°E, while the weakest (less than 0.5 m s-1) occur within 20—40°E. The inhomogeneous solar-related zonal wind along the 55—65°N latitudinal belt might be related to the distribution of ozone. Results have shown that the distribution of total ozone in the high latitudes of the NH is inhomogeneous, with a maximum over the North Pacifcregion and a minimum over the North Atlantic region (Zou et al. 2006). The ozone can absorb the solar energy and further afect the circulation.
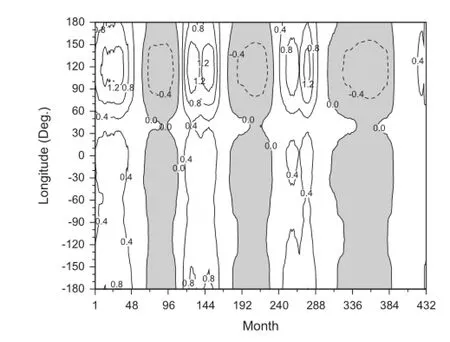
Figure 3.Zonal wind responses to the solar cycle between 55°N and 65°N, from 1979 to 2014 (432 months in total).
Therefore, an in-phase zonal wind response to the solar cycle is detected, with a zonally averaged value of 1.6 m s-1. The solar-related zonal wind response has a maximum within 100—140°E and a minimum within 20—40°E,which might be related to the inhomogeneous distribution of ozone at high latitudes.
3.4. Quasi-biennial oscillation
To investigate the impacts of the QBO on high-latitude circulation and the Arctic vortex, the monthly zonal wind anomalies for each 1.5° of longitude between 55°N and 65°N are obtained by subtracting the seasonal cycle,trends and solar cycle from the zonal wind data series and applying a seven-month smoothing. The reason for the seven-month smoothing is that seven months covers about one-quarter of the period of the QBO; the QBO normally operates at a period of 26—30 months, and thus a seven-month smoothing flters out the smaller perturbations while retaining the main components of the QBO (Zou, Ji,and Zhou 2000). Since the QBO itself is not a strictly periodic process, a superimposed epoch method (Sitnov 1996)is applied to the analysis. In this method, key-0 months of the tropical QBO are defned as the months when the QBO index changes its phase from easterly to westerly. Therefore, the QBO periods are defned by easterly and westerly months on both sides of the key-0 month. Using the above method, the zonal wind responses to the QBO are retrieved by averaging the monthly zonal wind anomalies in each lag month (lags up to ±27 months) from the QBO key-0 months. A clear in-phase QBO signal is detected in the zonal-mean zonal winds at 55—65°N (Figure 4(a)),i.e. the zonal wind anomalies have negative values in the QBO easterly phase, and vice versa. The in-phase variation of zonal wind with the QBO is mainly caused by the planetary-wave energy difusing through waveguides from the higher latitudes to the lower latitudes (Baldwin et al. 2001). From the fgure, the 55—65°N zonal-mean wind anomalies have negative values from lag -11 to lag 1 (13 months),with a minimum of -1.5 m s-1, and have positive values from lag 2 to lag 18 (17 months), with a maximum of 1.0 m s-1. Therefore, the QBO signal detected in the zonal-mean zonal wind has an amplitude of 2.5 m s-1, a period of 30 months, and a lag of about 1.5 months to the tropical QBO.
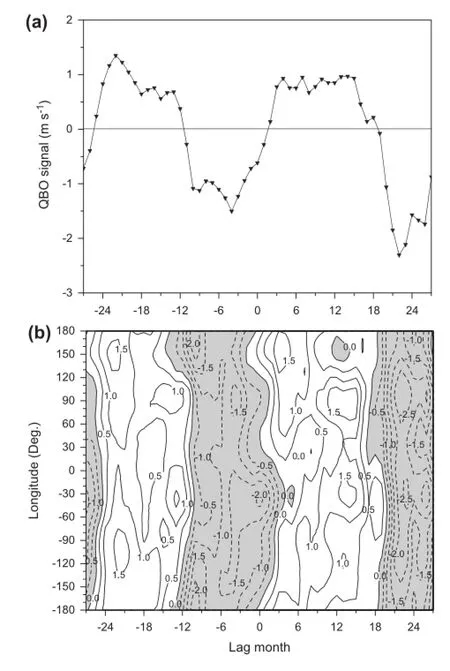
Figure 4.The QBO signal in the zonal wind, for the (a) zonal mean and (b) for each longitude.
Figure 4(b) further presents the QBO signal in zonal wind at each longitude between 55°N and 65°N. The QBO-related zonal wind variation at 55—65°N has periods of around 30 months at most longitudes, except for the Pacifc section (150°E—150°W) with its period of around 32 months. The amplitudes of the QBO signal at diferent longitudes vary from 2.2 to 4.3 m s-1, with a maximum(larger than 4.2 m s-1) within 120—180°E and a minimum(less than 2.3 m s-1) within 25—45°E. It is known that the tropical QBO signal can spread to the high latitudes,through modulation of the planetary wave propagation(Holton and Tan 1980, 1982). Suo (2008) and Zyulyaeva and Zhadin (2009) discovered an equatorward propagation of planetary waves in the stratosphere over central and eastern Siberia (90—180°E). The strong QBO signal at 55—65°N within 120—180°E can be attributed to the strong difusion along the waveguide to lower latitudes in this region.
Therefore, a clear QBO signal is detected in the zonal wind at 55—65°N, with an amplitude of 2.5 m s-1in the zonal average and a period of 30 months. The latitudinal distribution of the QBO signal in the zonal wind is inhomogeneous, featuring a maximum within 120—180°E and a minimum within 25—45°E, which could be related to the modulation of the planetary wave propagation from the Arctic region to the lower latitudes.
4. Conclusion
Based on the present study, the following conclusions can be drawn:
(1) The 55—65°N zonal wind has significant seasonal variation, with a weak easterly in summer and a strong westerly in winter, reflecting the evolution of the Arctic vortex. The latitudinal distribution of the zonal wind is inhomogeneous, with a strong westerly in the Siberia section in winter.
(2) The 55—65°N zonal wind during 1979—2014 shows
a decreasing trend in winter, with a maximum decrease in the Siberia section, and an increasing trend in spring, with a maximum increase within 10°W—20°E. This may indicate a weakening and long duration of the Arctic vortex in this period.(3) The 55—65°N zonal wind response to the 11-year solar cycle features a maximum response of 2.0 m s-1within 100—140°E and a minimum within 20—40°E.
(4) A clear QBO signal is detected in the 55—65°N zonal wind for the period 1979—2014, with an amplitude of 2.5 m s-1, a period of 30 months,and a lag of about 1.5 months to the tropical QBO. The latitudinal distribution of the QBO signal in the zonal wind is inhomogeneous, featuring a maximum within 150—180°E and a minimum within 25—45°E.
Disclosure statement
No potential confict of interest was reported by the authors.
Funding
This study was supported by the Special Fund for Meteorological Research in the Public Interest [grant number GYHY201206041];the projects entitled ‘Comprehensive Evaluation of Polar Areas in Global and Regional Climate Changes' [grant number CHINARE2015—2019]; ‘Polar Environment Comprehensive Investigation and Assessment' [grant number CHINARE2015—2019].
Notes on contributors
ZHANG Yu is a PhD candidate at the Institute of Atmospheric Physics (IAP), Chinese Academy of Sciences (CAS). His main research interests are climatology, polar vortex, and stratospheric ozone. His recent publications include papers in Acta Meteorologica Sinica, Journal of Geophysical Research Atmospheres and other journals.
ZHOU Li-Bo is a professor at IAP, CAS. His main research interests are stratospheric polar vortex, Asian monsoon, atmospheric dynamics. His recent publications include papers in Journal of Geophysical Research Atmospheres, Geophysical Research Letters,Advances in Atmospheric Sciences, Acta Meteorologica Sinica and other journals.
References
Akiyoshi, H., and L. B. Zhou. 2007. “Midlatitude and High-Latitude N2O Distributions in the Northern Hemisphere in Early and Late Arctic Polar Vortex Breakup Years.” Journal of Geophysical Research 112: D18305. doi:10.1029/2007JD008491.
Andrews, D. G., J. R. Holton, and C. B. Leovy. 1987. Middle Atmosphere Dynamics. New York: Academic Press. 313 pp.
Angell, J. K. 1992. “Relation between 300-mb North Polar Vortex and Equatorial SST, QBO, and Sunspot Number and the Record Contraction of the Vortex in 1988—89.” Journal of Climate 5: 22—29.
Anstey, J. A., and T. G. Shepherd. 2014. “High-Latitude Infuence of the Quasi-Biennial Oscillation.” Quarterly Journal of the Royal Meteorological Society 140: 1—21.
Baldwin, M. P., L. J. Gray, T. J. Dunkerton, K. Hamilton, P. H. Haynes,W. J. Randel, J. R. Holton, et al. 2001. “The Quasi-Biennial Oscillation.” Reviews of Geophysics 39: 179—229.
Baldwin, M. P., and J. R. Holton. 1988. “Climatology of the Stratospheric Polar Vortex and Planetary Wave Breaking.”Journal of the Atmospheric Sciences 45: 1123—1142.
Berrisford, P., D. Dee, K. Fielding, M. Fuentes, P. Kallberg, S. Kobayashi, and S. Uppala. 2009. The ERA-Interim Archive,Era Report Series 1, Technical Report, European Centre for Medium Range Weather Forecasts, Berkshire, UK, 23 pp.
Butler, A. H., and L. M. Polvani. 2011. “El Ni?o, La Ni?a, and Stratospheric Sudden Warmings: A Reevaluation in Light of the Observational Record.” Geophysical Research Letters 38: L13807. doi:10.1029/2011GL048084.
Camp, C. D., and K.-K. Tung. 2007. “The Infuence of the Solar Cycle and QBO on the Late-Winter Stratospheric Polar Vortex.”Journal of the Atmospheric Sciences 64: 1267—1283.
Dee, D. P., S. M. Uppala, A. J. Simmons, P. Berrisford, P. Poli, S. Kobayashi, U. Andrae, M. A. Balmaseda, G. Balsamo, and P. Bauer. 2011. “The ERA-Interim Reanalysis: Confguration and Performance of the Data Assimilation System.” Quarterly Journal of the Royal Meteorological Society 137: 553—597.
Dunkerton, T. J. 1997. “The Role of Gravity Waves in the Quasi-Biennial Oscillation.” Journal of Geophysical Research: Atmospheres 102: 26053—26076.
Dunkerton, T. J., and M. P. Baldwin. 1991. “Quasi-Biennial Modulation of Planetary-Wave Fluxes in the Northern Hemisphere Winter.” Journal of the Atmospheric Sciences 48: 1043—1061.
Gray, L. J., and J. M. Russell. 1999. “Interannual Variability of Trace Gases in the Subtropical Winter Stratosphere.” Journal of the Atmospheric Sciences 56: 977—993.
Holton, J. 1992. An Introduction to Dynamic Meteorology. 3rd ed.,435—436. San Diego, CA: Academic Press.
Holton, J. R., and R. S. Lindzen. 1972. “An Updated Theory for the Quasi-Biennial Cycle of the Tropical Stratosphere.” Journal of the Atmospheric Sciences 29: 1076—1079.
Holton, J. R., and H. C. Tan. 1980. “The Infuence of the Equatorial Quasi-Biennial Oscillation on the Global Circulation at 50 mb.”Journal of the Atmospheric Sciences 37: 2200—2208.
Holton, J. R., and H. C. Tan. 1982. “The Quasi-Biennial Oscillation in the Northern Hemisphere Lower Stratosphere.” Journal of the Meteorological Society of Japan 60: 140—148.
Karpetchko, A., E. Kyr?, and B. M. Knudsen. 2005. “Arctic and Antarctic Polar Vortices 1957—2002 as Seen from the ERA-40 Reanalyses.” Journal of Geophysical Research 110: D21109. doi:10.1029/2005JD006113.
Labitzke, K., and H. Loon. 1988. “Associations between the 11-Year Solar Cycle, the QBO and the Atmosphere. Part I: The Troposphere and Stratosphere in the Northern Hemisphere in Winter.” Journal of Atmospheric and Terrestrial Physics 50: 197—206.
Langematz, U., and M. Kunze. 2006. “An Update on Dynamical Changes in the Arctic and Antarctic Stratospheric Polar Vortices.” Climate Dynamics 27: 647—660.
Nash, E. R., P. A. Newman, J. E. Rosenfeld, and M. R. Schoeberl. 1996. “An Objective Determination of the Polar Vortex Using Ertel's Potential Vorticity.” Journal of Geophysical Research: Atmospheres 101: 9471—9478.
Shi, C. H., B. Zheng, Y. J. Chen, and Y. Bi. 2009. “The Quasi-Biennial Oscillation of Water Vapor in Tropic Stratosphere.” Chinese Journal of Geophysics 52: 2428—2435.
Sitnov, S. A. 1996. “Vertical Structure of the Extratropical Quasi-Biennial Oscillation in Ozone, Temperature, and Wind Derived from Ozonesonde Data.” Journal of Geophysical Research: Atmospheres 101: 12855—12866.
Suo, L. L. 2008. Diagnostic Study on the Mechanisms of the Stratosphere Polar Vortex Infuencing the Troposphere [D]. [In Chinese.] Beijing: Peking University.
Thompson, D. W. J., and J. M. Wallace. 1998. “The Arctic Oscillation Signature in the Wintertime Geopotential Height and Temperature Fields.” Geophysical Research Letters 25: 1297—1300.
Thompson, D. W. J., and J. M. Wallace. 2002. “Stratospheric Connection to Northern Hemisphere Wintertime Weather: Implications for Prediction.” Journal of Climate 15: 1421—1428. Walter, K., and H. F. Graf. 2005. “The North Atlantic Variability Structure, Storm Tracks, and Precipitation Depending on the Polar Vortex Strength.” Atmospheric Chemistry and Physics 5: 239—248.
Waugh, D. W., and W. J. Randel. 1999. “Climatology of Arctic and Antarctic Polar Vortices Using Elliptical Diagnostics.” Journal of the Atmospheric Sciences 56: 1594—1613.
Wu, B., and J. Wang. 2002. “Possible Impacts of Winter Arctic Oscillation on Siberian High, the East Asian Winter Monsoon and Sea-Ice Extent.” Advances in Atmospheric Sciences 19: 297—320.
Zhang, H., S. Gao, and Y. Liu. 2008. “Advances of Research on Polar Vortex.” [In Chinese.] Plateau Meteorology 27: 452—461.
Zhou, L. B., H. Zou, C. P. Ji, W. Wang, and Y. X. Jian. 2001. “The Scandinavia Ozone Loss and Surface Heating.” Advances in Atmospheric Sciences 18: 454—466.
Zou, H., and Y. Gao. 1997. “Long-Term Variation in TOMS Ozone over 60—70°S.” Geophysical Research Letters 24: 2295—2298.
Zou, H., C. Ji, and L. B. Zhou. 2000. “QBO Signal in Total Ozone over Tibet.” Advances in Atmospheric Sciences 17: 562—568.
Zou, H., P. Li, L. B. Zhou, S. Ma, and C. P. Ji. 2006. “On Low Ozone over the North Atlantic and High Ozone over the North Pacifc.” [In Chinese.] Chinese Journal of Atmospheric Science 30: 905—912.
Zou, H., L. Zhou, Y. Gao, X. Chen, P. Li, C. Ji, S. Ma, and D. Gao. 2005.“Total Ozone Variation between 50° and 60°N.” Geophysical Research Letters 32: L23812. doi:10.1029/2005GL024012.
Zyulyaeva, Y. A., and E. A. Zhadin. 2009. “Analysis of Three-Dimensional Eliassen—Palm Fluxes in the Lower Stratosphere.”Russian Meteorology and Hydrology 34: 483—490.
28 September 2015
CONTACT ZHOU Li-Bo zhoulibo@mail.iap.ac.cn
? 2016 The Author(s). Published by Taylor & Francis.
This is an Open Access article distributed under the terms of the Creative Commons Attribution License (http://creativecommons.org/licenses/by/4.0/), which permits unrestricted use, distribution, and reproduction in any medium, provided the original work is properly cited.
猜你喜歡
鴨綠江(2021年35期)2021-04-19 12:24:18
考試與評價·高一版(2020年6期)2020-11-02 02:45:24
媽媽寶寶(2019年10期)2019-10-26 02:45:34
中國生殖健康(2019年3期)2019-02-01 06:12:26
鐵道通信信號(2018年11期)2019-01-19 01:15:08
電子制作(2018年11期)2018-08-04 03:25:42
鐵道通信信號(2018年2期)2018-04-18 12:18:10
鐵道通信信號(2016年11期)2016-06-01 12:11:32
鑿巖機械氣動工具(2016年3期)2016-03-01 04:00:25
中國病理生理雜志(2015年8期)2015-12-21 12:38:06
 Atmospheric and Oceanic Science Letters2016年3期
- Atmospheric and Oceanic Science Letters的其它文章
- Discrepancies in boreal summer monsoon rainfall between GPCP and CMAP products during 1979-2014
- Analysis of ‘9.4’ unusual rainfall in Beijing during autumn 2015
- Characteristics of pressure gradient force errors in a terrain-following coordinate
- Improved simulation of the East Asian winter monsoon interannual variation by IAP/LASG AGCMs
- The relationship between the Arctic Oscillation and ENSO as simulated by CCSM4
- Estimation of the surface heat budget over the South China Sea