2005-2014年內蒙古草地火災排放污染物的時空格局
2017-02-28 11:00:27靳全鋒鞠園華楊夏捷王文輝郭福濤
草業學報 2017年2期
關鍵詞:研究
靳全鋒,鞠園華,楊夏捷,王文輝,郭福濤*
(1.福建農林大學林學院, 福建 福州 350002;2.福建農林大學海峽兩岸水土保持協同創新中心,福建 福州 350002)
2005-2014年內蒙古草地火災排放污染物的時空格局
靳全鋒1,2,鞠園華1,2,楊夏捷1,2,王文輝1,2,郭福濤1,2*
(1.福建農林大學林學院, 福建 福州 350002;2.福建農林大學海峽兩岸水土保持協同創新中心,福建 福州 350002)
火是生態系統重要干擾因子并對大氣環境和人類健康有顯著影響。該研究基于2005-2014年內蒙古地區MODIS遙感衛星火點數據,結合畜牧業統計年鑒,估算各區域草地火燃燒生物量,運用排放因子法、核密度法和克里金插值法,估算10年間內蒙古地區草原排放污染物總量及時空分布。研究結果顯示,內蒙古地區草地生物質密度存在顯著差異,由東北到西南呈遞減趨勢。此外,內蒙古地區草地火時空分布不均勻:草地火年變化呈階梯式上升趨勢,月變化呈雙峰分布,火災多集中3-4月和9-10月;空間上,火點密度從東北向西南逐漸遞減。呼倫貝爾、興安盟、通遼、赤峰、錫林郭勒盟、烏蘭察布、包頭、呼和浩特、巴彥淖爾、鄂爾多斯、烏海和阿拉善盟分別占區域總火災次數的48.1%、7.4%、2.8%、1.9%、8.3%、3.8%、4.3%、1.2%、1.0%、20.6%、0.3%和0.3%。內蒙古地區草地火災排放污染物CO2、CO、NOX、CH4、VOCS、PM2.5、OC和EC總量分別為:658.31 kt、39.09 kt、846.18 t、1.22 kt、1.87 kt、2.49 kt、1.65 kt和197.96 t。此外,各污染物排放在時間和空間上不均衡,且與草地火密度的時空分布密切相關。該文通過對內蒙古地區草原火釋放污染物的時空變化研究,為深入揭示草原火對區域環境的影響提供數據支持。
內蒙古;草地火;污染物;時空分布
火是生態系統重要干擾因子,生物質燃燒釋放大量污染對全球大氣環境、氣候變化和生態系統有顯著影響。全球有6800 Tg[1](1979)、8680 Tg[2](1990)和8600 Tg[3](2001)生物質被燃燒,研究顯示每年有2000 Tg C來源生物質火災,其中52%來源于非洲,30%來源美洲,14%來源亞洲,其他區域僅占4%[4-5]。全球有3488 Mhm2的草業資源,草地火災是最大的生物質燃燒源[6-7]。草地火災釋放大量污染性氣體(CO2、CO、CH4、NOx、SO2、VOCs、烴和鹵代物等)和顆粒物(TSP、PM10、PM2.5、PM1、OC、EC和氣溶膠等)顯著影響空氣質量和人類健康[7-9]。CO2、CH4和N2O是導致氣候變暖的主要因素[10-11],鹵代物是破壞臭氧層的元兇[12],SO2、NOx、OC和EC促進光化學煙霧形成,降低能見度[13],此外,草地火不僅破壞生態系統,同時降低土壤質量,造成水土流失[14-15]。目前關于草地火災污染物排放研究已展開,隨著科學技術發展,利用衛星遙感數據對草地火災煙氣排放檢測已成為主流方法[16-18]。
中國是居世界第二的草地資源大國,草地占國土面積的2/5,也是草地火災頻發的國家,每年有1/3的草地遭受火災的破壞[39]。由于人類活動導致草地火頻發,95%草地火由人類活動引起[19]。目前我國已開展草地火災研究,并取得一定進展[18,20-24],但以往研究主要存在以下問題,(1)研究以草地火險等級劃分為主[20-22,24],(2)研究草地火災影響因子[18-23]。此外,峰芝等[25]對內蒙古草地火災的研究表明,大面積、高強度火災排放到大氣中的污染更多,而內蒙古草地火災具有面積大、強度高等特性,這極大增加了探討內蒙古草地火災對大氣環境影響的意義。然而,目前關于內蒙古草地火災發生特點的研究還較少,尤其關于草地火災的煙氣排放問題更是鮮有報道。
鑒于此,本文綜合國內外文獻及中國畜牧業年鑒[26]對內蒙古地區過去10年間的草地火災排放污染物的時空格局進行分析。主要研究目標為: 1)估測出2005-2014年內蒙古地區草地火災時空分布。2)估算內蒙古各區域草地燃燒導致的各類污染物的排放總量。3)分析內蒙古草地火排放各類污染物的空間分布。本研究可為相關大氣模型研究和大氣環境污染評價提供科學依據。
1 材料與方法
本研究以內蒙古草地為研究區域,根據排放因子及各區域草地火災面積,估測內蒙古地區2005-2014年草地火災釋放CO2、CO、NOx、CH4、VOCs、PM2.5、OC和EC等污染物的總量及時空變化。
1.1 研究區概況
內蒙古地區位于中國北部(圖1),地理范圍是北緯37°24′-53°23′,東經97°12′-126°04′,東與黑龍江、吉林和遼寧三省接壤,西到甘肅,南與河北、山西和寧夏相鄰,北與蒙古和俄羅斯比鄰,東西跨度約2400 km,南北相距約1700 km。該區域由九市三盟組成,為溫帶大陸性季風氣候,年降水量50~450 mm,年平均氣溫0~8 ℃,季節降水不均勻,春季溫熱干旱,夏季炎熱多雨,秋季溫和少雨,寒冬降水量較少。內蒙古地區的草原從東北向西南具有明顯的地帶性分布,分別是溫帶草甸草原、溫帶典型草原、溫帶荒漠草原等植被類型,區域面積1.18×10⁵km2,占中國國土面積12.3%,草地面積7.88×10⁴km2,草地占區域面積的66.78%[23]。
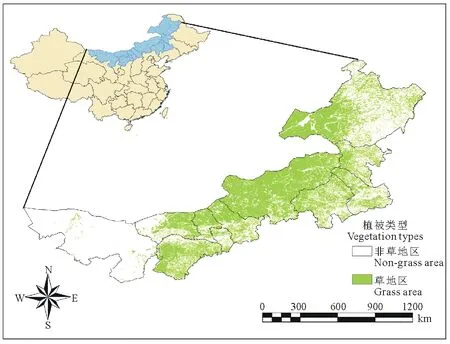
圖1 內蒙古草地空間分布Fig.1 Spatial distribution of grassland in Inner Mongolia
1.2 數據來源
2005-2014年草地火災面積數據來源于中國畜牧業年鑒[26],每年草地火面積的平均值為該火點面積;2005-2014年內蒙古草地火數據來源于MODIS(Moderate Resolution Imaging Spectrometer)1 km空間分辨率的每日尺度MOD14A1林火產品,提取2005-2014年內蒙古地區林火像素數據,MODIS林火產品在監測植被火災方面具有良好的可靠性[27],目前MODIS火點受自然因素影響,成功監測率為90%左右,但通過濾除噪聲、耀斑及云的干擾,不同區域和季節林火成功監測率高達100%[28]。研究提取了2005-2014年內蒙古地區衛星火點數據與植被類型圖(1 km空間分辨率)進行疊加(http://westdc.westgis.ac.cn/),提取草原火點數據,數據包含了每個火點地理坐標、時間和植被類型。內蒙古草地生物質密度運用陳效逑等[29]內蒙古典型草原地上生物量的空間格局及其氣候成因分析和Ma等[19]估算內蒙古溫帶草地生物量及其與環境因子的關系共同估算內蒙古草地生物質密度的空間分布,Kato等[30]草原燃燒效率采樣為96%。
1.3 排放因子的確定
排放因子是精確估測各類排放物總量的重要前提。本文綜合國內外學者研究成果,目前關于國內草地火災的排放因子的實測數據較少,本研究選用國外與中國國情相似草地燃燒的排放因子,同時對眾多研究結果取平均值作為本研究的排放因子(表1)。
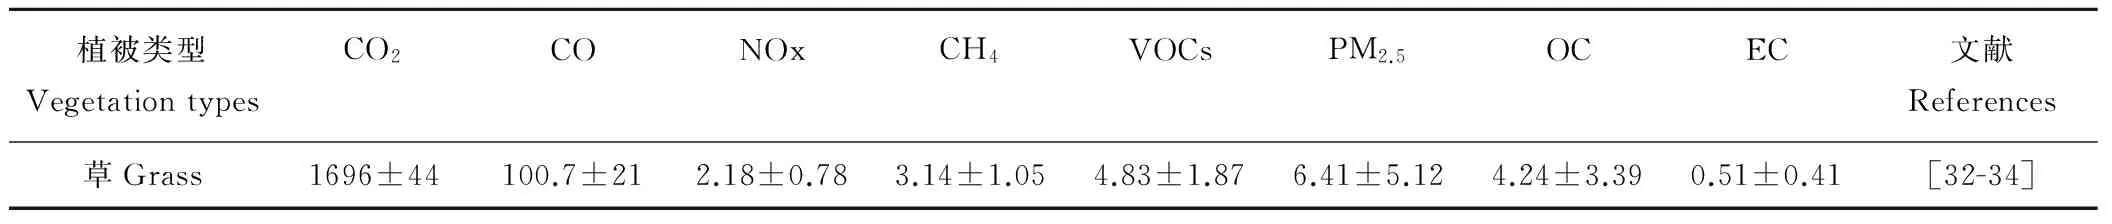
表1 草排放因子Table 1 Emission factors from grassland fire g/kg
1.4 草地燃燒量計算
草地燃燒用公式(1)進行計算[31]
Mi=A×B×EFi×η
(1)
式中,Mi為i類污染物的排放總量,kg;A為草地火災過火面積,hm2;B為單位面積草原生物量密度,t/hm2;EFi為i類污染物的排放因子,g/kg;η為草地的燃燒效率。
1.5 數據處理
利用Excel統計2005-2014年每次草地火發生時間、位置和面積,以獲取草地火時空分布特征,根據草地火點及污染物空間分布特征運用ARCGIS軟件的核密度法和克里金插值法繪制草原火密度和污染物空間分布圖。
2 結果與討論
2.1 內蒙古草地生物質密度和草原火點空間分布格局
圖2a顯示內蒙古地區草地生物質密度空間分布不均勻,生物質密度從東北向西南逐漸遞減。內蒙古草地生物質密度主要受降水、溫度、相對濕度、緯度和經度等因子影響。研究表明內蒙古區域平均降水量為250~450 mm,且呈東南向西北遞減趨勢分布,即隨著經度增加而增加,溫度隨著緯度增加而降低;內蒙古區域草地生物質密度與降水、濕度和經度呈正相關,與溫度和干燥度呈負相關[29-35]。
2005-2014年內蒙古草地區域發生12904次,年均1290次草地火點,火點在空間分布不均勻,運用ArcGIS 10.0繪制火點密度如圖2b,火點密度分布規律具有從東北向西南逐漸遞減。呼倫貝爾、興安盟、通遼、赤峰、錫林郭勒盟、烏蘭察布、包頭、呼和浩特、巴彥淖爾、鄂爾多斯、烏海和阿拉善盟分別占區域草地火48.1%、7.4%、2.8%、1.9%、8.3%、3.8%、4.3%、1.2%、1.0%、20.6%、0.3%和0.3%.該研究年均衛星火點與峰芝等[25]研究一致,由于草地火受自然因素(氣溫、降水、相對濕度等)、人為因素(放牧數量、道路密度、農田等)和生物質特性等因素影響。相關研究表明生物質密度越大、溫度越高、降水越少、相對濕度越低、放牧數量越少、距道路越近越有利于草地火災發生[21-23]。
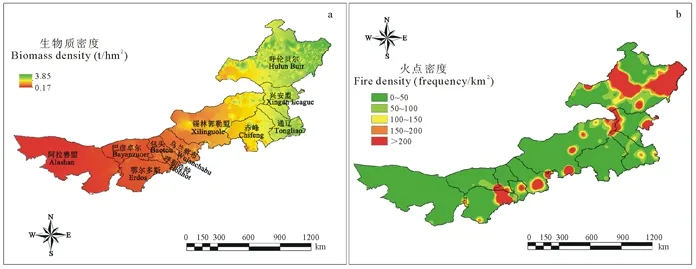
圖2 2005-2014年內蒙古地區草地生物質密度和草原火密度空間分布Fig.2 Spatial distribution of biomass density and grassland fire density in Inner Mongolia during 2005-2014
2.2 內蒙古草地火點時間分布格局

圖3 2005-2014年內蒙古地區草地火點年變化Fig.3 Temporal change grassland fire in Inner Mongolia during 2005-2014
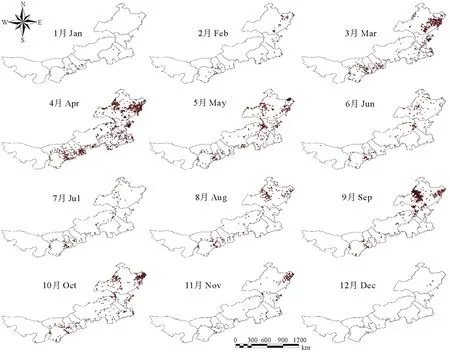
圖4 2005-2014年內蒙古地區草地火點時空分布Fig.4 Temporal change grassland fire in Inner Mongolia during 2005-2014
圖3顯示2005-2014年內蒙古地區草地火年變化呈階梯式上升趨勢。該研究與周懷林等[21]研究較為相似;草地火的年際變化受氣候條件、植被性質和人類活動等因子影響,降水、光照和溫度是草地生態系統的重要影響因子。研究表明內蒙古地區年均增溫0.034 ℃,內蒙古地區降水從東北向西南逐漸降低,有利于內蒙古東部區域草地生物質的積累,降低西部區域生物質積累[36]。氣候條件的變化、生物量積累加速及人類活動頻繁等因子共同作用促進草地火災頻發[37-38]。
圖4顯示內蒙古草地火的月際變化不均勻,火點比率呈雙峰分布,主峰顯著高于次峰, 3-5月和9-10月是草地火多發期,分別占據全年火點總量的50%和29%。該研究與周懷林等[21]研究一致,草地火集中在春、秋兩季主要受自然因素(降水、空氣濕度、溫度和風速等)、草地植被性質和植被含水率等因素影響。張正祥等[24]研究表明內蒙古草地區域春季降水較少、相對濕度低、氣溫回暖快、風速較大導致植被含水量低,前一年死亡生物質較多,極易促進草地火災形成;秋季內蒙古草地區域生物質大量死亡、降水較少、空氣濕度降低和風速較強有利于草地火災的形成,但由于氣溫下降較快降低火頻率,導致春季火災頻率顯著高于秋季;其他月份由于降水、溫度和草地屬性等因子阻礙草地火發生。
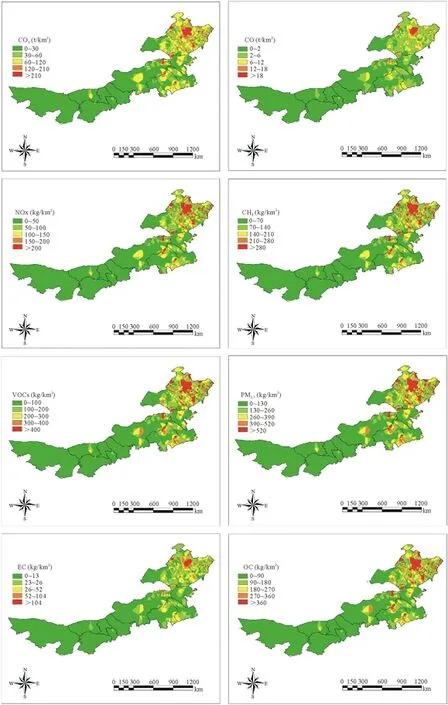
圖5 2005-2014年內蒙古草地火災排放污染物總量空間分布Fig.5 Spatial distribution of the total emissions of pollutants from grassland burned in Inner Mongolia during 2005-2014
2.3 內蒙古草地火排放污染物的空間分布格局
內蒙古草地火排放受內、外因素共同作用而不斷發生變化,運用大量靜態數據,并不能反映草地火排放動態變化,估算污染物排放通過改變計算方式逐漸逼近真實值,不可能成為真實值,以往研究表明運用平均值是減少誤差的常用估算方法。估算草地火污染物排放量分別運用草地火每年平均面積、生物質密度和平均排放因子等共同估算污染物排放總量,如圖5顯示各區域污染物排放總量差異很大,各污染物分布有所不同,2005-2014年中國內蒙古地區草地火災排放污染物CO2、CO、NOx、CH4、VOCs、PM2.5、OC和EC總量分別為:619.43 kt、36.78 kt、796.20 t、1.15 kt、1.76 kt、2.34 kt、1.55 kt和186.27 t,年均排放量分別為:61.94 kt、3.68 kt、79.62 t、114.68 t、176.41 t、234.11 t、154.86 t和18.63 kt;呼倫貝爾由于草地火災產生污染物總量為550.83 kt,主要污染物CO2、CO、NOx、CH4、VOCs、PM2.5、OC和EC總量分別為:480.59 kt、28.53 kt、617.74 t、889.77 t、1.37 kt、1.82 kt、1.20 kt和144.52 t;興安盟、通遼、赤峰、錫林郭勒盟、烏蘭察布、包頭、呼和浩特、巴彥卓、鄂爾多斯、烏海和阿拉善盟區域草地火災釋放污染物總量分別為:45.80 kt、14.63 kt、12.91 kt、38.46 kt、3.65 kt、14.11 kt、2.86 kt、2.39 kt、13.18 kt、298.49 t和546.27 t;CO2、CO、NOx、CH4、VOCs、PM2.5、OC和EC等污染物排放分別在各區域占比為93.29%、5.54%、0.12%、0.17%、0.27%、0.35%、0.23%和0.03%;根據空氣質量標準將污染物劃分為5個等級,單位面積內草地火排放污染物如圖5所示。由圖5可知單位面積最大污染物濃度是CO2> CO > PM2.5> EC >VOCs >OC >CH4>NOx,且污染濃度最大區域集中在火密度較高區域(圖2b),呼倫貝爾、興安盟、通遼、赤峰、錫林郭勒盟等區域草地火密度較大,其他區域相對較小;污染物CO2、CO、NOx、CH4、VOCs、PM2.5、OC和EC排放高低和草地火密度有密切正相關,草地火受自然因素和社會經濟因素共同影響[24]。草地是陸地生態系統重要組成部分,是生物圈中初級生產者,是牧區經濟社會可持續發展的物質基礎。草地火災是牧草區域危害最大的自然災害,草地燒毀嚴重威脅畜牧業發展,草地火災可燒毀草地植被、牧民住房以及對人畜生命造成嚴重威脅[39];由于草地火災頻發及大量污染物排放發生造成草地植被覆蓋度降低,水土流失嚴重導致土壤貧瘠甚至形成荒漠化造成生態環境的惡性循環[40-42]。
2.4 內蒙古草地火排放比較及不確定分析
研究表明草地火排放受生物質密度、燃燒效率、氣相因子和經濟社會等因素影響。本研究草地火災資料分別來源畜牧業年鑒和MODIS衛星火點數據,具有較高可信度。在估算草地顆粒物排放時,需要引入燃燒效率系數和排放因子,而燃燒效率和排放因子受燃燒方式、自然環境等因素影響,目前國內關于該研究尚未見報,因此本研究以多種草燃燒實測數據的平均值作為本研究排放因子,增加草地火排放研究結果的可靠性,但由于國內對內蒙古草地燃燒排放因子及燃燒效率缺少試驗研究,導致了本研究結論在內蒙古草地污染物排放的空間異質性方面缺少考慮,今后還需要加強草地火污染物排放的實測工作,以便充分考慮內蒙古不同草地的污染物排放特性,進一步提高草業火災污染物排放估測的準確性。
Yan等[39]研究內蒙古地區草地火排放CO2、CO、NOx、CH4、VOCs和PM2.5分別為20.56 kt、1.10 kt、19.34 t、68.20 t、52.32 t和52.33 t,本研究與該研究結果較為接近;陸炳等[34]研究內蒙古地區生物質燃燒排放CO2、CO、NOx、CH4、VOCs和PM2.5分別為18.2 mt、1.97 mt、23.9 kt、88.7 kt、171.5 kt和96.3 kt,該研究結果是本研究的290倍,顯著高于本研究。由于該研究為室內生物質燃燒排放污染物總量,而本研究僅對草地燃燒進行了估算,故研究結論有較大差異。
3 結論
本文利用衛星火點數據結合中國畜牧業年鑒并采用排放因子法,對2005-2014年間內蒙古地區草地生物質分布及草地火排放污染物CO2、CO、NOx、CH4、VOCs、PM2.5、OC和EC的總量和時空分布進行系統的研究,得到如下主要結論。
(1)內蒙古地區草地生物質密度空間分布不均勻,生物質密度從東北向西南逐漸遞減。
(2)內蒙古地區草地火災時間和空間上不均衡分布,草地火多集中在春、秋兩季;2005-2014年間內蒙古地區草地火年比率的變化呈階梯式上升趨勢;火點在空間分布不均勻,火點密度分布規律具有從東北向西南逐漸遞減的趨勢。
(3)2005-2014年內蒙古地區草地火災排放污染物CO2、CO、NOx、CH4、VOCs、PM2.5、OC和EC總量分別為:619.43 kt、36.78 kt、796.20 t、1.15 kt、1.76 kt、2.34 kt、1.55 kt和186.27 t,年均排放量分別為:61.94 kt、3.68 kt、79.62 t、114.68 t、176.41 t、234.11 t、154.86 t和18.63 kt;各污染物排放在時間和空間上不均衡,各污染物排放量多集中在呼倫貝爾東北和西北地區、興安盟、通遼和錫林郭勒盟交匯處、烏蘭察布東南部、呼和浩特東北地區和鄂爾多斯、巴彥淖爾和包頭交匯區域等區域。
References:
[1] Crutzen P J, Heidt L E, Krasnec J P,etal. Biomass burning as a source of atmospheric gases CO, H2, N2O, NO, CH3Cl and COS. Nature, 1979, 282: 253-256.
[2] Levine J S. Global biomass burning: atmospheric, climatic and biospheres’ implications. Atmospheric Climatic & Biospheric Implications, 1991, 71(37): 1075-1077.
[3] Andreae M O, Merlet P. Emission of trace gases and aerosols from biomass burning. Global Biogeochemical Cycles, 2001, 15(4): 955-966.
[4] Penner J E, Zhang S, Ito A. Estimates of Black Carbon Emissions from Open Biomass Burning[C]. London: American Geophysical Union Fall Meeting, 2004.
[5] Van D W G R, Randerson J T, Giglio L,etal. Interannual variability of global biomass burning emissions from 1997 to 2004. Atmospheric Chemistry & Physics Discussions, 2006, 6(2): 3175-3226.
[6] Balezentiene L, Uzupis A, Mednis M. Fuzzy TOPSIS method applied for evaluation of mitigation strategies for greenhouse gas emissions from abandoned grassland. Applied Information and Communication Technologies, 2012, 75(3): 242-249.
[7] Sinha P, Hobbs P V, Yokelson R J,etal. Emissions of trace gases and particles from savanna fires in southern Africa: Safari 2000-Southern African regional science initiative. Journal of Geophysical Research, 2003, 108(D13): 315-323.
[8] Cheng Z L, Lam K S, Chan L Y,etal. Chemical characteristics of aerosols at coastal station in Hong Kong. II. Seasonal variation of major ions, halogens and mineral dusts between 1995 and 1996. Atmospheric Environment, 2000, 34(17): 2771-2783.
[9] Ma W, Yang Y, He J,etal. Above- and belowground biomass in relation to environmental factors in temperate grasslands, Inner Mongolia. Science China Life Sciences, 2008, 51(3): 263-270.
[10] Andreae M O, Atlas E, Cachier H,etal. Trace gas and aerosol emissions from savanna fires. Atmospheric Chemistry & Physics, 1996, 33(3): 271-280.
[11] Iii W R C, Levine J S, Winstead E L,etal. Source compositions of trace gases released during African savanna fires. Journal of Geophysical Research Atmospheres, 1996, 101(D19): 23597-23602.
[12] Burling I R, Yokelson R J, Griffith D W T,etal. Laboratory measurements of trace gas emissions from biomass burning of fuel types from the southeastern and southwestern United States. Atmospheric Chemistry & Physics, 2010, 10(22): 11115-11130.
[13] Fernandes A P, Alves C A, Gon?alves C,etal. Emission factors from residential combustion appliances burning Portuguese biomass fuels. Journal of Environmental Monitoring, 2011, 13(11): 3196-3206.
[14] Levine J. Influence of Biomass Burning Emissions on Precipitation Chemistry in the Equatorial Forests of Africa[M]. London: Massachusetts Institute of Technology Press, 1991: 167-173.
[15] Yokelson R J, Bertschi I T, Christian T J,etal. Trace gas measurements in nascent, aged, and cloud-processed smoke from African savanna fires by airborne Fourier transform infrared spectroscopy (AFTIR). Journal of Geophysical Research, 2003, 108(13): 267-289.
[16] Lee B S, Alexander M E, Hawkes B C,etal. Information systems in support of wildland fire management decision making in Canada. Computers & Electronics in Agriculture, 2002, 37(1): 185-198.
[17] Matthews S. A comparison of fire danger rating systems for use in forests. Australian Meteorological & Oceanographic Journal, 2009, 58(1): 41-48.
[18] Liu X P, Zhang J Q, Tong Z J. Modeling the early warning of grassland fire risk based on fuzzy logic in Xilingol, Inner Mongolia. Natural Hazards, 2015, 75(75): 2331-2342.
[19] Zhang J Q, Zhang H, Tong Z J,etal. Loss assessment and grade partition of grassland fire disaster in Northern China. Acta Prataculturae Sinica, 2007, 16(6): 121-128. 張繼權, 張會, 佟志軍, 等. 中國北方草原火災災情評價及等級劃分. 草業學報, 2007, 16(6): 121-128.
[20] Li X H, Wu W J, Zhang C,etal. Influence of climate change on north-eastern of Inner Mongolia grassland forest fire. Journal of Arid Land Resources & Environment, 2011, 25(11): 114-119.
[21] Zhou H L, Wang Y H, Zhou G S. Temporal and spatial dynamics of grassland fires in Inner Mongolia. Acta Prataculturae Sinica, 2016, 25(4): 16-26. 周懷林, 王玉輝, 周廣勝. 內蒙古草原火的時空動態特征研究. 草業學報, 2016, 25(4): 16-25.
[22] Li N, Bao Y L, Yin S,etal. Spatiotemporal characteristics of grassland fire in China mongolia border regions. Journal of Catastrophology, 2016, 31(3): 207-210. 麗娜, 包玉龍, 銀山, 等. 中蒙邊境地區草原火時空分布特征分析. 災害學, 2016, 31(3): 207-210.
[23] Qu Y P, Zheng S X, Bai Y F. Spatiotemporal patterns and driving factors of grassland fire on Mongolian Plateau. Chinese Journal of Applied Ecology, 2010, 21(4): 807-813. 曲熠鵬, 鄭淑霞, 白永飛. 蒙古高原草原火行為的時空格局與影響因子. 應用生態學報, 2010, 21(4): 807-813.
[24] Zhang Z X, Zhang H Y, Li D X,etal. Spatial distribution pattern of human-caused fires in Hulunbeir grassland. Acta Ecologica Sinica, 2013, 33(7): 2023-2031. 張正祥, 張洪巖, 李冬雪, 等. 呼倫貝爾草原人為火空間分布格局. 生態學報, 2013, 33(7): 2023-2031.
[25] Feng Z, Bao Y L, Pao Y H,etal. Analysis of spatial and temporal characteristics of fire behavior in Inner Mongolia grassland[C]. Hohhot: Risk analysis and information technology in crisis response, 2014. 峰芝, 包玉龍, 泡玉海, 等. 內蒙古牧區草原火行為時空特征分析[C]. 呼和浩特: 風險分析和危機反應中的信息技術, 2014.
[26] Yearbook Editorial Board China. Animal Husbandry Livestock Yearbook[M]. Beijing: China Agriculture Press, 2006-2015. 中國畜牧業年鑒編輯委員會. 中國畜牧業年鑒[M]. 北京: 中國農業出版社, 2006-2015.
[27] Amraoui M, Pereira M G, Dacamara C C,etal. Atmospheric conditions associated with extreme fire activity in the Western Mediterranean region. Science of the Total Environment, 2015, 524: 32-39.
[28] Zhou X C, Wang X Q. Validate and improvement on arithmetic of identifying forest fire based on EOS-MODIS data. Remote Sensing Technology & Application, 2006, 21(3): 206-211. 周小成, 汪小欽. EOS-MODIS數據林火識別算法的驗證和改進. 遙感技術與應用, 2006, 21(3): 206-211.
[29] Chen X Q, Zheng T. Spatial patterns of aboveground gicmass and its climatie attributions in typical steppe of Inner Mongolia. Scientia Geographica Snica, 2008, 28(3): 369-374. 陳效逑, 鄭婷. 內蒙古典型草原地上生物量的空間格局及其氣候成因分析. 地理科學, 2008, 28(3): 369-374.
[30] Kato E, Kawamiya M, Kinoshita T,etal. Development of spatially explicit emission scenario from land-use change and biomass burning for the input data of climate projection. Procedia Environmental Sciences, 2011, 6(1): 146-152.
[31] Seiler W, Crutzen P J. Estimates of gross and net fluxes of carbon between the biosphere and the atmosphere from biomass burning. Climatic Change, 1980, 2(3): 207-247.
[32] Urbanski S. Wildland fire emissions, carbon, and climate: Emission factors. Forest Ecology & Management, 2014, 317(2): 51-60.
[33] Liu Y, Goodrick S, Heilman W. Wildland fire emissions, carbon, and climate: Wildfire-climate interactions. Forest Ecology & Management, 2014, 317(2): 80-96.
[34] Lu B, Kong S F, Han B,etal. Inventory of atmospheric pollutants discharged from biomass burning in China continent in 2007. China Environmental Science, 2011, 31(2): 186-194. 陸炳, 孔少飛, 韓斌, 等. 2007年中國大陸地區生物質燃燒排放污染物清單. 中國環境科學, 2011, 31(2): 186-194.
[35] Zhang H B, Tang H J, Yang G X,etal. Changes of spatial-temporal characteristics based on MODIS NDVI data in Inner Mongolia grassland from 2000 to 2008. Transactions of the Chinese Society of Agricultural Engineering, 2009, 25(9): 168-175. 張宏斌, 唐華俊, 楊桂霞, 等. 2000-2008年內蒙古草原MODIS NDVI時空特征變化. 農業工程學報, 2009, 25(9): 168-175.
[36] Zhang X Y, Hu Y F, Zhuang D F,etal. The spatial pattern and differentiation of NDVI in Mongolia Plateau. Geographical Research, 2009, 28(1): 10-18. 張雪艷, 胡云鋒, 莊大方, 等. 蒙古高原NDVI的空間格局及空間分異. 地理研究, 2009, 28(1): 10-18.
[37] Guo F T, Wang G Y, Su Z W,etal. What drives forest fire in Fujian, China? Evidence from logistic regression and Random Forests. International Journal of Wildland Fire, 2016, 25: 505-519.
[38] Guo F T, Su Z W, Wang G Y,etal. Wildfire ignition in the forests of southeast China: Identifying drivers and spatial distribution to predict wildfire likelihood. Applied Geography, 2016, 66: 12-21.
[39] Yan X, Ohara T, Akimoto H. Bottom-up estimate of biomass burning in mainland China. Atmospheric Environment, 2006, 40(27): 5262-5273.
[40] Hernandez-Leal P A, Arbelo M, Gonzalez-Calvo A. Fire risk assessment using satellite data. Advances in Space Research, 2006, 37(4): 741-746.
[41] Venkataraman C, Joshi P, Sethi V,etal. Aerosol and carbon monoxide emissions from low-temperature combustion in a sawdust packed-bed stove. Aerosol Science & Technology, 2004, 3(1): 50-61.
[42] Jaiswal R K, Mukherjee S, Raju K D,etal. Forest fire risk zone mapping from satellite imagery and GIS. International Journal of Applied Earth Observation & Geoinformation, 2002, 4(1): 1-10.
Temporal and spatial patterns of emissions and pollutants from grassland burned in Inner Mongolia during 2005-2014
JIN Quan-Feng1,2, JU Yuan-Hua1,2, YANG Xia-Jie1,2, WANG Wen-Hui1,2, GUO Fu-Tao1,2*
1.FujianAgricultureandForestryUniversity,Fuzhou350002,China; 2.Co-innovationCenterforSoilandWaterConservationinRedSoilRegionoftheCross-straits,FujianAgricultureandForestryUniversity,Fuzhou350002,China
Fire is an important disturbance in ecosystems, and fires significantly affect the atmospheric environment and human health. Combining MODIS satellite data for the Inner Mongolia region during 2005-2014 and data from the Animal Husbandry Statistical Yearbook, we estimated the burnt biomass of regional grassland. The total emissions and spatial and temporal distribution of pollutants from grassland fires during 2005-2014 were also explored using emission factor, kernel density, and kriging interpolation methods. The results indicated that the density of burned grassland biomass differed within Inner Mongolia, decreasing from the northeast to the southwest parts of Inner Mongolia. The grassland fires were distributed unevenly, both spatially and temporally, in the study area. The grassland fires showed a stable annual growth and mainly occurred in March-April and September-October every year, showing two distinct peaks. Spatially, the distribution of fire point density gradually decreased from the northeast to the southwest parts of the study area. The proportions of total grassland fires in the various regions of Inner Mongolia were as follows: Hulun Buir (48.1%), Xing’an League (7.4%), Tongliao (2.8%), Chifeng (1.9%), Xilinguole (8.3%), Wulanchabu (3.8%), Baotou (4.3%), Hohhot (1.2%), Bayanzuoer (1.0%), Erdos (20.6%), Wuhai (0.3%), and Alashan (0.3%). During the period of 2005-2014, the total emissions of various substances were as follows: CO2(658.31 kt), CO (39.09 kt), NOx (846.18 t), CH4(1.22 kt), volatile organic compounds (1.87 kt), particulate matter smaller than 2.5 μm (2.49 kt), organic carbon (1.65 kt), and elemental carbon (197. 96 t). The emission of each type of pollutant varied spatially and temporally and was significantly correlated with the density distribution of fires. In this study, we explored the spatial and temporal dynamic changes in pollutants emitted from grassland fires in Inner Mongolia. This information will underpin further research on this regional environment by providing a robust database.
Inner Mongolia; grassland fire; pollutants; temporal and spatial distribution
10.11686/cyxb2016337
http://cyxb.lzu.edu.cn
2016-09-06;改回日期:2016-11-17
國家自然科學基金(31400552),福建農林大學杰出青年基金項目(xjq201613),福建省自然科學基金(2015J05049)和福建省教育廳省屬高校專項(JK2014012)資助。
靳全鋒(1988-),男,安徽阜陽人,在讀碩士。E-mail:jinquanfeng2006@126.com
*通信作者Corresponding author. E-mail:guofutao@126.com
靳全鋒, 鞠園華, 楊夏捷, 王文輝, 郭福濤. 2005-2014年內蒙古草地火災排放污染物的時空格局. 草業學報, 2017, 26(2): 21-29.
JIN Quan-Feng, JU Yuan-Hua, YANG Xia-Jie, WANG Wen-Hui, GUO Fu-Tao. Temporal and spatial patterns of emissions and pollutants from grassland burned in Inner Mongolia during 2005-2014. Acta Prataculturae Sinica, 2017, 26(2): 21-29.
猜你喜歡
體育科技文獻通報(2022年3期)2022-05-23 13:46:54
天津外國語大學學報(2021年3期)2021-08-13 08:32:18
遼金歷史與考古(2021年0期)2021-07-29 01:06:54
科技傳播(2019年22期)2020-01-14 03:06:54
遼金歷史與考古(2019年0期)2020-01-06 07:45:20
民用飛機設計與研究(2019年4期)2019-05-21 07:21:24
電子制作(2018年11期)2018-08-04 03:26:04
汽車工程學報(2017年2期)2017-07-05 08:13:02
國際商務財會(2017年8期)2017-06-21 06:14:14
電子制作(2017年23期)2017-02-02 07:17:19