A note on measuring the non-linear dependence via sub-copula based regression
2018-01-23 08:40:55WEIZhengZHANGRui
西北大學學報(自然科學版) 2018年1期
WEI Zheng, ZHANG Rui
(1.Department of Mathematics and Statistics, University of Maine, Orono, ME,04469-5752,USA;2.School of Mathematics,Northwest University, Xi′an 710127, China)
1 Introduction
Dependence or association modeling between two random variables plays an important role in statistics literature.Measuring the strength of various association has an extensive body of literature.The most prominent and popular measures of associations between random variables include but not limited to Pearsons correlation coefficient[1],Spearmansρ[2]and Kendallsτ[3].
However,these measures are not suitable if the data shows the non-linear relationship between the variables.This is because Pearsons correlation coefficientronly measures the linear relationship of random variables, Spearmansρand Kendallsτare measures of monotonic relationships. As a motivation, we provide a simple example below.
Example1AssumeXi,Yi,i=1,…,n, are identical and independent distributed(i.i.d.) random variables withYi=5(Xi-0.5)2+σ∈i,Xifollows uniform distribution on [0,1], and ∈i,i=1,…,nare i.i.d. standard normal random variables. Thus, the true model considered here is that the random variableYis a non-linear(quadratic) function ofX(not vice versa). We simulate the data forn=300, 1 000 and provide the scatter plots in Fig.1.
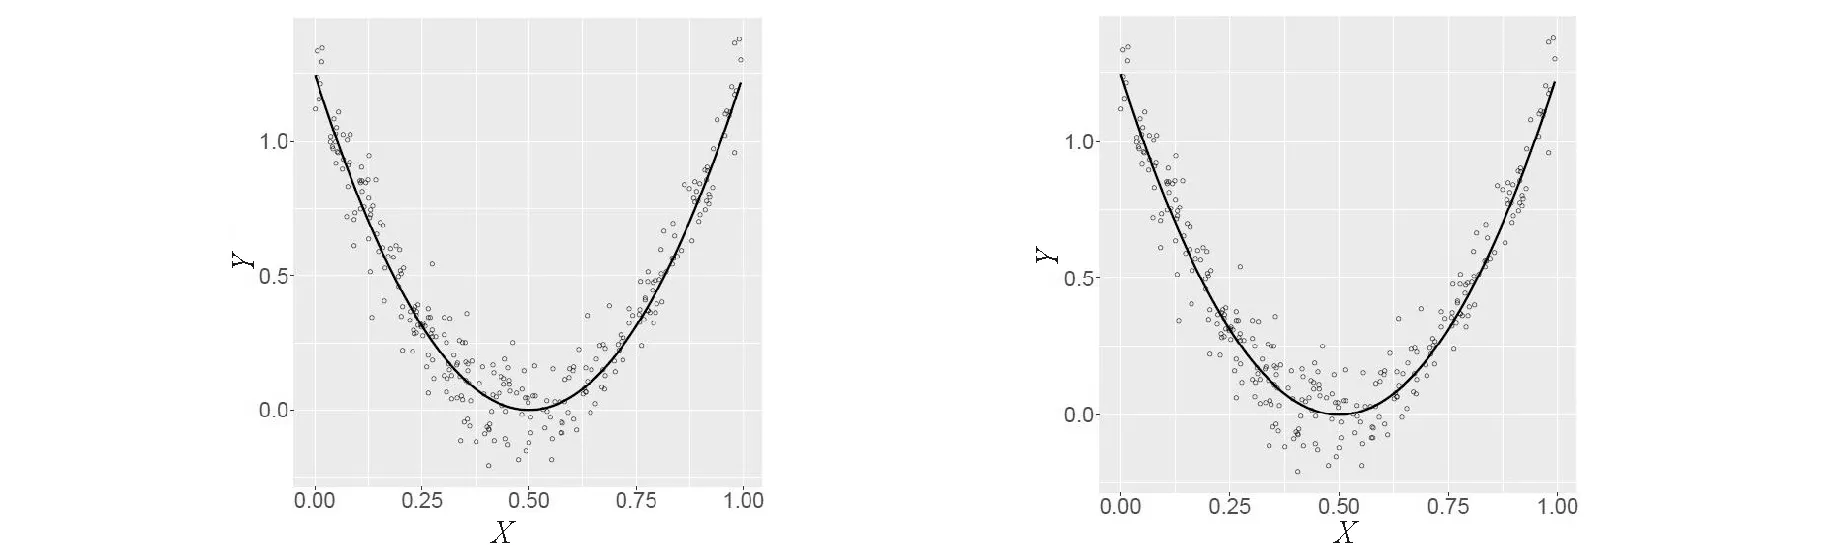
Fig.1 Scatterplots of bivariate data generated from the true model Yi=5(Xi-0.5)2 (solid line) with respect to the sample size n=300 (left), and 1 000 (right)
The plots in Fig.1 indicate strong nonlinear relationship between the variables, however,the Pearson′s correlation coefficientr=0.021,Spearmansρ=-0.008, and Kendallsτ=-0.004 forn=300 andr=-0.02,ρ=-0.003, andτ=-0.009 forn=1 000 are all very small (close to zero).
Example 1 shows that it is in contrast to the common belief that linear relationship is more revealing about the underlying random variables than nonlinear relationship. We expect that these problems would be even more severe and more difficult to detect for high dimensional predictors.
In statistical association analysis, it is often assumed the relevant random variable follows some parametric distribution families. The parametric approach often suffers from possible shortcomings induced by the misspecification of the parametric family. Additionally, even for the same type of association and same marginal distribution the associated joint distributions could be very different.
Therefore, a natural questions is how we can determine or quantify the general association(linear or nonlinear) between random variablesXandYby utilizing a non-parametric approach. In this article, we review a new asymmetric dependence measure based on subcopula based regression which was proposed by Wei and Kim[4]and focus on the association analysis between continuous random variables considering toth interaction directionality and nonlinearity. The rest of the article is structured as follows. Section 2 briefly reviews the definition of the subcopula and the asymmetric dependence measure for contingency based on subcopula based regression proposed in[4](Wei and Kim,2017). Then, section 3 examines the use of the measure for nonlinear association for data generated from continuous random variables. We end this article by a conclusion section.
2 Review on subcopula and Subcopula-based measure of asymmetric association for contingency tables
In this section, we briefly reviews the definition of subcopulas and the asymmetric dependence measure for contingency based on subcopula based regression which was proposed in[4](Wei and Kim, 2017).
2.1 Review on subcopula
Copula is a technique to introduce and investigate the dependence between variables of interests.Copulas are frequently applied in many application areas including fiance[5-8],insurance[9](Jaworski et al.,2010),risk management[10](Embrechts et al.,2002),health[11](Eluru et al.,2010) and environmental sciences[12](Zhang and Singh,2007).Here,we briefly review the definition of the bivariate subcopula and copula function.For more details about the copula and dependence concepts in terms of subcopulas and copulas,see[13-17](Joe,2014;Nelsen,2006;Wei et al.,2015;Wei and Kim,2017).
Definition1[14](Nelsen,2006) A bivariate subcopula (or 2-subcopula) is a functionCS:D1×D2|→[0,1], whereD1andD2are subsets of [0,1] containing 0 and 1, satisfying following properties:
(a)CSis grounded,i.e.,CS(u,0)=CS(0,ν)=0;
(b) For everyu,ν∈[0,1],CS(1,ν)=νandCS(u,1)=u;
(c)CSis 2-increasing in the sense that, for anyu1≤u2,ν1≤ν2withui,νi∈[0,1],i=1,2,
volCS(J)=CS(u2,ν2)-CS(u2,ν1)-CS(u1,ν2)+CS(u1,ν1)≥0,
A bivariate copula (or 2-copula)C(u,ν) is a subcopula withD1=D2=[0,1].
From the Definition 1 a subcopula(copula) is a (unconditional) cumulative distribution function (CDF) onD1×D2([0,1]).The condition (b) indicates a 2-copulaCis a bivariate CDF with uniform margins. LetXandYbe two random variables (discrete or continuous) with the joint CDFH(x,y) and marginal CDFF(x) andG(x).There exists a subcopula functionCSsuch thatH(x,y)=CS(F(x),G(y)) by the Sklars theorem[18](Sklar,1959).Furthermore, ifXandYare both continuous random variables, then there exist a unique copulaCsuch thatH(x,y)=C(F(x),G(y)).
2.2 Subcopula-based measure of asymmetric association for contingency tables

(1)
The marginal p.m.f.s and the joint p.m.f ofCsassociated with the table are,respectively,p0(ui)=pi·,p1(νj)=p·j,cs(ui,vi)=pij. Furthermore, the conditional p.m.f.s and the conditional p.m.f.are, respectively,

(2)
Then,one can quantitatively measure the asymmetric dependence between the two variablexXandYin anI×Jcontingency table.
Definition2(Wei and Kim,2017)[4]Given anI×Jcontingency table, a measure of subcopula-based asymmetric association of column variableYon row variableXand of row variableXon column variableYare defined as follows, respectively:
and
(3)

3 One example for continuous random variables
The asymmetric association measureρ2in Definition 2 measures the association for the discrete random variable associated with the two-way contingency table without parametric assumptions on the joint distributions.In this section,we develop one procedure to apply the subcopula-based asymmetric association measure on continuous random variables and illustrate the procedure along with the Example 1 as follows.
First,in order to apply asymmetric association measureρ2in Definition 2 on the continuous random variables, data must be quantized into categorical data.We can construct theI×Icontingency table by classifying thendata points intoIcategories for each variable. For example,if we setI=5 for data (n=300 andn=1 000) simulated from Example 1.1, we have the following two contingency tables, Table 3.1a and 3.1a.Note that for this example, we can classify each variable withIequal-width categories,i.e.,[a,a+(b-a)/I,[a+(b-a)/I,a+2(b-a)/I),…,[a+(I-1)(b-a)/I,b], whereb=max{x1,…,xn} forX(b=max{y1,…,yn} forY),a=min{x1,…,xn} forX(a=min{y1,…,yn} forY).
Tab.1 Two-way contingency tables constructed based on categorical data withI=5 quantized from the continuous data in Example 1.1

XYI1I2I3I4I5I10123237I27471200I3753600I4753600I500202210

(a)n=300
(b)n=1 000

4 Conclusion
In this paper,we have reviewed a subcopula-based measure of the asymmetric association for a two-way contingency table, which was proposed in (Wei and Kim, 2017)[4]. We applied the proposed measure to a data set with the non-linear relationship and showed it can be used as a tool to detect the non-linear association. The proposed procedure is illustrated via a simulation example.
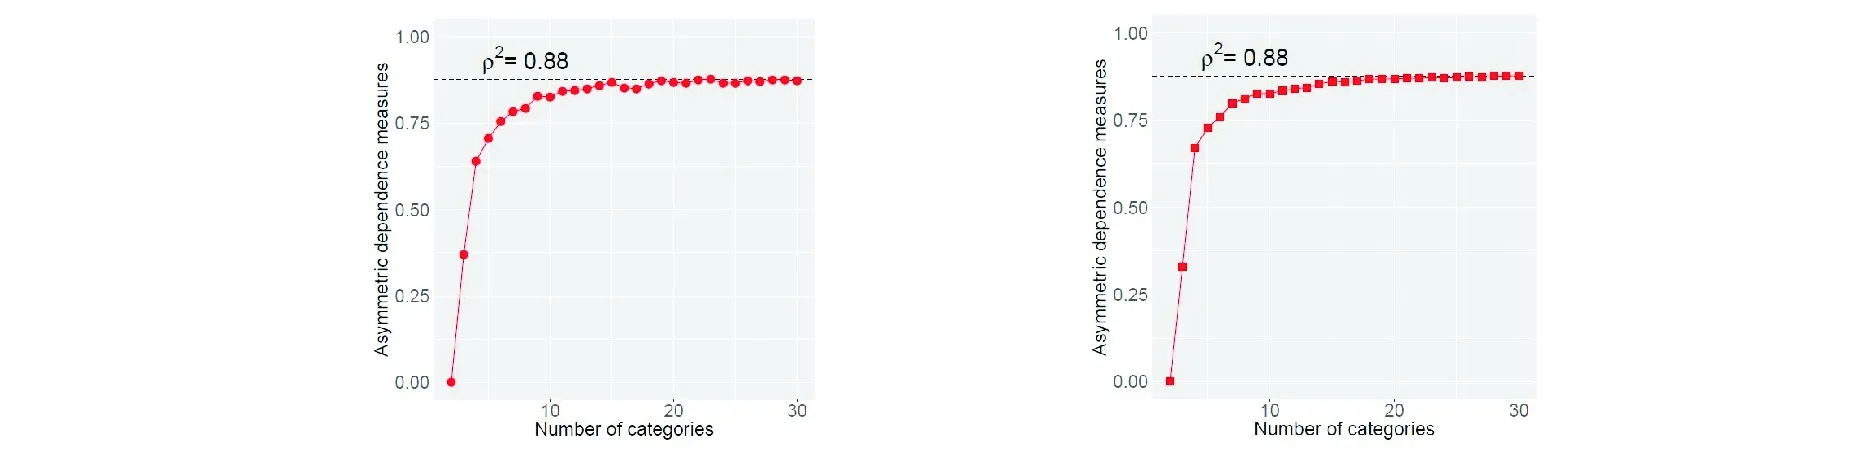
Fig.2 The subcopula based asymmetric association measure with respect to the number of the categories with respect to the sample size n=300 (left), and 1 000 (right)
[1] PEARSON K. Note on regression and inheritance in the case of two parents[J].Proceedings of the Royal Society of London, 1895, 58:240-242.
[2] SPEARMAN C.The proof and measurement of association between two things[J].The American Journal of Psychology, 1904,15(1):72-101.
[3] KENDALL M G.A new measure of rank correlation[J].Biometrika,1938,30(1/2):81-93.
[4] WEI Z, KIM D.Subcopula-based Measure of Asymmetric Association for Contingency Tables[J].Statistics in Medicine,2017,36(24):3875-3894.
[5] PATTON A J. Modelling asymmetric exchange rate dependence[J].International Economic Review, 2006,47(2):527-556.
[6] 張堯庭. 連接函數(copula) 技術與金融風險分析[J].統計研究, 2002, 4: 48-51.
[7] 吳振翔,葉五一,繆柏其.基于Copula的外匯投資組合風險分析[J].中國管理科學學報,2004( 4) :1-5.
[8] 龔金國,史代敏,時變Copula模型的非參數推斷[J].數量經濟技術經濟研究,2011(7):137-150.
[9] JAWORSKI P, DURANTE F, HARDLE W K, et al.Copula Theory and Its Applications[M].Berlin, Heidelberg: Springer, 2010.
[10] EMBRECHTS P, MCNEIL A, STRAUMANN D.Correlation and Dependence in Risk Management:Properties and Pitfalls[M].Risk Management:Value at Risk and Beyond,2002:176-223.
[11] ELURU N, PALETI R, PENDYALA, R, et al.Modeling injury severity or multiple occupants of vehicles:Copulabased multivariate approach[J].Transportation Research Record:Journal of the Transportation Research Board,2010(2165):1-11.
[12] ZHANG L, SINGH V P.Bivariate rainfall frequency distributions using archimedean copulas[J].Journal of Hydrology,2007,332(1):93-109.
[13] JONE H. Dependence Modeling with Copulas[M].London:Chapman & Hall, 2014.
[14] NELSEN R B.An Introduction to Copulas(second edition)[M].New York:Springer, 2006.
[15] WEI Z, WANG T, NGUYEN P A.Multivariate dependence concepts through copulas[J].International Journal of Approximate Reasoning, 2015,65:24-33.
[16] 龔金國,史代敏,時變Copula模型非參數估計的大樣本性質[J].浙江大學學報(理學版),2012 (6): 630-634.
[17] 龔金國,鄧入僑,時變C-Vine Copula模型的統計推斷——基于廣義自回歸得分理論[J].統計研究,2015(4):97-103.
[18] SKLAR M. Fonctions de répartitionndimensions et leurs marges[J].Publications de l′Institut de Statistique de L′Université de Paris,1959,8:229-231.
猜你喜歡
童話王國·奇妙邏輯推理(2024年5期)2024-06-19 16:03:38
體育科技文獻通報(2022年3期)2022-05-23 13:46:54
天津外國語大學學報(2021年3期)2021-08-13 08:32:18
遼金歷史與考古(2021年0期)2021-07-29 01:06:54
中學生數理化·七年級數學人教版(2020年10期)2020-11-26 08:24:50
數學物理學報(2020年2期)2020-06-02 11:29:24
科技傳播(2019年22期)2020-01-14 03:06:54
民用飛機設計與研究(2019年4期)2019-05-21 07:21:24
汽車工程學報(2017年2期)2017-07-05 08:13:02
光學精密工程(2016年6期)2016-11-07 09:07:19