Characterization and quantification of within-year variation of snow-cover elevation in mountainous regions, eastern Tibet
2011-12-09 09:36:40JieGaoXuDongFuTongLiangGongGuangQianWangHaoWang
Jie Gao , XuDong Fu , TongLiang Gong ,2, GuangQian Wang , Hao Wang
1. State Key Laboratory of Hydroscience and Engineering, Tsinghua University, Beijing 100084, China 2. Tibet Bureau of Water Resources, Lhasa 850000, China
3. Hydropower and Water Resources Planning & Design General Institute, Beijing 100120, China
Characterization and quantification of within-year variation of snow-cover elevation in mountainous regions, eastern Tibet
Jie Gao1,3*, XuDong Fu1, TongLiang Gong1,2, GuangQian Wang1, Hao Wang1
1.State Key Laboratory of Hydroscience and Engineering, Tsinghua University, Beijing 100084, China 2.Tibet Bureau of Water Resources, Lhasa 850000, China
3.Hydropower and Water Resources Planning & Design General Institute, Beijing 100120, China
Fluctuating snow-covered elevation (FSCE) was conceptualized and proposed to characterize within-year variation of the border between snow-covered and snow-free area in mountainous regions. Two parameters, namely median of snow free period (Tm) and snow free duration (ΔT), were defined to quantify FSCE. A regression model of FSCE was developed for the Lhasa River Basin,Niyang River Basin, and Changdu region in eastern Tibet. Statistical analysis of the snow-products data with a spatial resolution of 25km×25km shows that: (1)Tmcorrelates weakly with geographical and topographic factors, having the yearly mean value of July 31; (2) ΔTcorrelates significantly with the average elevation of the snow-products cell, having the yearly mean value of nearly five months (i.e., 151 days); (3) the region begins snow disappearance in late April and finishes snow coverage in mid November, being snow-free from late June to mid September and snow-covered from December to March in the next year. In addition, snow-products with higher spatial resolution will be helpful to characterize FSCE in smaller spatial scales.
fluctuating snow-covered elevation (FSCE); eastern Tibet; median of snow-free period; duration of snow-free period
1. Introduction
Dynamics of snow cover potentially influences snowmelt runoff generation. Quantification of spatiotemporal distribution of seasonal snow would contribute to improve the understanding of snow accumulation and ablation processes, and provide boundary conditions for snowmelt modeling.
In order to characterize spatial distribution of snow, three primary mechanisms at different spatial scales are presented(Liston, 2004). At scales of one to hundreds of meters,snow-canopy interaction affects the distribution of snow.Canopies reduce snow accumulated on the ground and energy budget available for melting. Compared with forest-free regions, a smaller annual variability of snow is observed in forested areas (Fariaet al., 2002; Marchand and Killingtveit, 2005; Winkleret al., 2005). At scales of tens to hundreds of meters, snow is redistributed by wind. Because of the stochastic process of wind, it is difficult to explain wind redistribution mechanism (Andertonet al., 2002).Andertonet al. (2004) examined the spatial variability of snow water equivalent (SWE) for the Izas catchment,Spanish Pyrenees, with an area of 0.32 km2. Effect of wind is found as a snow redistributor by multiple regressions in 1997 and 1998. At scales of one to a few kilometers, orographic factors control snow accumulation and ablation(Mckay and Gray, 1981). Experiments conducted in a snow-dominated watershed, Cotton Creek of Kootenay Mountains, Canada, during 2005 and 2006 suggested that the combination of elevation, aspect and forest cover could explain about 80%-90% of the variability in snow accumulation. Elevation had the greatest influence on SWE(Jostet al., 2007). Elevation-related variables, in a grid with a spatial resolution of 1 km, are significantly correlated to snow depth when considering slope, aspect, curvature and elevation. However, Bloschl and Kirnbauer (1991) found spatial distribution of snow cover can be explained but only partly by topographical features. Research conducted in the Loetschental valley, Swiss Alps found that the temporary snow-line does not run parallel to contour lines and especially modified by gravitational processes where slope angle is greater than 37°. Besides, vegetation cover, glacier and permafrost are also the reasons for snow cover patterns(Schmidtet al., 2009).
Snow line is frequently used to characterize the distribution of snow cover, which sometimes indicates the boundary between perpetual and seasonal snow. Jiang (1982, 1984)quantified the variation of snow line with latitude. Jianget al.(2002) obtained the spatial distribution of snow line in China based on data of 106 snow stations. Zhanget al. (2005)modeled the response of snow line to climate change in Qilian Mountain by NOAA-AVHRR and EOS-MODIS remote sensing data and meteorological data.
Recent research found that elevation-related topographic factors mainly influence the spatial distribution of snow at a large scale, and ones focused on the annual elevation of snow line between perpetual and seasonal snow. However,for hydrological modeling in snowmelt-dominated regions,the boundary between seasonal snow-covered and snow-free area is more useful. It varies within a year, which implies a change of runoff generation contributing area. In this paper,at the scale of 25 km, factors at micro- or meso-scales, such as vegetation, wind redistribution becomes insignificant.And elevation, the factor dominated at a macro-scale, comes to control snow distribution in such a scale. Therefore, combined remote sensing data and DEM data, elevation is abstracted to characterize the variation of snow covered area within a year for mountainous regions in eastern Tibet.
2. Conceptualization for Fluctuating Snow Covered Elevation (FSCE)
If observed at a macro-scale in mountainous regions,patchy or mosaic snow is not identified. There exists a boundary between snow-covered and snow-free area. The lower edge of snow-covered area fluctuates following seasonal pattern. It "climbs up" the mountain from winter to spring, arrives maximum in mid-summer, and then declines from summer to winter. The concept of Fluctuating Snow Covered Elevation (FSCE) is proposed to describe as that process (shown in Figure 1).

Figure 1 Variation of snow-covered area in a year cycle
2.1. What does FSCE tell us?
At a certain elevation, there exists two timing points:t1andt2, which are the onset/end dates of snow-free period at that elevation respectively (Figure 1). The period beforet1and aftert2are covered by snow (perpetual, seasonal or transient snow), but the time betweent1andt2is snow-free. However,at the peak of FSCE,t1andt2overlap which means snow-free period is zero. Therefore, the area above maximum FSCE has perpetual snow cover. At the minimum of FSCE, numeroust1andt2produce a horizontal line, which implies snow-free period lasts for a year, where transient snow dominated. In the area between the maximum and minimum of FSCE, seasonal snow dominated, fromT1toT2(Figure 2).
2.2. How to quantify FSCE?
If snow accumulation and ablation are considered inverse processes. The period betweenT1andT2in FSCE simplifies to be symmetrical.
Median of snow-free period (Tm) and duration of snow-free period (ΔT) are calculated to characterize
snow-free period.
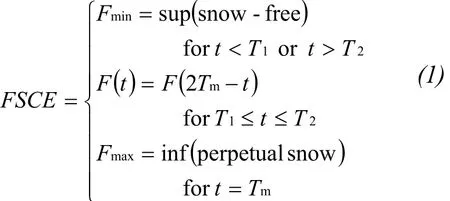
In Function(1):
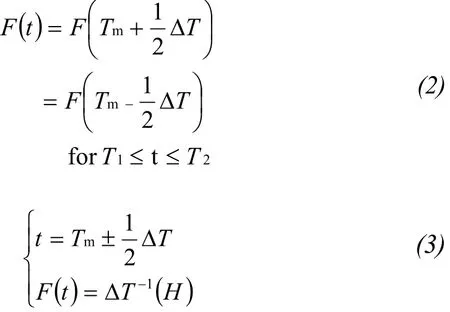

Figure 2 Schematic view of Tm and ΔT in FSCE
3. Study area and data source
3.1. An overview of study area
The study area, located in Tibet of China from 90°3'E to 99°4'E, 28°24'N to 32°34'N, covers an area of 1.53×10⁵km2, is divided by the Yarlung zangbo Grand Canyon into three areas, including Lhasa River Basin,and Niyang River Basin on the left of the canyon and Changdu region on the right side (shown in Figure 3).Yarlung zangbo Grand Canyon is out of the study area due to frequent gravitational processes caused by steep slopes (Schmidtet al., 2009). The influences of slope,aspect on spatial distribution of snow become significant and considering elevation only is not sufficient in such regions.
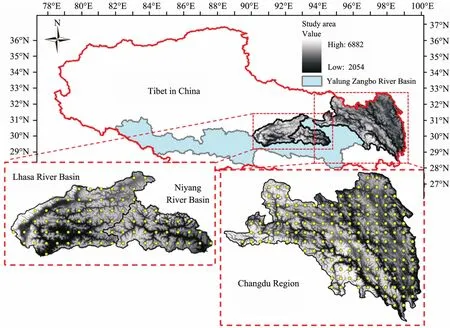
Figure 3 An overview of study area
The Lhasa River Basin drains an area of 3.23×10⁴km2,with an elevation ranging from 3,535 m to 7,093 m. The basin is covered by shrub, alpine meadow, coniferous forest and rock, with annual precipitation of approximately 443 mm. Niyang River Basin, adjacent to Lhasa River Basin,covers an area of 1.81×10⁴km2. Elevation ranges from 2,905 m to 6,588 m, with annual precipitation of 635 mm(Zhenget al., 1979). Glaciers develop, vegetation grows better, and the habitat is coniferous forest and shrubland. The Changdu region, part of the Hengduan Mountains, covers an area of 10.30×10⁴km2, with an elevation ranging from 2,073 m to 6,644 m. Annual precipitation ranges from 500 mm to 1,000 mm. It features a rugged terrain of shrub, rock and coniferous forest. Glaciers develop, and thick seasonal snow accumulates in the northwestern region of Changdu.
3.2. An introduction to data source
The Digital Elevation Data (DEM) is based on Shuttle Radar Topography Mission (SRTM) with a spatial resolution about 90 m released by USGS (https://wist.echo.nasa.gov/).
The snow product is "Long-term snow depth dataset of China (1978-2005)" (Cheet al., 2003; Che and Li, 2005)provided by the "Environmental & Ecological Science Data Center for West China, National Natural Science Foundation of China" (http://westdc.westgis.ac.cn).
Microwave remote sensing data from 1978 to 1987 was from SMMR instrument on NIMBUS-7 platform, before SSM/I was launched (Clifford, 2010). The algorithms for snow depth (SD) proposed by Chang (Clifford, 2010) and applied by Che are as follows:

in which,Tb,nis brightness temperature and frequency.
Validations with ground stations indicate that, the standard deviation of snow depth retrieval from SMMR was 6.2 cm,while for SSM/I retrieval that was 6.0 cm. This product covers China with a spatial resolution of 25 km and temporal resolution of 1 day from late 1978 to 2005.
4. Parameters for FSCE
There are 80 grids of 25km×25km for Lhasa and Niyang River basins, and 166 grids cover the Changdu region, totaling 246 grids.
4.1. Parameter extraction
(1) There exists a pair oft1andt2each year. Thus, a pair ofTmand ΔTcould be deduced every year. The interannual averageTmand ΔTduring 1979 and 2005 for each grid are calculated as follows:
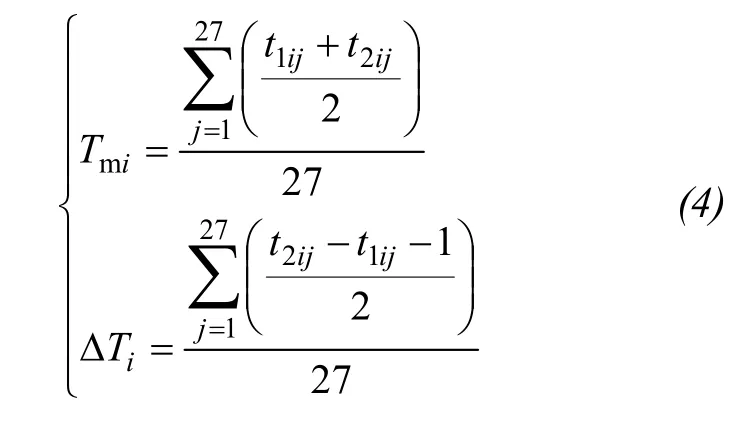
where, subscriptiindicates grid (i= 1, 2, … , 246) andjdenotes year (j= 1, 2, … , 27).
(2) Matching between snow product and DEM data.Every snow grid with a resolution of 25km×25km involves numerous DEM pixels of 90m×90m. The average and variance (σ) of elevation and aspect in each grid are calculated to represent the topography in such snow grid. Finally, 246 groups ofTmi, ΔTi,Hi,σi,Aspiare obtained, which present both snow parameters and topographic properties. The average elevation is aggregated into a range of 3,854 to 5,488 m a.s.l. in a coarse resolution of 25km×25km.
4.2. Statistics of Tm and ΔT
The temporal distributions ofTmand ΔTreveal that,Tmhas a narrow distribution while ΔTvaries with topographic factors (shown in Figures 4 and 5).
Using "Day of Year" (DOY) to evaluateTm, January 1 is 1 and December 31 is 365 (common year) or 366 (leap year).Average ofTmis 212.3 which corresponds to July 31, with a standard deviation of 4.0 (Table 1). About 65.45% ofTm(located in the range of 212.3±4.0) occurs between July 28 and August 4. Nearly 97.56% ofTmoccurs from July 24 to August 8 (212.3±8.0). Based on regressive analysis,Tmin an area of 1.53×10⁵km2is not significantly related to latitude,longitude, elevation, curvature and aspect (He and Liu,2007).
ΔTvaries from 90 to 224 days in a year with the average equals 151.6 days and standard deviation 31.6 days.About 63.82% of the study area has ΔTwithin 4 to 6 months (151.6±31.6 days), and ΔTin 97.15% of the study area lasts for 3 to 8 months (151.6±63.2 days). Correlation analysis between ΔTand several geographic or topographic factors indicates that (Table 2), ΔTis negatively related to elevation and positively related to longitude.Temperature lapse rate and rising air over topographic barrier (Liston, 2004) posed by higher elevation reinforce snowfall and snow accumulation. However, local geomorphologic feature of "higher in the west while lower in the east" results in snow pattern affected by longitude indirectly. Among them, elevation is the dominating factor to reflect snow distribution.
5. Results
5.1. Regressive analysis
Based on correlation analysis in section 3.2, ΔTdecreases as elevation increases. Regressive equation is established between ΔTand elevation for the 246 grids.
in which,b0=395.355, andb1=-0.053. Coefficient of correlationr=0.607, adjusted coefficient of determinationr2=0.366. This confirms that, the variability of snow distribution in the whole region can be explained partly by ele-vation, approximately 36.6%.
Calculate the standardized residualZRE. Sort out all the data with errors between original and fitted data greater than ±2σ. These data are considered to be abnormal points for the regressive relation. There are 50 grids with absolute value ofZRE>2, accounting for 20.3% of the total samples. Figure 6 shows spatial distribution of those abnormal points.
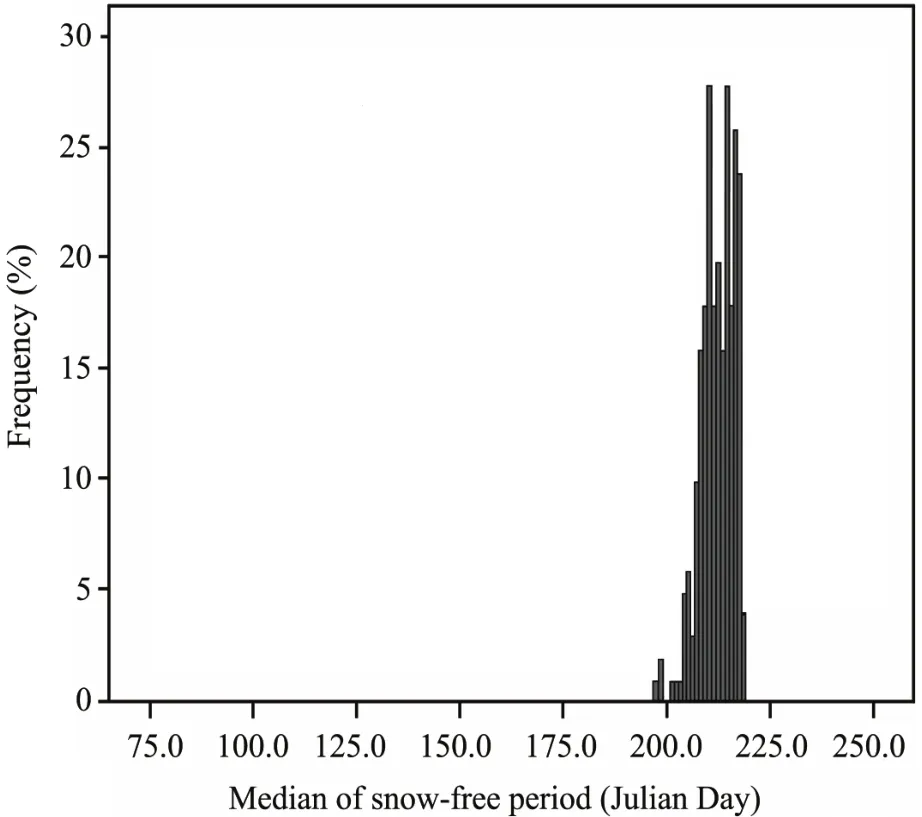
Figure 4 Temporal distribution of Tm
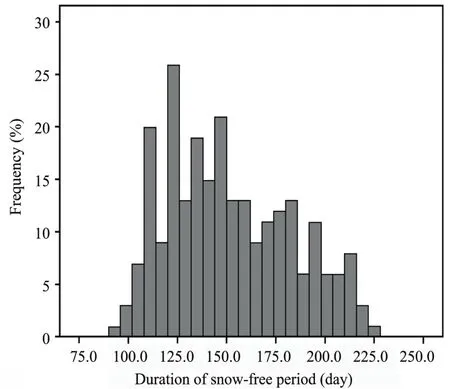
Figure 5 Temporal distribution of ΔT

Figure 6 Spatial distribution of abnormal points. Red dot denotes abnormal grid, blue triangle indicates the grid having glaciers with ice volume more than 0.01 km3 and coverage larger than 0.35 km2 according to Glacier inventory of China (Mi et al., 2002).

Table 1 Statistics of Tm and ΔT

Table 2 Correlation analysis between ΔT and geographic/topographic factors
The regions within the dashed lines denote the regressive ΔTlonger than observation, while regions within the solid lines indicate regressive ΔTis shorter than observation.
In dash-line zones, abnormal points are adjacent to glaciers and located in lower elevation sites. Snow remains for a longer time due to the cold effect of glaciers although situated in lower elevations. Therefore, ΔTcalculated by regressive equation based on elevation laws seems longer than actual ΔT.
In solid-line zones, actual ΔTis longer than calculated ones from the FSCE equation. Those abnormal points are distributed in three parts. In Figure 6, region "I" located in the dry-hot valley of Lhasa River is snow seldom accumulates. Blowing snow plays an important role in region "II"which is on the dividing crest in northern Lhasa River Basin.Region "III" is on the leeward side of Hengduan Mountain,dominated by dry, hot and cloudless climate and higher radiation (Shen, 1987).
After eliminating 50 abnormal data,b0=471.8 andb1=-0.070 in the final regressive equation wherer=0.836,r2=0.699. About 70% of the variability of snow distribution could be explained by elevation in the left 196 grids. The confidence limits of 95% shown in Figure 7 demonstrate that the error between upper and lower limits is less than 12 days.
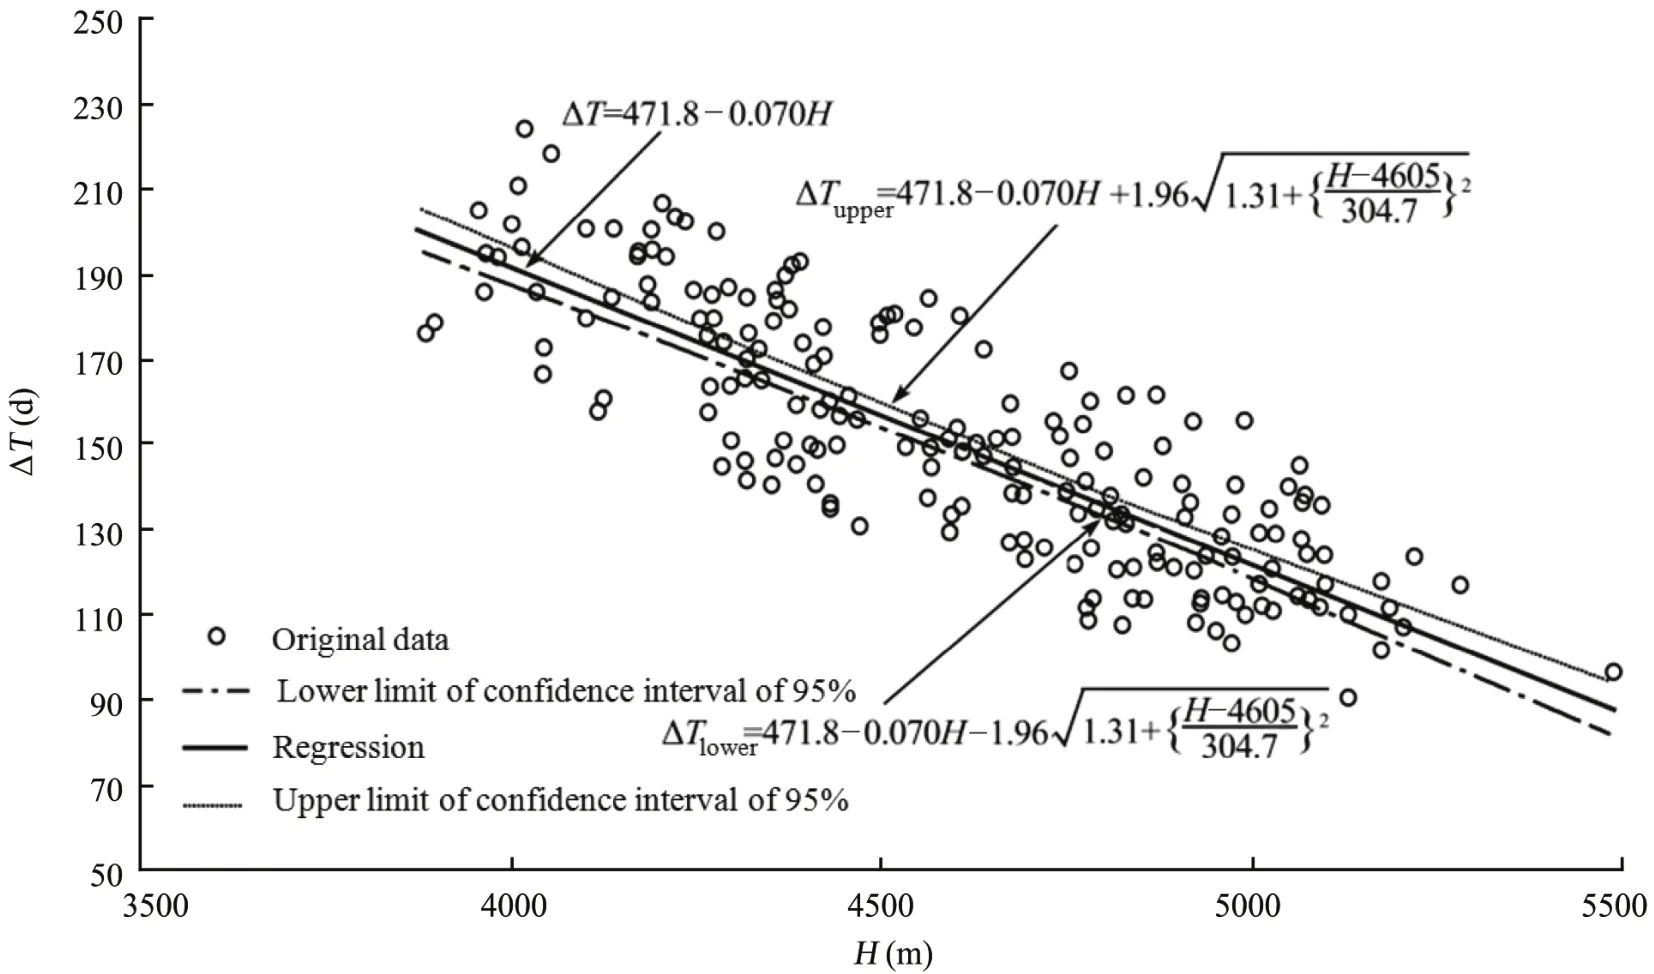
Figure 7 Regression line of ΔT against H after removal and confidence interval of 95%
5.2. Establishment of FSCE
After removing abnormal data from the original samples,average elevation of the left grids range from 3,883 to 5,488 m, the statistics of newlyTmand ΔTare as follows, there is no significant difference between Table 1 and Table 3.
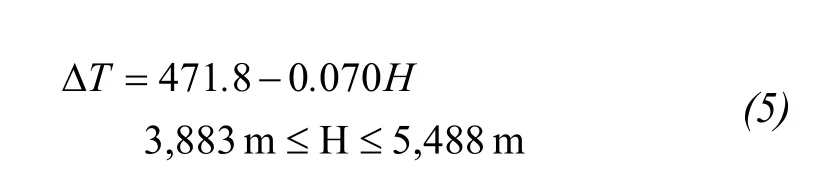
Based on the regression Equation(5)in ΔT(H), calculate the inverse function of ΔT-1(H) and submit it into Equation(6). This relation is derived from the sample within the average elevation ranging from 3,883 to 5,488 m. However,the variation of FSCE betweenTm-44<t<Tm+44,t<Tm-100 andt>Tm-100 are still unknown.
Using the average value of 212.6 to replaceTmin Equation(7), we arrive at the following.

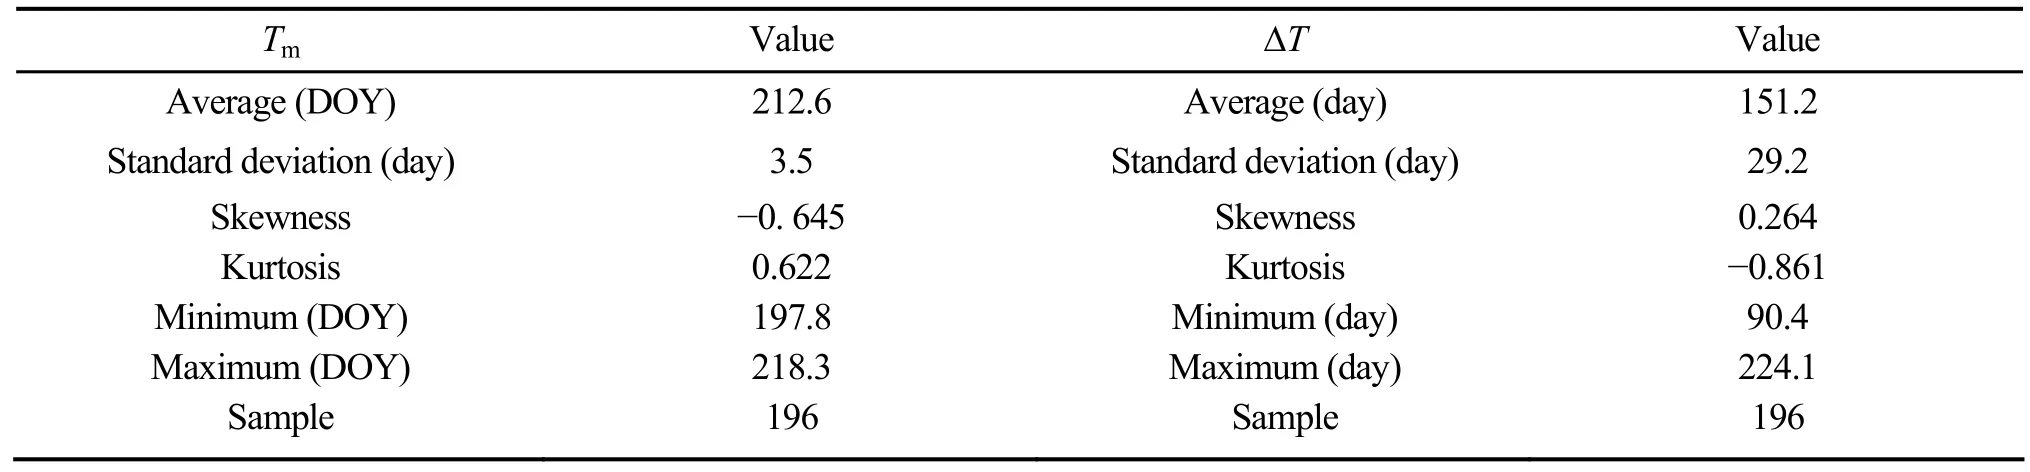
Table 3 Statistical characteristics of Tm and ΔT after removal
Snow covered elevation (FSCE) changes 100 m ifTmvaries within ±σ(±3.5 days).
FSCE reveals the different onset and end dates of snow-free period for different elevations in mountainous regions. In this region, based on the microwave data with a spatial resolution of 25 km, FSCE indicates that snow start to melt in late April at the lower elevation sites, and there is a snow-free period from late June to mid September. Snow starts to accumulate in mid November and there is a solid cover of snow from December to March of the next year in the study area. During late June to mid September, snow covered elevation (FSCE) is above the whole region, with rainfall and floods dominating the study area which is snow-free.
Limited by the coarse resolution (25km×25km) of snow product, smaller regions (scales from m2to km2) with perpetual snow and transient snow cannot be identified. In the future, snow product of higher resolution will help obtain a more accurate equation of FSCE.
6. Conclusions
(1) Focusing on the seasonal variation of snow cycle, a concept of Fluctuating Snow Covered Elevation (FSCE) is proposed to provide an intuitive description of spatiotemporal distribution of snow within a year. Two parameters ofTmand ΔTare used to characterize FSCE. The modeling of FSCE is conducted in an area of 1.53×10⁵km2, consisting of Lhasa River Basin, Niyang River Basin and Changdu region,located in southeastern Tibet.
(2) Based on analysis of FSCE derived from microwave remote sensing data of 25km×25km, mid time of snow-free periodTmcorrelates insignificantly with geographical or topographic factors, having the yearly mean value of July 31.Duration of snow-free period ΔTshows a significant positive correlation with elevation, having the yearly mean value of nearly five months (151days).
(3) Generally speaking, 80% of the total regions undergo snow-free seasons from late June to mid September, snowmelt occurs in late April and there is a solid cover of snow from December to March of the next year based on FSCE analysis.
(4) All the work was carried out based on the dataset with a spatial resolution of 25 km. In the future, data source with a higher resolution such as EOS/MODIS will help to establish an improved equation of FSCE.
This work was supported by the National Natural Science Foundation of China under Grant No. 50221903 and by the Ministry of Science and Technology of China under Grant No.2007BAC06B06. The "Long-term snow depth dataset of China (1978-2005)" is provided by "Environment & Eco-logical Science Data Center for West China, National Natural Science Foundation of China" (http://westdc.westgis.ac.cn).We would like to specially thank Dr. Che T from Cold and Arid Regions Environmental and Engineering Research Institute, Chinese Academy of Sciences, for his great help.
Anderton SP, White SM, Alvera B, 2002. Micro-scale spatial variability and the timing of snow melt runoff in a high mountain catchment. Journal of Hydrology, 268: 158-176.
Anderton SP, White SM, Alvera B, 2004. Evaluation of spatial variability in snow water equivalent for a high mountain catchment. Hydrological Processes, 18: 435-453.
Bloschl G, Kirnbauer R, 1991. Point snowmelt models with different degrees of complexity—internal process. Journal of Hydrology, 129: 127-147.
Che T, Li X, 2005. Spatial distribution and temporal variation of snow water resources in China during 1993-2002. Journal of Glaciology and Geocryology, 27(1): 64-67.
Che T, Li X, Armstrong RL, 2003. Estimation of snow water equivalent from passive microwave remote sensing data (SSM/I) in Tibetan Plateau.In: Kummerow CD, Jiang FS, Uratura S (eds.). Microwave Remote Sensing of the Atmosphere and Environment III, 4894: 405-412.
Clifford D, 2010. Global estimates of snow water equivalent from passive microwave instruments: history, challenges and future developments. International Journal of Remote Sensing, 31(14): 3707-3726.
Faria DA, Pomeroy JW, Essery RLH, 2002. Effect of covariance between ablation and snow water equivalent on depletion of snow-covered area in a forest. Hydrological Processes, 14(15): 2683-2695.
He XQ, Liu WQ, 2007. Applied Regression Analysis. China Renmin University Press, Beijing.
Jiang FC, Wu XH, Wang SB, Fu JL, 2002. Characteristics of space distribution of the climate snowline in China. Journal of Geomechanics, 8(4):289-296.
Jiang ZX, 1982. Discussion on the mathematical model for natural geographical zone in China. Acta Geographica Sinica, 37(1): 98-103.
Jiang ZX, 1984. Quantitative analysis of snowline zonality. Journal of Glaciology and Geocryology, 6(2): 27-35.
Jost G, Weiler M, Gluns DR, Alila Y, 2007. The influence of forest and topography on snow accumulation and melt at the watershed-scale. Journal of Hydrology, 347: 101-115.
Liston GE, 2004. Representing subgrid snow cover heterogeneities in regional and global models. Journal of Climate, 17(6): 1381-1397.
Marchand MD, Killingtveit A, 2005. Statistical probability distribution of snow depth at the model sub-grid cell spatial scale. Hydrological Processes, 19: 355-369.
Mckay GA, Gray DM, 1981. The distribution of snowcover. In: Gray DM,Male DH (eds.). Handbook of Snow Principles, Processes, Management& Use. Blackburn Press, Caldwell. 153-190.
Mi DS, Xie ZC, Luo XR, 2002. Glacier Inventory of China. Xi’an Cartographic Publishing House, Xi’an.
Schmidt S, Weber B, Winiger M, 2009. Analyses of seasonal snow disappearance in an alpine valley from micro- to meso-scale (Loetschental,Switzerland). Hydrological Processes, 23: 1041-1051.
Shen ZB, 1987. The geographic distribution of the global radiation and the characteristics of its seasonal variation over the Qinghai-Xizang Plateau.Plateau Meteorology, 6(4): 326-334.
Winkler RD, Spittlehouse DL, Golding DL, 2005. Measured differences in snow accumulation and melt among clearcut, juvenile, and mature forest in southern British Columbia. Hydrological Processes, 19(1): 51-62.
Zhang J, Han T, Wang J, 2005. Changes of snow-cover area and snowline altitude in the Qilian Mountains, 1997-2004. Journal of Glaciology and Geocryology, 27(5): 649-654.
Zheng D, Zhang RZ, Yang QY, 1979. On the natural zonation in the Qinghai Xizang Plateau. Acta Geographic Sinica, 34(1): 1-11.
10.3724/SP.J.1226.2011.00400
*Correspondence to: Dr. Jie Gao, State Key Laboratory of Hydroscience and Engineering, Tsinghua University, Beijing 100084,China. Email: s.kao2009@gmail.com
13 April 2011 Accepted: 14 July 2011
 Sciences in Cold and Arid Regions2011年5期
- Sciences in Cold and Arid Regions的其它文章
- Satellite dataset analysis of recent vegetation variation in Tibet region
- Research progress in cold region wetlands, China
- Relationship analysis between September precipitation in western China and 700 hPa wind field in East Asia
- Influence of air masses on particle number concentration and size distribution at Mt. Waliguan, Qinghai Province, China
- Cenozoic Ephedraceae adaptation to global cooling in northwestern China
- Environmental records of snow pits in Yuzhufeng Glacier and Xiao Dongkemadi Glacier in the Tibetan Plateau