Development of Vibration Signal Acquisition and Analysis System for Machine Tools Based on LabVIEW
2013-06-02 06:17:30CHEXiaZHONGPeisiLUHongrong
機床與液壓 2013年18期
CHE Xia ,ZHONG Peisi,LU Hongrong
Advanced Manufacturing Technology Center,Shandong University of Science and Technology,Qingdao 266590,China
1.Introduction
As the indispensable equipment in the most enterprise productions,if any component of the machine tool breaks out,it will affect the machining precision of the products.It also can bring huge economic losses for the enterprise;it may even cause serious accidents.According to the statistics,about 60% ~70%of mechanical failures are reflected by the vibration signal[1].Through the analysis and process of vibration signal,it will be able to infer that whether the fault exists and what stage it is in.Therefore,the collection and analysis of machine tool vibration signal has important significances.
2.Overall design of the system
2.1.The overview of the LabVIEW
LabVIEW(Laboratory Virtual Instrument Engineering Workbench),is developed by National Instruments(NI).LabVIEW is the only international graphical programming language at present,it is mainly used for data acquisition,instrument control,data analysis and other fields,the main features are shown as follows[2-4]:
1)LabVIEW adopts graphical language(G programming language)to program,it’s convenient to program and having an advantage of friendly humancomputer interface.It also has powerful data visualization analysis and instrument control ability.
2)LabVIEW provides many library functions of data acquisition, analysis and storage, including many functions of instrument communication bus standards,such as DAQ,GPIB,PXI,VXI,RS232/485.Just because of this,it contributes the developers more conveniently to drive interface equipments and instruments of different bus standards.
3)LabVIEW also provides a special program development toolkit,so the user can set breakpoints conveniently,execute programs dynamically,and observe data transmission process visually.
NI provides a kind of convenient and efficient driver software:NI DAQmx for the data acquisition in the LabVIEW.It can connect the hardware and soft-ware connection as a drive,and also can easily provide data acquisition module for the user.DAQ Assistant is provided by DAQmx,because it has an interactive configuration interface,so through modifying DAQ related configuration,application program can be quickly and repeatedly modified to adapt to the new test and measurement requirements.
2.2.Overall plan of the system
This system uses the LabVIEW2011 as the development platform,including two parts:hardware and software.Hardware is the foundation of the virtual instrument;it mainly consists of sensor,signal conditioning device,data acquisition device and computer;and it also can complete the pre-processing and acquisition of the measured signal.The software is responsible for the display and analysis of the collected signal to make the corresponding signal characteristics clearly presented in front of the user.The overall structure of the system(as shown in Fig.1)is to transform the machine vibration signals into electric signal through some sensors,then transmit them to the signal conditioning device to modulate.Finally,the conditioned signals are transmited to the virtual instrument platform LabVIEW through data acquisition card,for further analyze and process.
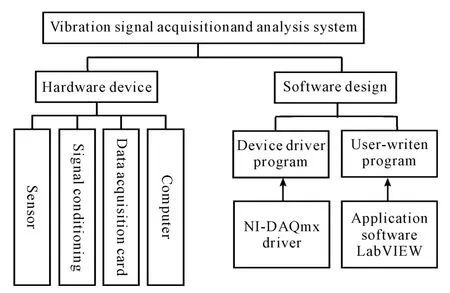
Fig.1 Overall structure of the system
3.The hardware design of the system
The measured physical quantity is vibration signal in this system.For the measured parameters of engineering vibratory output[5],the measured vibration parameters include displacement,velocity and acceleration.Because of the different frequency sensitivity among the various parameters,different parameters should be selected according to the frequency range of the vibration signal.The machine tool vibration signals are usually caused by gear mesh,ball damage,blade resonance,radial resonance of the bearing element,whose signals frequency range are greater than 1 000 Hz.According to the requirements of vibration testing,when frequency is greater than 1 000 Hz,it is advised to select the acceleration as the magnitude,so in this system the acceleration is selected as the vibration measurement parameter.The selection of the sensor,signal conditioning,cable connection and data acquisition device have a direct impact on the correctness of the signal acquisition.According to the requirements of the test system,the specific choices are listed as follows:
1)Sensor.Because the signals are not those of being directly measured from the machine,therefore the physical signal should be converted to the electrical signal by the sensor.For the selection of the sensor,the acceleration sensor is adopted usually when measuring the vibration acceleration.According to the characteristics of the machine vibration signals,YD-12 piezoelectric acceleration sensor is used,whose characteristics include high piezoelectric coefficient,light quality,low density,wide frequency response,low acoustic impedance,high sensitivity,good stability.In addition,it is also easy to install and difficult to damage.
2)Signal modulating device.Signal conditioning module is essential in most test systems,in addition to serve as a connecting bridge between the sensor and data acquisition device,it can also realize signal amplification,isolation,filtering and other processing,which greatly improve the test system reliability.Signal modulate circuit uses charge amplifier in this system,because the charge amplifier is a high-gain operational amplifier with a charge negative feedback,whose output voltage is proportional to the charge that generated by the sensor.Because the output voltage has nothing to do with the piezoelectric sensor inherent capacitance and cable capacitance,therefore dozens of meters input cable is used in this test system.According to the test requirements,YSD-2A signal modulate device is used,the output of current signal is 4~20 mA,the direct voltage is 24 V.
3)Data acquisition device.In data acquisition part,it adopts NI Company data acquisition card(DAQ PCI-6221M),its main function is to collect the conditioned electrical signal.The function of the data acquisition card is to convert the analog signal to the digital signal which can be recognized by the computer.The parameters of this data acquisition card are as follows:①16 analog signal input channel,② sampling rate:250 k/s,③ Input range:-10V~+10V,④2-channel 16-bit.According to the hardware configuration,signal conditioning device output current range is different from the data acquisition card required input range,so in order to exactly get and analyze the vibration form the machine tools,a 500 Ω resistance should be connected between the signal conditioning device and data acquisition card,which can convert it to the range which can be identified by data acquisition card.
4.The software design of the system
The written program based on LabVIEW includes two parts:the front panel and block diagram.The front panel is the graphical user interface,which can control parameter setup.The front panel’s controls correspond to the block diagram one-to-one.The whole software system consists of three functional modules(as shown in Fig.2):signal acquisition,signal analysis and data storage.In the whole realizing process of the design for this software system,we adopt the modular though[6]—each function is performed by independent module to realize signal acquisition,analysis and storage.
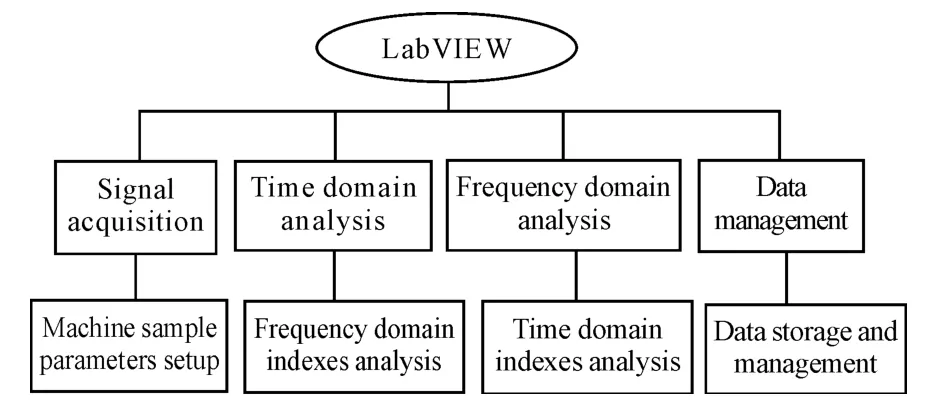
Fig.2 Software structure model
4.1.Signal acquisition module
Signal acquisition module’s main function is to collect the vibration signal from the machine key parts as the base portion of the entire system,meanwhile it provides signal source for the whole test system.Therefore,the accuracy of the signal acquisition has an immediate impact on the correctness of the functions such as analysis,processing and display.
In this system,signal acquisition module includes four parts:the measured signal,signal modulating device,data acquisition card and some software driver program.Signal acquisition module is to realize the machine vibration signal acquisition and various parameters setup.This system adopts the continuous sampling mode,that is to say that after setup the acquisition parameters it can start continuous acquisition[7].The front panel of the acquisition system is shown in Fig.3,the left function area includes some sampling parameters setup:sampling interval,the number of samples,sampling frequency,the number of measured points and the device number.The right function area is responsible for the signal display.Meanwhile,the signal acquisition module adopted the NI Company’s DAQ Assistant to finish the signal acquisition function.The DAQ program of the LabVIEW includes analog input,output,counter operation,digital input and output.etc.In configuration of the DAQ Assistant,analog input function is adopted and voltage in the type of analog signal is chosen.

Fig.3 Front panel of the acquisition system
4.2.Signal analysis module
Signal analysis module is mainly to intuitively reflect the collected vibration signals,and to analyze and extract the characteristic signals for analysis and test.The purpose is to further understand the machine working condition and the vibration mechanism of the equipment,in order to improve the working condition of the equipment and optimize the monitoring system[8].The signal analysis module mainly includes two parts:time and frequency domain analysis:
1)Time-domain analysis module mainly analyzes the time domain indices:amplitude,peak,rootmean-square,phase and other indices.The time-domain analysis module can display the time domain graph of the collected signal,and can clearly show the relationship between the amplitude and time on the operation time,so we can quickly determine the time when the fault appeared.When finished the time-domain analysis,and then converted them to the frequency-domain analysis,in order to have the frequency-domain analysis of the collected signals.
2)In the frequency domain analysis module,it can realize the steady state frequency spectrum analysis and time-frequency analysis of single channel and multi-channel.In the spectrum analysis,it can perform digital filtering by selecting anyone from the followed windows:rectangle window,triangle window,Hanning window,Hamming window and other Windows.The spectrum analysis module includes power spectrum analysis,cepstrum,logarithm spectrum and fine spectrum analysis.Combining the time and frequency domain analysis,we can clearly see the relationship among energy,frequency domain and time domain from the graph.Finally,we can effectively analyze the signal of the fault feature parameters,which provides a reliable basis for the fault analysis.
Some block diagram of the signal analysis system are shown in Fig.4:after processed by the filter,the collected signal have time and frequency domain analysis,finally display the time and frequency feature values with the way of cluster,in order to make the function interface beautiful and tidy.If need to observe the data transmission process,we can set breakpoints on the front panel toolbar,dynamically execute the program.This is the difference among LabVIEW and other software:setting breakpoints conveniently to query errors.

Fig.4 Some block diagram of the signal analysis system
4.3.Data storage module
According to the need,data storage module can transform the sampling data in the time domain and frequency domain into the LabVIEW owned formats:waveform file,excel format file,text file and data log file,and then store them in a file under the appointed directory.So the data collected in the survey can be observed repeatedly or processed further in the future.In the above storage formats,the data log file which stores data in cluster can store different types of data,finally store the current system time,sampling frequency,waveform data and other features into a data file.When writing data into data log files,we do not need to store files into the format that can be accessed with other software,so that increasing the speed of the storage,this system adopts data log file format as the storage format.The block diagram of the data storage module is shown in Fig.5.

Fig.5 Block diagram of the data storage module
5.Application example
The signal is collected for analysis and comparison;and the signal from the two key parts:headstock and worktable that affect the machining quality,which verifies the feasibility and correctness of this system.Taking the signal acquisition and analysis from the machine headstock for example,installing the corresponding piezoelectric acceleration sensor on the machine headstock through the magnetic holder to get the vibration signals from the headstock.Then,using this system to analyze the vibration signals of the machine headstock,the power spectrum is shown in Fig.6.So the inherent frequency value can be clearly read from this graph,the result is similar with the conventional method.This system also can analyze some simulation signal.The test results are consistent with the actual parameters setup.
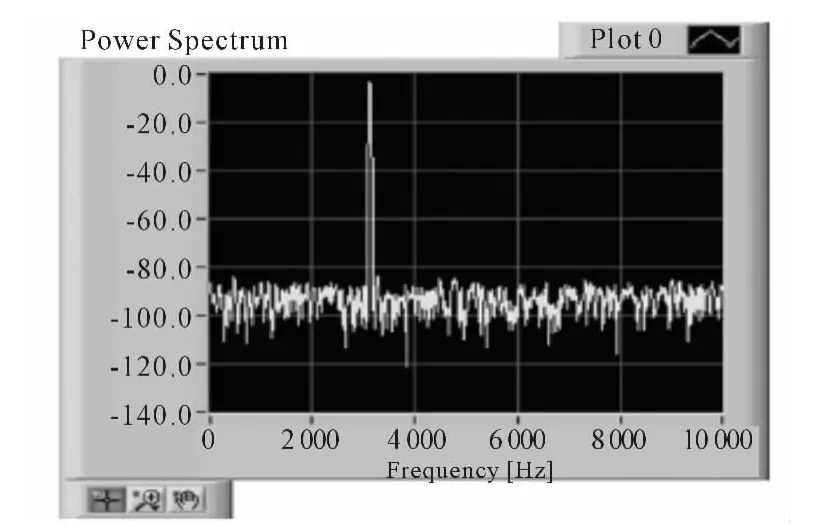
Fig.6 Power spectrum analysis
6.Conclusions
According to the characteristics of the machine vibration signal,designing the acquisition and analysis system based on LabVIEW,which can quickly realize the signal acquisition,analysis,and data storage.And apply it to the key parts of the machine vibration signal testing and analysis.Experiments show that this system can satisfy the requirements of the machine tool vibration signal test,so it can be used as a machine condition monitoring tool.The testing system based on LabVIEW can quickly adapt to different tests by initializing parameters setup,and greatly improve the efficiency of development,so that can be widely used in the corresponding test fields.
[1]ZHANG Long,ZENG Guoying,ZHAO Dengfeng.et al.Design of Machine Vibration Signal Data Acquisition System[J].Machine Tool & Hydraulics,2012(1):71-73.
[2]ZHANG Lianjun,HE Chun li,YANG Kang.et al.The Analysis of Vibration Signal Based on LabVIEW[J].Mechanical Management and Development,2010(1):10-12.
[3]HAN Guangliang,CAO Wenzhi,MA Xiaobo.et al.The Design of Data Acquisition System of the Machine Tools Based on LabVIEW [J].Manufacturing Technology &Machine Tool,2011(1):87-89.
[4]CHEN Xihong,ZHANG Yinhui.LabVIEW8.20 Programming from Entry to the Master[M].Beijing:Tsinghua University Publishing House,2007.
[5]HOU Hongling,BAI Haiqing.Study of Vibration Measurement System of Machine Spindle Based on Virtual Instrument[J].Machinery Design & Manufacture,2011(9):104-105.
[6]YU Guangli,DANG Lihui.Design of Vibration Signal Data Acquisition System for Rolling Bearing Life Testing Machine Based on Virtual Instrument Technology[J].Advanced Materials Research,2011:328-330,1963-1967.
[7]SHEN Baoshan,JI Changying,GUO Yu ping.et al.The Design of Acquisition System Based on LabVIEW[J].Machinery& Electronics,2009(4):76-78.
[8]TONG Li,PAN Hongxia,HU Tian.Condition Monitoring and Fault Diagnosing System for Electromechanical Equipment Based on LabVIEW[J].Instrument Technique and Sensor,2008(7):34-35.

- 機床與液壓的其它文章
- Detection of Bearing Fault Signal Based on the Wavelet and Chaos Theory
- Vibration Analysis of a Large-size Reduction Gearbox Test System Based on Its Dynamic Characteristics
- Fusion Control Strategy Based on I-Fuzzy-Smith Algorithm for Complex Process with Large Lag
- Simulation Analysis of PID Optimization of Hydraulic Pressure System Based on Genetic Algorithm
- Design of a State Monitoring and Alarm Device for Escalator
- The CFD Numerical Simulation on Ventilation of Indoor Transformer Substation