A Simple time-domain method for bearing performance degradation assessment*
2014-07-18 06:08:54LongZHANGWenyiHUANGNingWANGGuoliangXIONG
機床與液壓 2014年12期
Long ZHANG,Wen-yi HUANG,Ning WANG,Guo-liang XIONG
School of Mechatronics Engineering,East China Jiaotong University,Nanchang 330013,China
1.Introduction
Rolling bearings have found wide applications in rotating machinery;the running state will have a significant impact on the overall usage of equipment.It may cause serious damage if faults appear during applications and not been tackled in time.Characteristic features representing bearing fault types and performance of degradation degree are usually manifested in vibration signals.Therefore,the processing of vibration signal is essential to determine the bearing fault types and fault severity levels,which underlies CBM.
In addition to fault location,more and more attention has been attracted on the bearing performance degradation assessment.Chen et al.used the information entropy matrix of multi-channel and multispeed to describe the changing rule of vibration process,and proposed a new method of fault diagnosis based on information fusion,and validated the accuracy of the method in the fault diagnosis by examples[1].Wang et al.proposed a health index based on the Weibull theory[2].Using the frequency characteristics of defective bearings,feature vector was constructed and input to a neural network for training.The neural network is intended to establish the relationship between defectivecharacteristicsand bearing conditions,and then it yields a specific health index.The experimental results showed that the index is effective for fault degree assessment.SOM-based diagnosis system architecture was proposed by Dimitrios to monitor bearing faults,bearing performance degradation from health to failure being revealed by the system state change[3].A health index was put forward for bearing fault severity determination based on the EMD method and Lempel-Ziv indicator[4].Experimental results show the index decreases with fault severity in the case of inner race faults,while it increases for outer race defects.Au-toregressive modelwasallied with Kolmogorow-Smirnov test for bearing performance degradation assessment and was evaluated by a whole life bearing fatigue test.
Although considerable success has been reported with abovementioned works,the majority of such complex technologies need a large storage space to accommodate the sampling data and a better performance computer,which makes the realization of an intelligent sensor node greatly expensive.This paper discussed a novel simple time-domain method based on ZBWD(zero-crossing based waveform decomposition),which is capable of expressing the implicit information to embed in the signal objectively.The experiments of bearing fault monitoring verified the validity and practicability.
2.ZBWD
ZBWD is a simple way to describe the time-domain characteristics which separate the waveform into a collection of segments,followed by extracting the parameters of these segments to construct the index of rolling bearing fault degree[6].
2.1.Signal zero waveform parameter
ZBWD is a time-domain method which obtains the signal segments limited by two adjacent zeros.Each segment could be described by two parameters:D(the duration of each segment)and A(the amplitude of each segment).Where,D is related to signal characteristics in frequency domian and A is the signal energy.If the signal could be decomposed into N segments,the signal could be composed of 2×N parameters.Figure 1 shows the way to decompose a waveform[7].
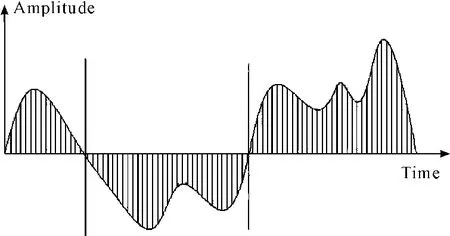
Figure 1.Waveform decomposition
2.2.The establishment of fault performance degradation index
With the increase of fault degree,the number of low frequency signal epoch will get increased.Therefore,the absolute value of the mean amplitude of low frequency segments could be regard as a performance degradation index[6-8].The calculation steps are as follows.
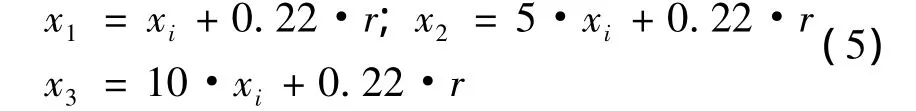
1)Obtain the Dm(the mean duration of all segments separated by adjacent zeros),and find any segments Ddwhose duration is greater than Dm:
2)Evaluate the mean of absolute amplitude value in Dd,namely MeanAmp:

3.Experiments and result analysis
3.1.Experiment 1
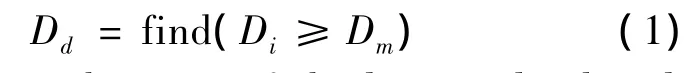
Bearing vibration signals are simulated for inner race defects with different fault severity levels.The signals are composed of two parts,i.e.,the intrinsic defect element xiand the white noise r.Different percentages of such two components mimic different fault severities.Herein,the sampling frequency fsis set as 20 480 Hz,while the length of the signal L=102 400 and inner race rotating speed f1=15 Hz.In addition,fault characteristic frequency of inner race BPFI=90 Hz,and bearing structure resonance frequency fres=3 500 Hz being modulated by an exponential decay E.
Where,a represents the fault degree,a larger value indicates a more serious defect.Three simulated signals with different fault degrees are shown in Figure 2.Where,fault severity level increases from x1to x3.
The MeanAmp of these three signals are given in Figure 3.Where,the signals of 102 400 points length were reshaped to 1024×100 and thus 100 values are shown for each signal.Obviously,MeanAmp could clearly distinguish different fault degree and it will increase with the increase of the fault degree.Hence,this simulation illustrates the feasibility by using the presented MeanAmp for bearing fault severity level assessment especially in the case of bearing inner race fault.
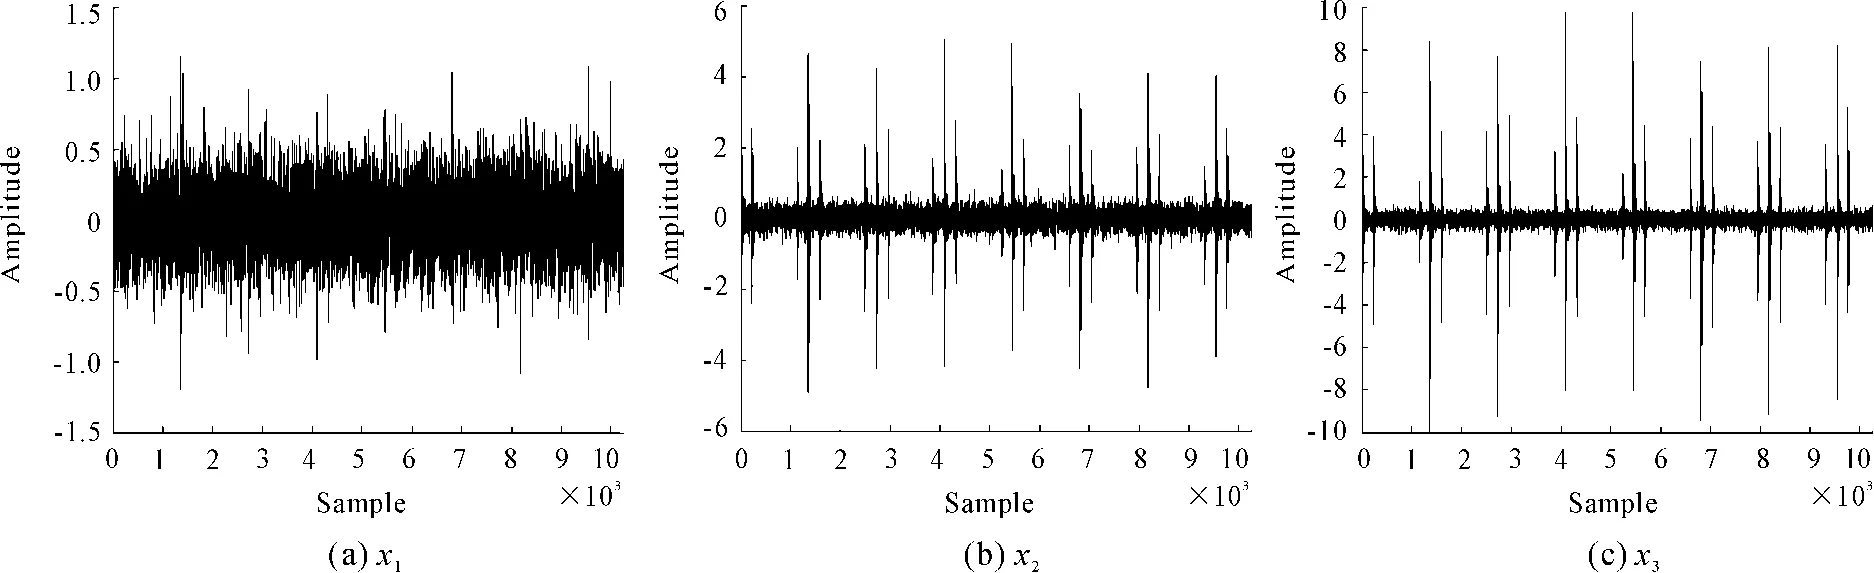
Figure 2.Simulated signals of three different fault degrees

Figure 3.MeanAmp of three different fault degrees
3.2.Experiment 2
This experiment performed bearing run-to failure tests under constant load conditions on a specially designed test rig,as shown in Figure 4[8].The bearing test rig hosts four test Rexnord ZA-2115 double row bearing on one shaft.The shaft is driven by an AC motor and coupled by rub belts.The rotation speed was kept constant at 2 000 r/min.A radial load of 26 689 N(6 000 lbs)is added to the shaft and bearing through a spring mechanism.An oil circulation system regulates the flow and the temperature of the lubricant.A magnetic plug installed in the oil feedback pipe collects debris from the oil as an evidence of bearing degradation.Test will stop when the accumulated debris adhered to the magnetic plug exceeds a certain level and cause a switch to turn off.The test bearing have 16 rollers in each row,a pitch diameter of 71.5 mm,roller diameter of 8.4 mm,and a tapered contact angel of 15.17°.A PCB 353b33 High Sensitivity Quartz ICP Accelerometer is installed on each bearing housing.
Data collection started from 2004.2.12 10:32:39 to 2004.2.19 06:22:39,collecting vibration signals every 10 minutes during test,and thus a total of 984 data files are obtained during the experimental process.The sampling frequency is 2 000 Hz,each sensor will collect 20480 data at each time.The first 8192 data of the second file(Bearing 2)was discussed here.
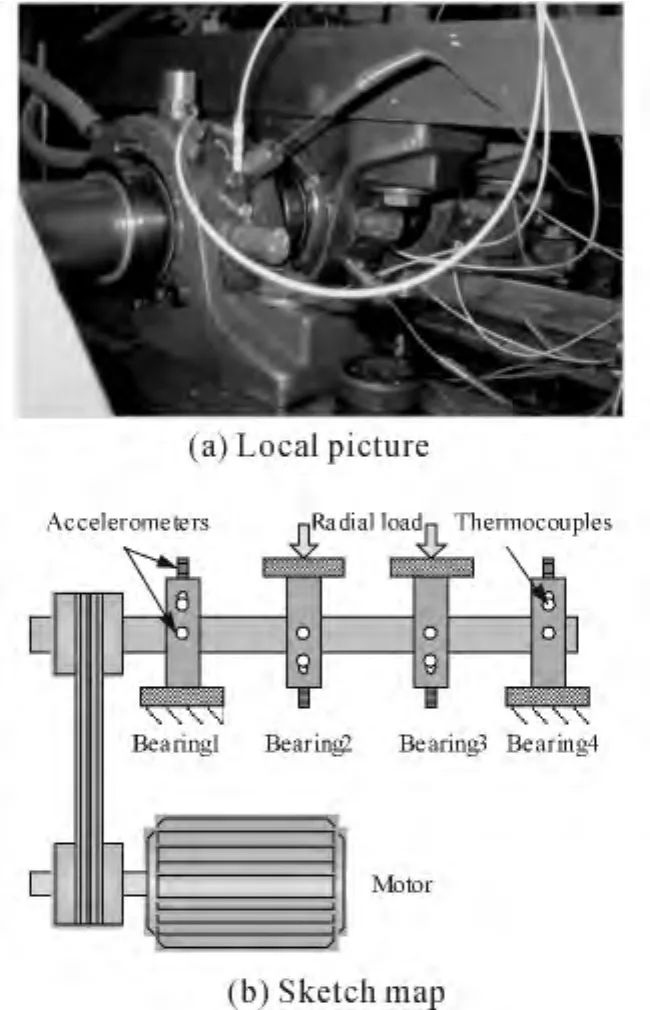
Figure 4.Bearing fatigue test bench
The MeanAmp of the 984 data files is shown in Figure 5,from which the following conclusions could be drawn.
1)For the first 600 data files,the MeanAmp remains a constant value,which represents that the bearing is running in a normal conditon without obvious fault.
2)From approximately 600th to 700th files,MeanAmp is more messy and has certain fluctuation than before,it indicates that bearing may be in an incipient fault stage.
3)During the span from 700th to 800th,Mean-Amp is increasing obviously due to the increase of bearing fault degree.
4)From the 800th to about 947th,MeanAmp gets increased sharply,which means a rapid degradation of bearing peformance occours.
5)Over the last stage,MeanAmp gets increased in the form of a straight line and it means an impending failure.
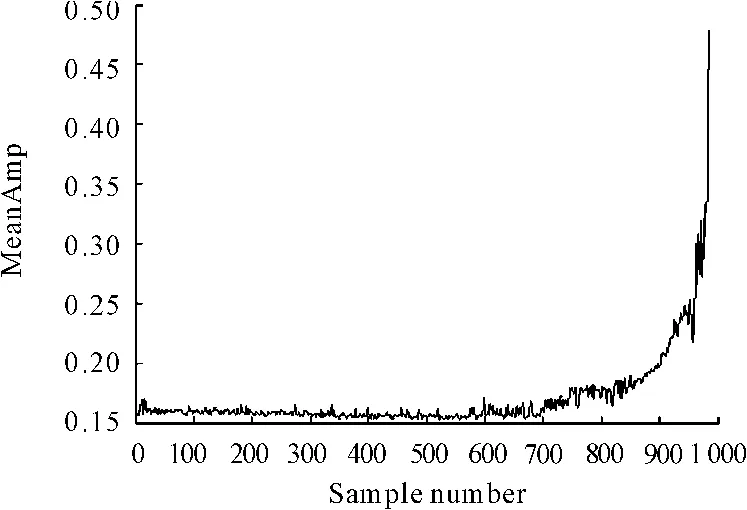
Figure 5.MeanAmp
These results reveal that the advantages of MeanAmp for the sensitivity and accuracy are easy to bearing performance degradation degree.When using this performance degradation index in practice,the following principles should be kept in mind.
1)If the MeanAmp value become more messy and fluctuated than before druing the bearing operation process,it should be carefully to observe.
2)When MeanAmp value gets continuesly increased,it shows that the bearing should be replaced in time so as to avoid an abrupt failure and eliminate the unnecessary losses.
For comparison purpose,the kurtosis of the 984 files are also given and shown in Figure 6.
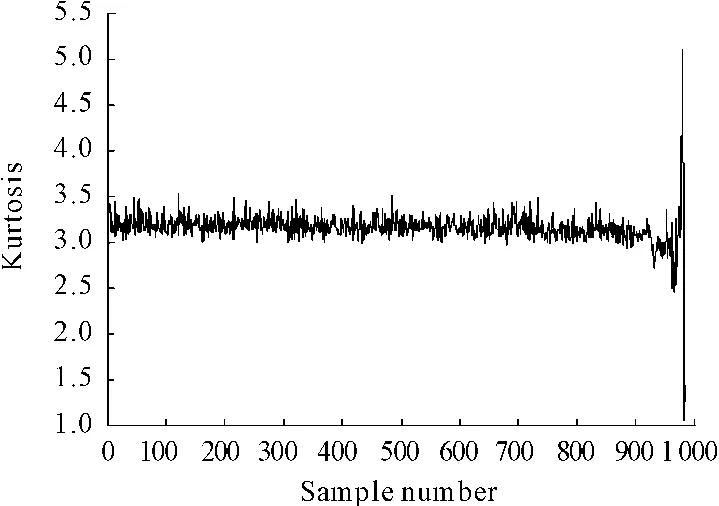
Figure 6.Kurtosis
Kurtosis is commonly employed in many applications to indicate fault severity level due to its sensitivity to impulses contained in signals.Based on what are shown in Figure 6,it could be observed that kurtosis is unable to detect bearing fault at an early stage and it cannot trend the development of bearing faults well.This comparative study highlights the merits of the presented bearing performance degradation assessment index MeanAmp.
4.Conclusion
Based on a simple time-domain paradigm of ZBWD,an index termed as MeanAmp which quantitatively indicates the degree of bearing performance degradation is proposed in this paper.MeanAmp is computationally efficient and easy to understand.A simulation example and a bearing run-to-failure experimental result demonstrate that the presented index MeanA-mp is sensitive to the change of bearing defects and it is able to detect an incipient defect.Therefore,the MeanAmp based on ZBWD has potential applications for rolling bearing fault degree monitoring.
[1]Chen F,Huang S,Zhang Y.A quantitative diagnosis method of vibration faults of rotating machinery based on process[J].Journal of Power Engineering,2008,28(4):543-547.
[2]Wang C,Robert X.Gao R,et al.Rolling bearing defect severity assessment under varying operating conditions[J].Manufacturing Research,2009,4(1):37-56.
[3]Dimitrios M,Dimitrios K,Sawalhi N.Fault severity estimation in rotating mechanical systems using feature based fusion and self-organizing maps[J].Artificial Neural Networks,2010,6353:410-413.
[4]Dou D,Zhao Y.The identification study of rolling bearing damage based on EMD and Lampel-Ziv index[J].Vibration and shock,2010(3):5-8,200.
[5]Cong F,Chen J,Dong G.Research on Kolmogorov-Smirnov degradation and prediction of performance test based on AR model[J].Vibration and shock,2012(10):79-82.
[6]Abdusslam S,Ahmed M,Raharjo P,et al.Time Encoded Signal Processing and Recognition of Incipient Bearing Faults[C].In:Proceedings of the 17th International Conference on Automation & Computing.Chinese Automation and Computing Society,Huddersfield,2011.
[7]Abdusslam S,Ahmed M,Raharjo P,et al.Time Encoded Signal Processing and Recognition of incipient bearing faults[C].Automation and Computing(ICAC),17th International Conference on,2011:289-293.
[8]Lee J,Qiu H,Yu G,et al.Rexnord Technical Services:Bearing Data Set[Z].2007:IMS,Univ.Cincinnati.NASA Ames Prognostics Data Repository,NASA Ames[online]Available.
- 機床與液壓的其它文章
- Application of fusion control strategy in purification treatment for workshop wastewater*
- Research on the development trend of marine hydraulic crane
- Structural design and performance testing of the electromagnetic proportional pressure relief valve
- Approaches and development of the modeling of the spiral bevel and hypoid gear*
- Research of data transmission path of neutral file between Pro/E and ADAMS*
- Tool wear monitoring based on wavelet packet coefficient and hidden Markov model*