An automatic identification algorithm for freeway bottleneckbased on loop detector data
2014-09-06 10:49:51WangChaonanLiWenquanTongXiaolongChenChen
Wang Chaonan Li Wenquan Tong Xiaolong Chen Chen
(School of Transportation, Southeast University, Nanjing 210096, China)
?
An automatic identification algorithm for freeway bottleneckbased on loop detector data
Wang Chaonan Li Wenquan Tong Xiaolong Chen Chen
(School of Transportation, Southeast University, Nanjing 210096, China)
A bottleneck automatic identification algorithm based on loop detector data is proposed. The proposed algorithm selects the critical flow rate as the trigger variable of the algorithm, which is calculated by the road conditions, the level of service and the proportion of trucks. The process of identification includes two parts. One is to identify the upstream of the bottleneck by comparing the distance between the current occupancy rate and the mean value of the occupancy rate and the variance of the occupancy rate. The other process is to identify the downstream of the bottleneck by calculating the difference of the upstream occupancy rate with that of the downstream. In addition, the algorithm evaluation standards, which are based on the time interval of the data, the detection rate and the false alarm rate, are discussed. The proposed algorithm is applied to detect the bottleneck locations in the Shanghai Inner Ring Viaduct Dabaishu-Guangzhong road section. The proposed method has a good performance in improving the accuracy and efficiency of bottleneck identification.
bottleneck; loop detector data; occupancy rate; flow rate
Typical bottleneck analysis methods involve congestion graphics, vehicle arrival curves and the traffic flow theory. The methods above are based on the loop detector data. They assume that traffic patterns can be determined by the functional relationship of traffic flow and occupancy. The data analysis methods include decision trees, statistical analysis and filtering. With the development of data collection and information processing technology, the fuzzy theory, expert evaluation, pattern recognition, and artificial intelligence techniques have become important methods in congestion automatic identification algorithms. ACI algorithms can be divided into discrete and continuous types[1-2]. The discrete method is based on the traffic parameter threshold. It is assumed that congestion occurs when a certain traffic parameter is greater than the threshold value. In 1997, with the vehicle arrival curves, Cassidy et al.[3]discussed the length of queues and waiting time in congestion. Based on the research findings of congestion, Bertini et al.[4]proposed an automatic bottleneck recognition algorithm in 2005, identifying and classifying bottlenecks with historical data, and taking speed as the indicator of a bottleneck. However, these algorithms have not analyzed the statistical features of a bottleneck in detail, which decrease the precision of identification algorithms. Besides, most congestion identification algorithms were about congestion points. The research target of bottleneck identification is to discover the congestion influence scope, including the upstream and downstream of bottleneck locations. Therefore, a traffic flow analysis with more integrity is necessary.
In this research, based on loop detector data, the critical flow rate is calculated as the trigger variable, which is calculated by the road conditions, the level of service and the proportion of trucks. Occupancy is calculated as the identification parameters. In addition, algorithm evaluation standards are discussed.
1 Description of the Algorithm
In this algorithm, the critical flow rate is defined as the trigger variable, and it is calculated based on the road conditions, the level of service and the proportion of trucks. When the flow rate is greater than the critical value, the identification process can start[5-6].
1.1 Trigger variable of the algorithm
According to the traffic flow theory, when traffic demand exceeds road capacity, resulting in congestion, the flow rate decreases and congestion forms. Therefore, the flow rate can be used as the trigger variable of the algorithm. The critical flow rate is determined by the designed capacity and the level of service. User perceptions are variable at different time and in different environments. AASHTO design standards suggest that a good target level of service in an urban area is D, but in a rural area a good target level of service is C. Generally, when the level of service is C, average speeds begin to decline with increasing flow[7]. We define the situation, in which the level of service is C, as the trigger point. However, it is difficult for the bottleneck automatic identification system to calculate theV/Cratio. The trigger value should be obtained immediately. Therefore, the accumulative flow rate in 5 min as the trigger variable is chosen. Tab.1 lists the criticalV/Cratio based on the level of service and the design speed. The capacity should be multiplied by theV/Cratio when the level of service is C to obtain the trigger value.

Tab.1 Critical V/Cratio based on LOS and FFS
The influence of large vehicle on traffic flow is not considered when calculating the free flow speed. Therefore, the trigger value obtained from Tab.1 should be multiplied byfHV.
1.2 Identification process
There are two elementary values which need to be defined in the bottleneck automatic identification algorithm. One is the minimum value of the difference between the upstream and downstream occupancy rates. The other one is the minimum value of the upstream occupancy rate. To define the difference between the upstream and downstream occupancy, it must be ensured that the upstream is in a state of congestion, and the downstream is free flow[8-10].
Before defining the critical value, we should analyze the historical data to obtain the difference between the upstream and downstream occupancy rates. Experiments show that there are some overlaps in the difference between them. As this algorithm also requires the upper occupancy rate greater than a certain critical value, it should be ensured that the critical value of the difference between the upstream and downstream occupancy rates is smaller than the occupancy rate when a bottleneck occurs.
積累數學基本活動經驗是一個長期的過程,需要我們在平時的教學中不斷為學生提供活動的機會,精心設計組織好每一個數學活動,使數學學習成為一個生動活潑、富有創造意義的過程,促進學生思維的發展。
As the maximum upstream occupancy rate is affected by the road conditions, we use the distance between the current occupancy rate and the mean value of the occupancy rate fromts-1tots-6instead of the maximum upstream occupancy rate. The distance between the current occupancy rate and the mean value of the occupancy rate is equal to the current occupancy rate subtracting the mean value of occupancy rates fromts-1tots-6.
Doi=O(i,ts)-E(Ots-1,…,Ots-6)
(1)
whereDoiis the distance between the current occupancy rate and the mean value of the occupancy rate fromts-1tots-6;O(i,ts) is the occupancy rate atts;E(Ots-1,…,Ots-6) is the mean value of the occupancy rate fromts-1tots-6.
IfDoiis greater than the variance of the occupancy rate fromts-1tots-6, we assume that unitiis the upstream of the bottleneck.
Doi=S(Ots-1,…,Ots-6)+α
(2)
whereS(Ots-1,…,Ots-6) is the variance of the occupancy rate fromts-1tots-6;αis the adjustment parameter.
Based on the definition of a bottleneck, the downstream of the bottleneck is free flow, which means that there is a value difference between the upstream and downstream occupancy. Experiments show that regional differences have an impact on the critical value of the difference between the upstream and downstream occupancy. Data analysis is a common method to determine the critical value of difference, but the analysis process is very complicated. In order to make the parameter in this algorithm universal, we use an adjustment parameter. To speed up the process of bottleneck identification, we also use the mean value of occupancy rate fromts-1tots-6.
The difference between the upstream and downstream occupancy rates equals the current occupancy rate at pointI, which subtracts the downstream occupancy rate. It should be noted that the value ofnin the following formula requires several further tests.
P(ts)=O(i,ts)-O(i+n,ts)
(3)
whereP(ts) is the difference between the upstream occupancy rate and that of the downstream;O(i,ts) is the downstream occupancy rate at pointi;O(i+n,ts) is the occupancy rate,n=1, 2,…
The critical value of difference after adjustment equals the difference between the upstream occupancy and the downstream occupancy, divided by the mean value of the occupancy rate fromts-1tots-6.
Pr(ts)=P(ts)/E(ots-1,…,ots-6)
(4)
wherePr(ts) is the critical value of difference after adjustment;E(ots-1,…,ots-6) represents the mean value of the occupancy rate fromts-1tots-6.
The parameteriin Eq.(3) is defined as the section of pavement units when identifying the location of the bottleneck. The value ofiequals the longitudinal space of loop detectors, which is 20 or 50 m on the expressway.
The parametertis defined as the data aggregation level. The original loop detector data is collected every 20 s, which is highly volatile. Different data aggregation levels can affect the promptness and accuracy of the algorithm. So the original loop detector data should be facilitated aggregation before being used in the algorithm. Details will be discussed in the following section.
Fig.1 shows the process of bottleneck automatic identification.
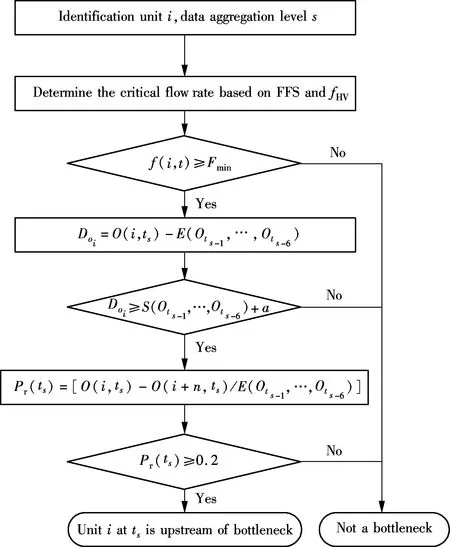
Fig.1 The process of bottleneck automatic identification
As shown in Fig.1, the first step of the bottleneck identification algorithm is to divide the road section into several units and to determine data aggregation level. Then, the critical rate of flow is calculated. After preprocessing,f(i,t) is compared with the critical rate. Iff(i,t) is greater, the process of bottleneck identification can start. The process of identification includes two parts. One is to identify the upstream of the bottleneck by comparing the distance between the current occupancy rate and the mean value of occupancy rateDoiwith the variance of the occupancy rate. IfDoiis greater than the variance of the occupancy rate fromts-1tots-6, assume that unitiis the upstream of bottleneck. The other is to identify the downstream of bottleneck by calculatingPr(ts). IfPr(ts) is greater than 0.2, assume that uniti+nis the downstream of bottleneck.
1.3 Evaluation model
The accuracy of this automatic recognition algorithm of the bottleneck should be determined by three aspects. The first aspect is the percentage of the bottleneck points that can be recognized at all the bottleneck points; the second is the percentage of “fake bottleneck points” in the bottleneck points that are recognized; and the third is the time interval of the date which can also influence the sensitivity of the algorithm. In practice, regional differences make it difficult to balance the failure of recognizing the real bottleneck points and the mistaken recognition of “fake bottleneck points”. So the optimal choice of parameters depends on the user’s choice of a composite score function that takes the relative costs of missed bottlenecks and false alarms into account.
The percentage of the bottleneck points recognized equals the number of the bottleneck points which have been recognized divided by the number of the total bottleneck points. While the percentage of “fake bottleneck points” equals the number of the fake bottleneck points which have been recognized, divided by the number of the total bottleneck points which have also been recognized.

(5)
whereTis the percentage of the bottleneck points recognized;tbis the number of the bottleneck points which have been recognized;nbrepresents the number of the whole bottleneck points.

(6)
whereFmeans the percentage of “fake bottleneck points”;fbis the number of the fake bottleneck points which have been mistaken;ibis the number of the total bottleneck points which have been recognized.
The accuracy of this automatic recognition algorithm of bottleneck can be calculated as
S=β(αTT-αFF)
(7)
whereSis the accuracy of this automatic recognition algorithm of the bottleneck;βis the correction coefficient determined by the time interval;αTis the penalty weight of the success rate;αFis the penalty weight of the false-alarm rate.
2 Actual Analysis
One-week (from Sept 21 to Sept 27, 2012) loop detector data on the Shanghai Inner Ring Viaduct (5:00—11:00, 14:00—20:00) were obtained from the Shanghai Transportation Operation Department. The research scope starts from Dabaishu and runs to Guangzhong Road.
The first step of the bottleneck identification algorithm is to divide the road sections into several units and determine the data aggregation level. In this research, the number of road units is determined by the spacing of loop detectors. If the loop detector data is aggregated into 1-min data, the algorithm should be restricted by some additional conditions. For example, a sustained bottleneck filter is added to smooth the results of the algorithm. This filter discards false positives that are isolated in the time dimension from other detections at the same location.
It can be seen from Fig.1 that when loop detector data is aggregated into 3-min data sets, the upstream occupancy remains greater than the downstream occupancy but the difference in values fluctuates greatly. To obtain higher recognition rate, the difference between the upstream and downstream occupancy should be set to be small, which will increase the possibility of false alarm bottlenecks. Then we facilitate further aggregation into 5-min and 10-min data sets. As Figs.2(b) and (c) show, the occupancy rates in bottlenecks (Oi) remain stable.
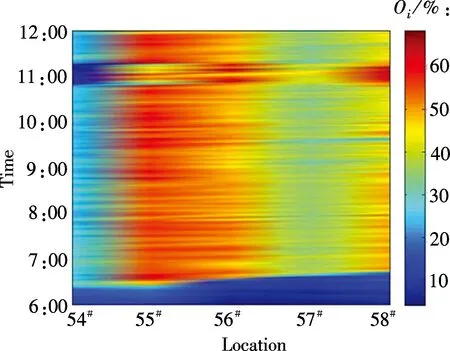
(a)

(b)

(c)
Based on the above analysis, we conclude that the smaller time interval leads to higher sensitivity. Experiments show that 5-min aggregation data fits the algorithm best.
In Tab.1, criticalV/Cratio is 0.83 when the level of service is C and the design speed is 80 km/h. Then,fHVis 0.9. The design capacity of the Shanghai Inner Ring Viaduct is 1 800 (pcu·h-1)/lane. Thus, the final critical flow rate in 5 min is 108 pcu.
Then we input the 5-min data sets to Matlab. When the flow rate is greater than 108 pcu, the algorithm starts. IfDoiis greater than the variance of the occupancy rate fromts-1tots-6, assume that unitiis the upstream of the bottleneck. IfPr(ts) is greater than 0.2, assume that uniti+nis the downstream of the bottleneck.
The session is identified by Matlab in a space-time distribution airstrip, as shown in Fig.3.
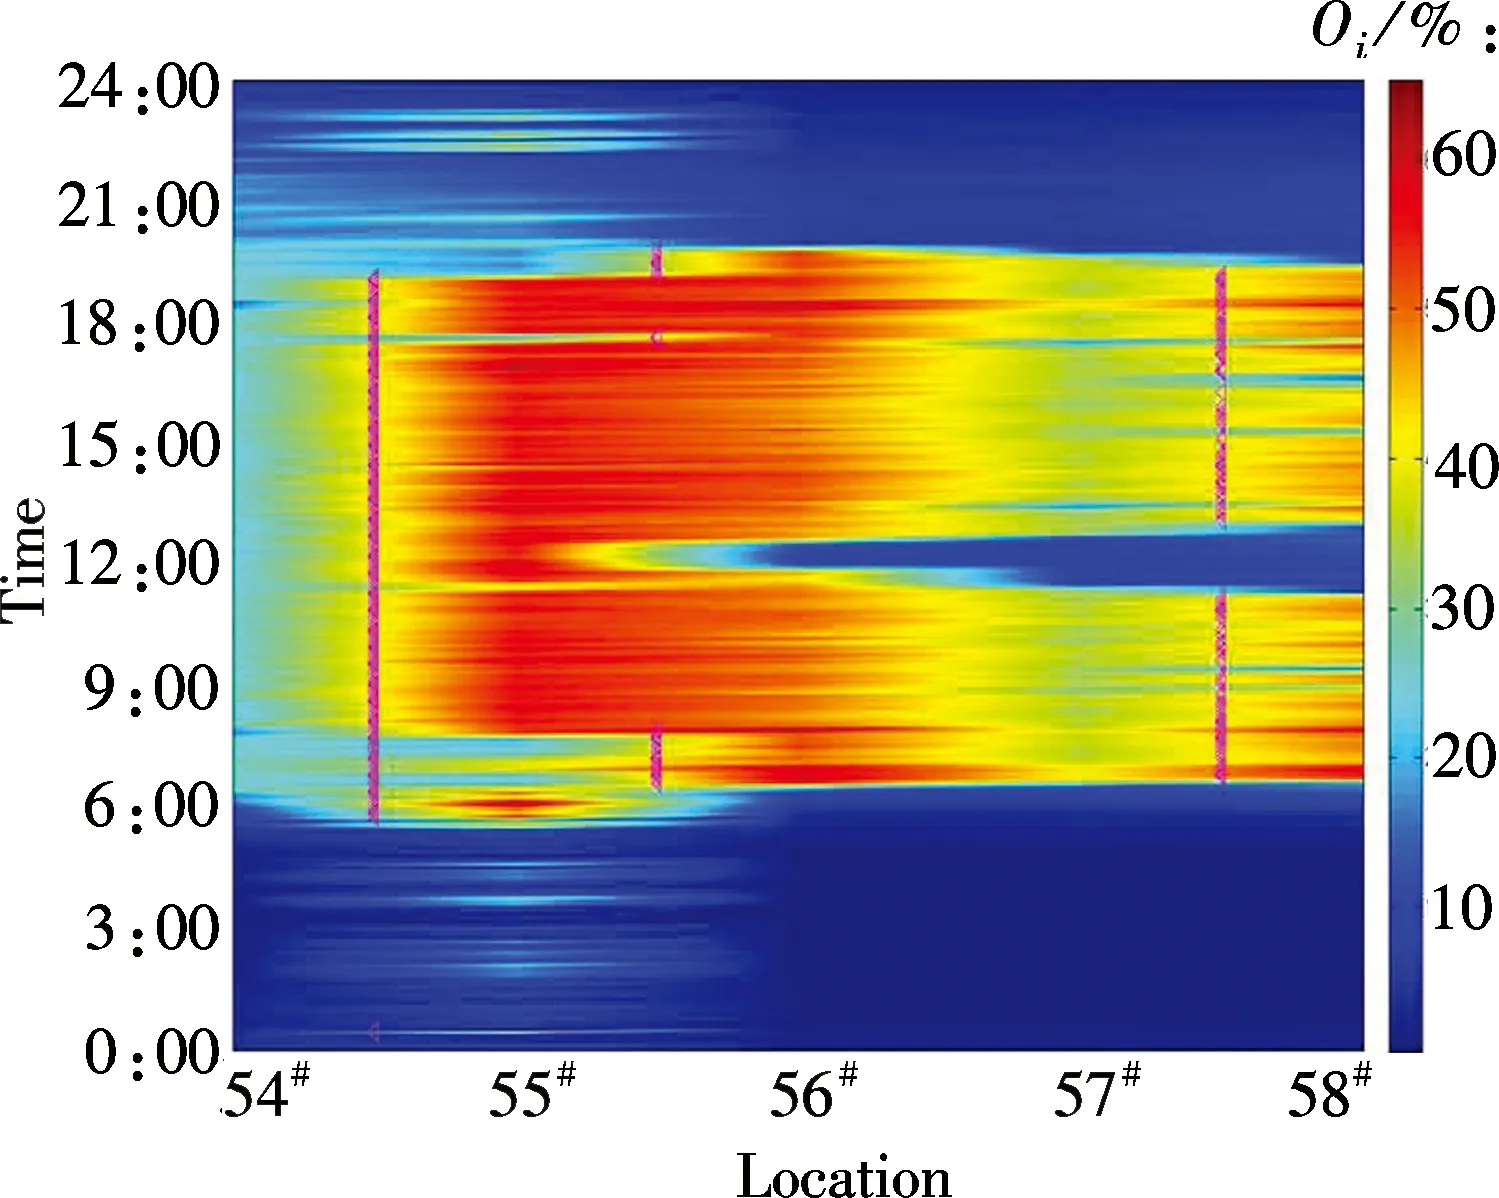
Fig.3 Bottleneck identified with the algorithm
Fig.3 presents the bottleneck locations identified which are marked with the triangles. In this analysis, three severe bottleneck locations were found.
The point where No.56 loop detector is located becomes congested at 6:55, giving rise to congestion and vehicle delays between the No.55 loop detector and No.56 loop detector. The occupancy rate starts to decrease at 9:20, which means that the congestion has started to be relieved. The road section between the No.56 loop detector and No.58 loop detector is free flow between 6:00 and 6:35. Then the occupancy rate begins to increase and the point where the No.58 loop detector is located becomes congested at 7:10. The occupancy rate begins to decrease at 8:40. Finally, the road section has free flow at 9:45.
3 Evaluation
In section 2, we analyze the distribution of the bottleneck in time and space through identifying bottleneck locations and their activation and deactivation periods. On the other hand, we are informed of the real distribution of bottlenecks through video data. Based on this, the accuracy of the proposed algorithm is confirmed. The evaluation consists of a series of indices, including the detection rateTand the false alarm rateF.
It can be seen from Tab.2 that the proposed algorithm has a reasonable detection performance compared to other methods. Otherwise, the percentage of fake bottleneck points is 0.1. The critical flow rate and the occupancy threshold value are decreased to increaseT. The parameter values can be optimized to decreaseFin application.

Tab.2 Evaluation results of the proposed algorithm
The proposed algorithm also outperforms previous cumulative curve methods in terms of precision and identification efficiency. In the cumulative curve method, each identification process is subject to interference by earlier data. In the proposed algorithm, the identifying process is only determined by the current data.
4 Conclusion
1) The statistical analysis of loop detector data shows that the flow rate and occupancy are more reliable parameters than speed for bottleneck identification, excluding affection by speed limits.
2) Loop detector data should be aggregated before the identification process. Experiments show that a 5-min aggregation data fits the algorithm best.
3) A bottleneck identification algorithm based on the flow rate and occupancy is proposed. The proposed algorithm includes the trigger variable, the identification process and the evaluation model. The algorithm reduces the influence of road conditions and data error by parameter optimization. The results show that the proposed algorithm has a good performance in improving the accuracy of bottleneck identification.
4) Although the results are encouraging, a number of extensions to the algorithm need to be studied. Further research should be carried out to validate this algorithm on other types of roads. Note also that the original loop detectors data should be aggregated before analysis and that we need toseek a better method of data aggregation to increase the speed of the algorithm.
[1]Chung K, Rudjanakanoknad J, Cassidy M J. Relation between traffic density and capacity drop at three freeway bottlenecks[J].TransportationResearchPartB:Methodological, 2007, 41(1): 82-95.
[2]Banks J H. Review of empirical research on congested freeway flow[J].TransportationResearchRecord, 2002, 1802: 225-232.
[3]Cassidy M J, Windover J R. Methodology for assessing dynamics of freeway traffic flow[J].TransportationResearchRecord, 1995(1484): 73-79.
[4]Bertini R L, Myton A. Using PeMS data to empirically diagnose freeway bottleneck locations in Orange County, California[J].TransportationResearchRecord, 1925, 2005: 48-57.
[5]Shoraka M, Puan O C. Review of evaluating existing capacity of weaving segments[J].InternationalJournalofCivilandStructuralEngineering, 2010, 1(3): 683-694.
[6]Coifman B, Mishalani R, Wang C, et al. Impact of lane-change maneuvers on congested freeway segment delays: pilot study [J].TransportationResearchRecord, 2006, 1965: 152-159.
[7]Cassidy M J, Mauch M. An observed traffic pattern in long freeway queues[J].TransportationResearchPartA:PolicyandPractice, 2001, 35(2): 143-156.
[8]Kumar R, Wolenetz M, Agarwalla B, et al. DFuse:a framework for distributed data fusion[C]//Proceedingsofthe1stInternationalConferenceonEmbeddedNetworkedSensorSystems. Los Angeles, CA, USA, 2003:114-125.
[9]Newell G F. A simplified car-following theory: a lower order model[J].TransportationResearchPartB:Methodological, 2002, 36(3): 195-205.
[10]Cassidy M J. Bivariate relations in nearly stationary highway traffic[J].TransportationResearchPartB:Methodological,1998, 32(1): 49-59.
基于線圈數據的瓶頸點自動識別算法
王超楠 李文權 童小龍 陳 晨
(東南大學交通學院, 南京 210096)
提出了一種基于線圈數據的瓶頸點自動識別算法.算法以臨界流量作為算法的觸發變量,根據道路條件、服務水平和大型車比例計算臨界流量.算法的識別程序包括2部分:首先通過計算當前占有率與前時刻占有率的相對差值來判定瓶頸點上游位置;然后通過計算上游占有率與下游占有率的相對差值確定瓶頸點下游的位置.此外,提出了基于數據集計周期、瓶頸點識別率和誤判率的算法性能評價方法.利用上海市內環高架大柏樹-廣中路段的線圈數據進行試驗,結果表明,瓶頸點自動識別算法在準確率和效率上有顯著提高.
瓶頸點;線圈數據;占有率;流量
U491.2
Received 2014-02-22.
Biographies:Wang Chaonan (1990—), female, graduate; Li Wenquan(corresponding author), male, doctor, professor, wenqli@seu.edu.cn.
:Wang Chaonan, Li Wenquan, Tong Xiaolong, et al. An automatic identification algorithm for freeway bottleneck based on loop detector data[J].Journal of Southeast University (English Edition),2014,30(4):495-499.
10.3969/j.issn.1003-7985.2014.04.016
10.3969/j.issn.1003-7985.2014.04.016
登錄APP查看全文
猜你喜歡
少先隊活動(2022年5期)2022-06-06 03:45:04
家庭科學·新健康(2022年3期)2022-05-10 00:32:13
中老年保健(2021年2期)2021-08-22 07:31:10
特別健康(2018年3期)2018-07-04 00:40:18
海峽姐妹(2018年3期)2018-05-09 08:20:40
發明與創新(2016年26期)2016-08-22 03:23:28
新民周刊(2016年15期)2016-04-19 18:12:04
新民周刊(2016年15期)2016-04-19 15:47:52
電測與儀表(2016年6期)2016-04-11 12:06:38
漫畫月刊·炫版(2014年3期)2014-05-27 04:17:21
 Journal of Southeast University(English Edition)
2014年4期
Journal of Southeast University(English Edition)
2014年4期
- Journal of Southeast University(English Edition)的其它文章
- Simulation of urban affordable housing land-use evolution based on CA-MAS model
- Dynamical chiral symmetry breaking in QED3
- A decision model of optimal production reliability and warranty length in an imperfect production system
- Metal cation crosslinking of TiO2-alginate hybrid gels
- One-pot facile synthesis of highly photoluminescent graphene quantum dots with oxygen-rich groups
- Modeling household car ownership using ordered logistic regression model