脂質聚集指數與成年女性高尿酸血癥的相關性研究
2015-06-28 15:42:15桂靈升李蓉楊蕾段鳳儀李岱龔莉琳張素華
解放軍醫學雜志 2015年12期
桂靈升,李蓉,楊蕾,段鳳儀,李岱,龔莉琳,張素華
脂質聚集指數與成年女性高尿酸血癥的相關性研究
桂靈升,李蓉,楊蕾,段鳳儀,李岱,龔莉琳,張素華
目的探討脂質聚集指數(LAP)與女性高尿酸血癥的關系。方法本研究為橫斷面研究。共納入2006年3-9月重慶市珞璜社區成年女性174例,均為體檢人群。測量所有研究對象的身高、體重、腰圍(WC)、血壓、尿酸(UA)、血糖、胰島素、血脂,計算體重指數(BMI),胰島素抵抗指數(HOMA-IR)和LAP。根據尿酸水平分為正常組及高尿酸癥組,采用獨立樣本的t檢驗進行比較。根據LAP水平四分位水平分為4組,組間比較采用單因素方差分析。采用Pearson相關分析和多元線性逐步回歸分析研究UA和其他變量之間的關系。采用logistic回歸分析LAP最高四分位數研究對象高尿酸血癥發生風險的比值比(OR)。采用ROC曲線分析各指標對高尿酸血癥的預測能力。結果與尿酸正常者相比,高尿酸血癥者年齡、WC、TG、空腹胰島素(FINS)、HOMA-IR和LAP明顯增高(P<0.05)。根據研究對象LAP水平四分位數分組進行比較,年齡、WC、BMI、收縮壓(SBP)、舒張壓(DBP)、甘油三酯(TG)、總膽固醇(TC)、低密度脂蛋白膽固醇(LDL-C)、空腹血糖(FPG)、餐后2h血糖(2h-PPG)、FINS、HOMA-IR和UA隨LAP增高明顯增高(P<0.05),而高密度脂蛋白膽固醇(HDL-C) 明顯降低(P<0.05)。Pearson相關性分析顯示,UA與年齡、WC、BMI、SBP、DBP、TG、TC、LDL-C、FPG、2h-PPG及LAP呈正相關(P<0.05),與HDL-C呈負相關(P<0.05)。以UA為因變量的多因素分析結果顯示,LAP、SBP和HDL-C進入篩選模型(LAP:標準回歸系數=0.306,P=0.010;SBP:標準回歸系數=0.189,P<0.001;HDL-C:標準回歸系數=–0.185,P=0.014)。Logistic回歸分析結果顯示,研究對象LAP在上四分位(LAP≥20.2)者比LAP在下四分位者(LAP<20.2)發生高尿酸血癥的風險增加2.02倍(OR=2.02,95%CI 0.30~5.91,P=0.045)。ROC曲線分析顯示,LAP曲線下面積(0.86±0.06,95%CI 0.75~0.98)。結論在成年女性中LAP是一個與高尿酸血癥發生密切相關的脂質聚集指標。
尿酸;高尿酸血癥;脂質聚積指數;代謝綜合征X;高血壓
尿酸是嘌呤的代謝產物,內源性或外源性代謝異常可使體內尿酸水平升高而發生高尿酸血癥。高尿酸血癥是痛風發生最重要的原因,在許多代謝性疾病的發生發展中也起到重要的作用,其中包括代謝綜合征[1]。有研究表明,尿酸升高與代謝綜合征發生的密切聯系在女性人群較男性人群中更為顯著[2]。高尿酸血癥的發病原因目前仍不清楚,在男性人群中其誘發的風險因素包括肥胖、高嘌呤食物攝入、過量飲酒及某些特定藥物的使用等。而影響女性尿酸代謝的各種內分泌因素相比男性更加復雜,初次月經及絕經時間對女性高尿酸血癥的發生都有一定影響[3]。因此,探索女性血尿酸升高的風險因素對防治女性高尿酸血癥及代謝綜合征具有重要的臨床意義。
一般來說,高尿酸血癥定義為血清尿酸(UA)濃度大于416μmol/L(成年男性)和356μmol/L(成年女性)[4]。高尿酸血癥與肥胖特別是中心性肥胖密切相關[5]。研究發現,高尿酸血癥的發病率隨體重指數(BMI)的增加而增加,隨體重減輕其發病率也減少[4,6]。男性患者中高尿酸血癥與BMI、腰圍(WC)有關[6]。然而,BMI和WC不能綜合反映機體的肥胖和代謝異常程度。通過身高和體重計算而來的BMI不能很好地反映體內脂肪的含量和分布情況。WC是反映中心性肥胖的有效指標,但它不具備對機體皮下脂肪和內臟脂肪的區分作用,而后者與高尿酸血癥的聯系更加緊密。
由于女性內分泌代謝因素的復雜性,WC及BMI不能很好地反映其高尿酸代謝的異常。脂質聚集指數(LAP)最初由Kahn[7](NHANES Ⅲ)定義并提出。它結合WC、甘油三酯(TG),能更好地反映中心性肥胖脂質的積聚。研究發現,LAP是一個與代謝綜合征、糖尿病密切相關的代謝指標,其關聯程度超過BMI[8]。本研究旨在觀察LAP與女性高尿酸血癥之間的聯系,探討相較于BMI和WC等指標,LAP與高尿酸血癥的關系是否更明顯。
1 資料和方法
1.1 研究對象 本研究為橫斷面流行病學研究。受試者為年齡20~80歲女性,采用簡單隨機抽樣的方法從2006年3-9月重慶市珞璜社區體檢人群中招募。本研究經重慶醫科大學附屬第一醫院倫理委員會批準,所有受試者入選前都簽署知情同意書。排除標準:①受試者正在使用可導致血尿酸水平增加或減少的某些特定藥物;②受試者飲酒超過20g酒精/d;③正接受降脂治療;④合并急慢性感染性疾病;⑤腫瘤患者;⑥腎功能不全。最終共有174例女性受試者納入。根據中國原發性痛風診治指南,定義正常血清UA的上限為356μmol/L[9]。
1.2 指標測定及定義 所有研究對象測量了身高、體重、WC、血壓、UA、血糖、胰島素、血脂,計算了BMI(BMI=體重/身高2),胰島素抵抗指數(HOMA-IR)=空腹胰島素(FINS)×空腹血糖(FPG)/22.5,LAP=(WC-58)×TG[7]。WC測量的位置為髂嵴頂點與肋骨最下緣中點。血壓測量采用水銀血壓計測定坐位左胳膊血壓兩次的平均值。血標本采集選用夜間禁食次日7:00到9:00采集的靜脈血。口服75g葡萄糖進行葡萄糖耐量試驗,己糖激酶法測量血糖(Olympus Diagnostics,Tokyo,Japan),化學發光法測定血清FINS(Roche Diagnostics,Mannheim Germany)。酶法測定血脂(Wako Diagnostics,Tokyo,Japan)。酶比色法測定血清UA水平(Roche Diagnostics,Mannheim Germany)。定義女性腹型肥胖為WC≥80cm[10]。根據中國成人血脂紊亂防治指南標準定義各種血脂異常[11]。
1.3 統計學處理 采用統計軟件SPSS 11.5(SPSS,Inc.,Chicago,IL,USA)進行分析。正態分布數據表示為,偏態分布數據表示為M(Q1-Q3)并通過log轉換(基于10)后進行分析。兩組連續變量之間的比較采用獨立樣本的t檢驗。多組連續變量間的比較采用單因素方差分析進行統計。采用Pearson相關分析和多元線性逐步回歸分析研究UA和其他變量之間的關系。Logistic回歸分析用于統計LAP最高四分位數研究對象高尿酸血癥發生風險的比值比(OR)。ROC曲線分析各指標對高尿酸血癥的預測能力。P<0.05為差異有統計學意義。
2 結 果
2.1 人群一般特征 174例女性受試者的年齡43.4±10.6歲,60歲以上占9.2%,60歲以下占90.8%。本研究中高尿酸血癥(UA>356μmol/L)的檢出率為6.3%,高血壓(高血壓病史或SBP≥140mmHg 或DBP≥90mmHg)的檢出率為12.6%,糖尿病[糖尿病病史或空腹血糖(FPG)≥7.0mmol/L或餐后2h血糖(2h-PPG)≥11.1mmol/L]的檢出率為5.2%,腹型肥胖(WC≥80cm)的檢出率為14.9%。受試者中14.9%有高甘油三酯血癥(TG≥1.70mmol/L),30.5%有高膽固醇血癥(TC≥5.18mmol/L),5.0%有低密度脂蛋白膽固醇(LDL-C)增高(LDL-C≥3.37mmol/L),17.8%有高密度脂蛋白膽固醇(HDL-C)降低(HDL-C <1.3mmol/L)。根據UA值的大小分組:正常組(UA <356μmol/L),高尿酸血癥組(UA≥356μmol/L)。高尿酸血癥組年齡分布在47.8±14.6歲。與正常組相比,高尿酸血癥組的年齡、WC、TG、FINS、HOMA-IR和LAP均明顯增高(P<0.05);而BMI、SBP、DBP、TC、HDL-C、LDL-C、FPG、2h-PPG在兩組間差異無統計學意義(P>0.05)。研究對象的基本臨床和生化特征見表1。

表1 研究對象一般特征Tab.1 General characteristics of subjects
根據L AP四分位數將研究對象分為4組。Q1:LAP<5.7cm×mmol/L;Q2:LAP(5.7~10.8) cm×mmol/L;Q3:LAP(10.8~20.2)cm×mmol/L和Q4:LAP>20.2cm×mmol/L對4組的年齡、WC、BMI、SBP、DBP、TG、TC、HDL-C、LDL-C、FPG、2h-PPG、FINS和HOMA-IR進行比較,表2結果顯示,年齡、WC、BMI、SBP、DBP、TG、TC、LDL-C、FPG、2h-PPG、FINS、HOMA-IR和UA隨LAP的增高而明顯增高(P<0.05),而HDL-C隨LAP增高而明顯降低(P<0.05)。
2.2 UA與各變量的相關性 Pearson相關性分析結果顯示,UA與年齡、WC、BMI、SBP、DBP、TG、TC、LDL-C、FPG、2h-PPG及LAP呈正相關,與HDL-C呈負相關(P<0.05)。此外FINS、HOMA-IR與UA的相關性差異無統計學意義(P>0.05,表3)。
2.3 多元線性逐步回歸分析 取血清UA作為因變量行多元線性回歸分析。根據Pearson相關性分析結果,取年齡、WC、BMI、SBP、DBP、TG、TC、LDL-C、FPG、2h-PPG、HDL-C及LAP作為自變量。結果顯示:LAP、SBP和HDL-C進入回歸模型(LAP:標準回歸系數=0.306,P=0.010;SBP:標準回歸系數=0.189,P<0.001;HDL-C:標準回歸系數=–0.185,P=0.014),表明校正年齡等其他混雜因素后,LAP、SBP和HDL-C對UA的變化具有影響。
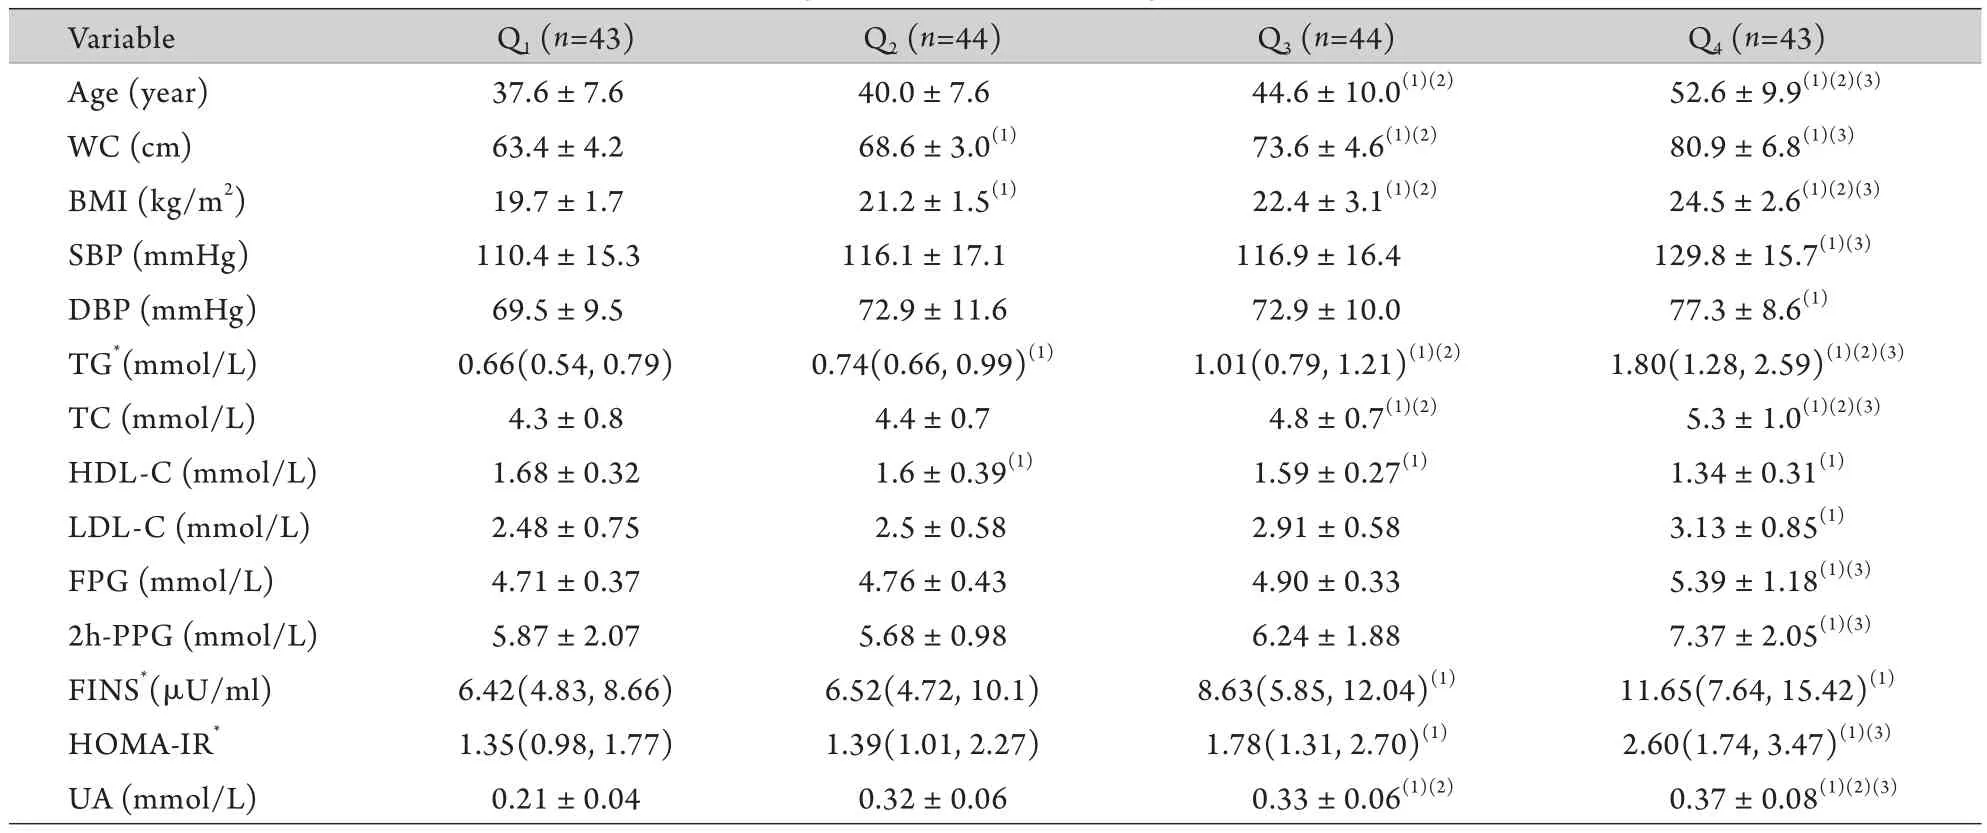
表2 LAP四分位數間的變量比較Tab.2 Comparison of variables in quartiles of LAP
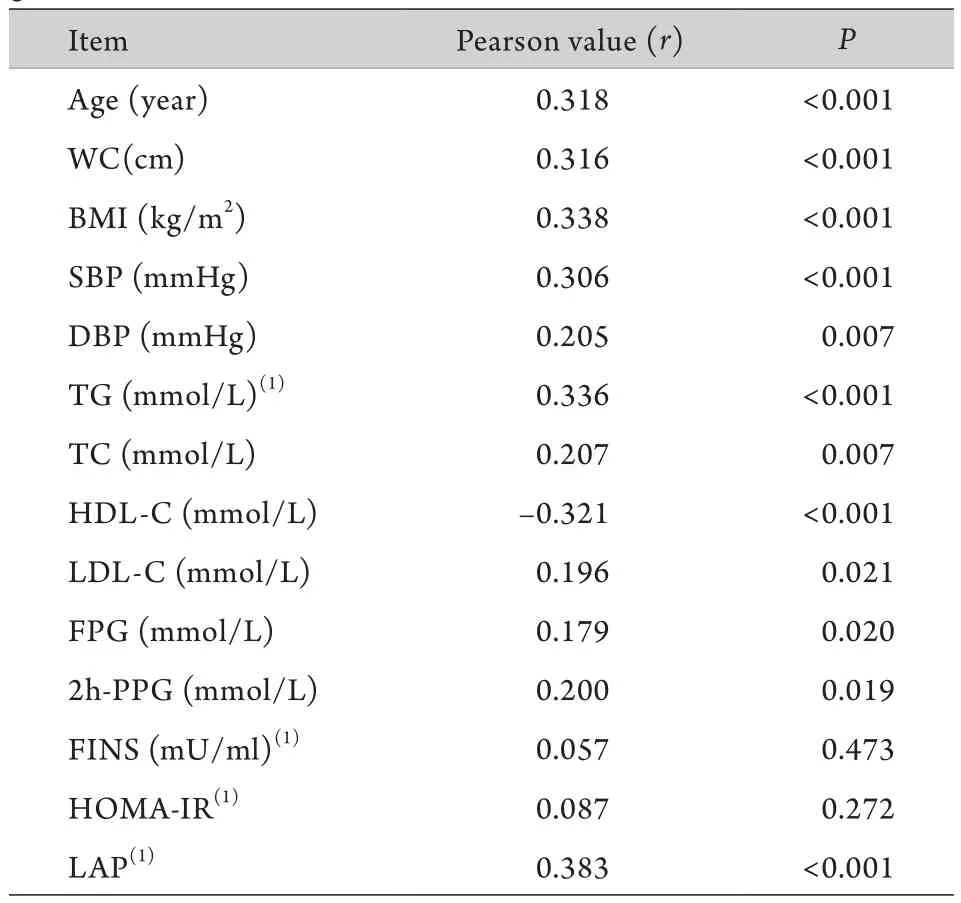
表3 UA與各變量的相關性Tab.3 Correlation between UA and different variables by gender differences
2.4 Logistic回歸分析 運用logistic回歸分析LAP上四分位數(LAP≥20.2)研究對象相比LAP下四分位數(LAP<20.2)研究對象發生高尿酸血癥風險的比值比。結果顯示,LAP上四分位者發生高尿酸血癥風險是其他人的9.25倍(OR=9.25,95%CI 1.39~10.50,P<0.001)。校正年齡、WC、BMI、SBP、DBP、TG、TC、HDL-C、FINS、HOMA-IR這些混雜影響因素后,其風險比值比仍有2.02倍(OR=2.02,95%CI 0.30~5.91,P=0.045)。
2.5 R O C曲線分析 根據L A P的公式和多元線性回歸分析結果,運用R O C曲線觀察L A P、W C、B M I、TG和S B P對高尿酸血癥的預測能力。結果顯示:各指標的R O C曲線下面積(AUC)分別為:WC(0.55±0.17,95%CI 0.22~0.88),BMI(0.60±0.17,95%CI 0.28~0.92),SBP(0.60±0.13,95%CI 0.34~0.86),L A P(0.8 6±0.0 6,9 5%C I 0.7 5~0.9 8),TG(0.74±0.04,95%CI 0.56~0.92),該結果提示LAP較WC、BMI、TG、SBP對高尿酸血癥有更好的預測作用。
3 討 論
人體尿酸水平存在明顯的性別差異,在年輕個體中女性尿酸水平往往較男性低,但隨著年齡的增長,這種差異變得越來越小,特別是絕經后女性的尿酸水平與男性相比并無明顯差異[12]。本研究中女性高尿酸血癥的患病率為6.3%,而既往研究顯示重慶地區女性高尿酸血癥的患病率約為12.7%,存在這樣的差異可能與調查人群的年齡分布有關,本研究的研究對象年齡43.4±10.6(平均年齡43)歲。有Meta分析研究顯示中國西部地區40~50歲年齡段女性高尿酸血癥的患病率約為7.5%[13]。近年來,人們對高尿酸血癥的認識不再局限于其可以引起痛風,越來越多的研究顯示,它與高血壓、動脈粥樣硬化、心血管疾病、慢性腎病等同樣存在密切的聯系[14]。尿酸升高可以使血管系統產生氧化應激[15],刺激血管平滑肌增殖,導致高血壓、纖維化和腎損害等功能紊亂[16]。此外,高尿酸血癥與代謝綜合征各種代謝異常(腹型肥胖,血脂、血糖異常等)的密切關系也受到人們的關注,并且這種聯系在女性人群中更為明顯[2]。肥胖人群較正常體重人群更易患高尿酸血癥,因此反映肥胖的各項指標可作為高尿酸血癥的重要風險因素,有助于臨床更及時的關注血尿酸的異常。
我們的研究同樣發現肥胖指標BMI、WC與高尿酸血癥有密切的關系,但LAP與高尿酸血癥的關系更為明顯。多元線性回歸分析結果顯示,LAP相較BMI、WC對UA的影響更明顯。Logistic回歸分析結果顯示,在校正各種混雜影響因素后高LAP研究對象比低LAP者發生高尿酸血癥的風險更高。此外,ROC曲線分析也提示LAP對高尿酸血癥有更好的預測作用。BMI和WC是反映肥胖的較好指標,但它們都存在一定的不足。BMI只能反映體重的增加,WC雖然可以反映腹型肥胖,但不能很好地反映脂肪在內臟積聚。研究顯示高甘油三酯血癥通常伴隨著TG在肌肉和肝臟的沉積,可以更好地反映內臟脂肪的積聚[17]。LAP結合WC、TG兩項指標可以很好地反映中心性肥胖的脂質聚集。LAP與高尿酸血癥存在明顯的關系,一方面是因為WC與胰島素抵抗關系密切,胰島素抵抗和瘦素水平增加可以減少腎臟對尿酸的排泄而升高血清中尿酸的濃度[18],另一方面是因為肝臟中TG的合成與嘌呤的從頭合成途徑密切相關,從而促進尿酸的形成并產生高尿酸[19]。
我們的研究結果也顯示SBP是高尿酸血癥發生的一個重要危險因素。但高血壓與高尿酸血癥之間的因果關系并不清楚,一些研究顯示高尿酸可能會導致高血壓,而另外也有研究顯示高血壓是高尿酸血癥發生的危險因素。既往有研究表明未治療的高血壓患者25%~60%伴隨著尿酸的升高[20]。高血壓導致高尿酸發生的潛在機制可能是高血壓增加了腎血管阻力減少腎臟血流,增加了尿酸的重吸收[21]。另一方面,各種研究也顯示高尿酸血癥獨立于其他危險因素,可以增加高血壓5年發病的相對風險[22]。尿酸升高導致血壓升高的潛在機制可能與腎臟微血管損傷、內皮功能紊亂及腎素-血管緊張素系統激活有關[23]。此外,既往研究提示HDL-C與血尿酸水平呈負相關關系[4],本研究也觀察到同樣的結果,提示HDL-C對高尿酸血癥很可能是一個保護性因素。
既往各種研究提示LAP是評估心血管疾病和糖尿病風險的有效指標。Kahn[24]的研究發現,LAP對代謝綜合征的識別作用超過BMI和WC,對心血管風險和糖尿病的識別作用超過BMI。在多囊卵巢綜合征患者中LAP與HOMA-IR呈明顯正相關,但LAP 比BMI和WC更能預測胰島素抵抗的發生[25],而在非糖尿病正常人群中LAP也是認識胰島素抵抗的有力指標[26]。此外,隨訪一個為期6年的前瞻性研究也發現LAP較BMI對糖尿病有更好的預測作用[8]。本研究則發現,在成年女性中LAP與高尿酸血癥也存在密切的關系,其相關性超過BMI和WC。
[1]Billiet L,Doaty S,Katz JD,et al. Review of hyperuricemia as new marker for metabolic syndrome[J]. ISRN Rheumatol,2014,doi: 10.1155/2014/852954.
[2]C h i o u W K,Wa n g M H,Hu a n g D H,e t a l. T h e relationship between serum uric acid level and metabolic syndrome:differences by sex and age in Taiwanese[J]. J Epidemiol,2010,20(3): 219-224.
[3]St?ckl D,D?ring A,Thorand B,et al. Reproductive factors and serum uric acid levels in females from the general population: the KORA F4 study[J]. PLoS One,2012,7(3): e32668.
[4]Jin M,Yang F,Yang I,et al. Uric acid,hyperuricemia and vascular diseases[J]. Front Biosci (Landmark Ed),2012,17: 656-669.
[5]Ma HY,Zhu MC,Quan SZ,et al. Analysis of risk factors related with hyperuricemia in aviators[J]. Med J Chin PLA,2012,37(1): 73-75. [馬紅雨,朱美財,全首禎,等. 飛行員高尿酸血癥調查及危險因素分析[J]. 解放軍醫學雜志,2012,37(1): 73-75.]
[6]Choi HK,Atkinson K,Karlson EW,et al. Obesity,weight change,hypertension,diuretic use,and risk of gout in men: the health professionals follow-up study[J]. Arch Intern Med,2005,165(7): 742-748.
[7]Kahn HS. The "lipid accumulation product" performs better than the body mass index for recognizing cardiovascular risk: a population-based comparison[J]. BMC Cardiovasc Disord,2005,5: 26.
[8]Bozorgmanesh M,Hadaegh F,Azizi F. Diabetes prediction,lipid accumulation product,and adiposity measures; 6-year followup:Tehran lipid and glucose study[J]. Lipids Health Dis,2010,doi: 10.1186/1476-511X-9-45.
[9]Chinese Rheumatology Association. Chinese guidelines ondiagnosis and treatment of Primary gout[J]. Chin J Rheumatol,2011,15(6): 410-413. [中國風濕病學學會. 中國原發性痛風診治指南[J]. 中華風濕病學雜志,2011,15(6): 410-413.]
[10] Alberti KG,Zimmet P,Shaw J,et al. The metabolic syndrome --a new worldwide definition[J]. Lancet,2005,366(9491): 1059-1062.
[11] Joint committee for Developing Chinese guidelines on Prevention and Treatment of Dyslipidemia in Adults. Chinese guidelines on prevention and treatment of dyslipidemia in adults[J]. Chin J Cardiol,2007,35(5): 390-419.[中國成人血脂異常防治指南制訂聯合委員會. 中國成人血脂異常防治指南[J]. 中華心血管病雜志,2007,35(5): 390-419.]
[12] Hak AE,Choi HK. Menopause,postmenopausal hormone use and serum uric acid levels in US women--the Third National Health and Nutrition Examination Survey[J]. Arthritis Res Ther,2008,10(5): R116.
[13] Liu B,Wang T,Zhao HN,et al. The prevalence of hyperuricemia in China: a meta-analysis[J]. BMC Public Health,2011,11: 832.
[14] Liu JL,Teng JF. Relations between stability of carotid atherosclerosis plaques and blood C-reactive protein and uric acid levels in cerebral infarction patients[J]. J Zhengzhou Univ(Med Sci),2010,45(4): 609-612. [劉金玲,滕軍放. 腦梗死患者頸動脈粥樣硬化斑塊穩定性與血C-反應蛋白、尿酸水平的關系[J]. 鄭州大學學報(醫學版),2010,45(4): 609-612.]
[15] Corry DB,Eslami P,Yamamoto K,et al. Uric acid stimulates vascular smooth muscle cell proliferation and oxidative stressviathe vascular renin-angiotensin system[J]. J Hypertens,2008,26(2): 269-275.
[16] Mazzali M,Hughes J,Kim YG,et al. Elevated uric acid increases blood pressure in the rat by a novel crystal-independent mechanism[J]. Hypertension,2001,38(5): 1101-1106.
[17] Després JP,Cartier A,Cōté M,et al. The concept of cardiometabolic risk: Bridging the fields of diabetology and cardiology[J]. Ann Med,2008,40(7): 514-523.
[18] Choi HK,Atkinson K,Karlson EW,et al. Obesity,weight change,hypertension,diuretic use,and risk of gout in men: the health professionals follow-up study[J]. Arch Intern Med,2005,165(7): 742-748.
[19] de Oliveira EP,Burini RC. High plasma uric acid concentration: causes and consequences[J]. Diabetol Metab Syndr,2012,4: 12.
[20] Feig DI,Kang DH,Johnson RJ. Uric acid and cardiovascular risk[J]. N Engl J Med,2008,359(17): 1811-1821.
[21] Messerli FH,Frohlich ED,Dreslinski GR,et al. Serum uric acid in essential hypertension: an indicator of renal vascular involvement[J]. Ann Intern Med,1980,93(6): 817-821.
[22] Perlstein TS,Gumieniak O,Williams GH,et al. Uric acid and the development of hypertension: the Normative Aging Study[J]. Hypertension,2006,48(6): 1031-1036.
[23] Sánchez-Lozada LG,Tapia E,López-Molina R,et al. Effects of acute and chronic L-arginine treatment in experimental hyperuricemia[J]. Am J Physiol Renal Physiol,2007,292(4): F1238-F1244.
[24] Kahn HS. The lipid accumulation product is better than BMI for identifying diabetes: a population-based comparison[J]. Diabetes Care,2006,29(1): 151-153.
[25] Wiltgen D,Benedetto IG,Mastella LS,et al. Lipid accumulation product index: a reliable marker of cardiovascular risk in polycystic ovary syndrome[J]. Hum Reprod,2009,24(7): 1726-1731.
[26] Xia C,Li R,Zhang S,et al. Lipid accumulation product is a powerful index for recognizing insulin resistance in non-diabetic individuals[J]. Eur J Clin Nutr,2012,66(9): 1035-1038.
Correlation between lipid accumulation index and hyperuricemia in adult females
GUI Ling-sheng,LI Rong*,YANG Lei,DUAN Feng-yi,LI Dai,GONG Li-lin,ZhANG Su-hua
Department of Endocrinology,First Affiliated Hospital of Chongqing Medical University,Chongqing 400016,China
*< class="emphasis_italic">Corresponding author,E-mail: rong.li.cq@gmail.com
,E-mail: rong.li.cq@gmail.com
This work was supported by the National Natural Science Foundation of China (81200588),the Natural Science Fund Project of Chongqing Science and Technology Committee (09BB5076),and the National Key Clinical Specialties Construction Program of China (2011)
ObjectiveTo explore the relationship between lipid accumulation index (LAI) and hyperuricemia in females.MethodsOne hundred and seventy-four adult females were included in the cross-sectional study from Mar. to Sep. 2006 through a simple random sampling from a group of population subjected to routine physical examination in the Luohuang Community of Chongqing municipality. The anthropometric measurements,blood pressure (BP),uric acid (UA),lipid profile,glucose and insulin levels were measured. Lipid accumulation product (LAP),body mass index (BMI) and the homeostasis model assessment of insulin resistance (HOMA-IR) were calculated. Subjects were divided into normal group and hyperuricemia group based on their UA levels,and an independent-samplesttest was performed for comparison between the two groups; one-factor analysis of variance was performed for multiple comparisons. The Student-Newman-Keuls test was performed for homogeneity of variance. The relationship between UA and other variables was analyzed by Pearson correlation analysis and multiple linear stepwise regression analysis. Logistic regression analysis was used to determine the odds ratio of hyperuricemia in the highest quartile of LAP level. The analysis of the areas under the receiver operating characteristic (ROC) curves was performed to identify the predictive ability of relevantvariables to hyperuricemia.ResultsCompared with normal group,the age,waist circumference (WC),triglyceride (TG),fasting insulin (FINS),HOMA-IR and LAP were higher in hyperuricemia group (P<0.05). The age,and levels of WC,BMI,systolic blood pressure (SBP),diastolic blood pressure (DBP),TG,total cholesterol (TC),low-density lipoprotein cholesterol (LDL-C),fasting glucose (FPG),2-hour postprandial glucose (2h-PPG),FINS,HOMA-IR and UA were higher as LAP increased (P<0.05),whereas the level of high-density lipoprotein cholesterol (HDL-C) lowered as LAP increased (P<0.05). Pearson correlation analysis showed that,UA was positively correlated with age,WC,BMI,SBP,DBP,TG,TC,LDL-C,FPG,2h-PPG and LAP (P<0.05),and negatively with HDL-C (P<0.05). The multiple linear stepwise regression analysis showed that LAP,SBP and HDL-C fit a regression model (LAP: standardized coefficients=0.306,P=0.010; SBP: standardized coefficients=0.189,P<0.001; HDL-C: standardized coefficients= –0.185,P=0.014). Logistic regression analysis demonstrated that the risk of hyperuricemia in the subjects who had the LAP level in the upper quartile (LAP≥20.2) was 2.02 times higher than those in the lower quartiles (OR=2.02; 95%CI 0.30-5.91;P=0.045). LAP showed a high predictive accuracy with an area under the ROC curve of 0.86 (0.86±0.06,95%CI 0.75-0.98).ConclusionLAP is an index reflecting central lipid accumulation that closely associates with hyperuricemia in adult females.
uric acid; hyperuricemia; lipid accumulation index; metabolic syndrome X; hypertension
R589.7
A
0577-7402(2015)12-0993-06
10.11855/j.issn.0577-7402.2015.12.11
2015-01-22;
2015-07-12)
(責任編輯:張小利)
國家自然科學基金(81200588);重慶市科學技術委員會自然科學基金(09BB5076);國家臨床重點專科建設項目(2011)
桂靈升,碩士研究生。主要從事肥胖及內分泌代謝疾病的研究
400016 重慶 重慶醫科大學附屬第一醫院內分泌科(桂靈升、李蓉、楊蕾、段鳳儀、李岱、龔莉琳、張素華)
李蓉,E-mail:rong.li.cq@gmail.com
猜你喜歡
體育科技文獻通報(2022年3期)2022-05-23 13:46:54
天津外國語大學學報(2021年3期)2021-08-13 08:32:18
遼金歷史與考古(2021年0期)2021-07-29 01:06:54
民用飛機設計與研究(2020年4期)2021-01-21 09:15:02
科技傳播(2019年22期)2020-01-14 03:06:54
民用飛機設計與研究(2019年4期)2019-05-21 07:21:24
電子制作(2018年18期)2018-11-14 01:48:24
汽車工程學報(2017年2期)2017-07-05 08:13:02
山東工業技術(2016年15期)2016-12-01 05:31:22
中國中醫藥現代遠程教育(2014年11期)2014-08-08 13:23:44