Diurnal and Seasonal Variations in Particulate Matter at Shanghai during the Heavy Haze and Non-haze Periods
2015-08-07 10:54:14HUANGJiamin黃家敏ZHANGJianying張劍英YANGHonghai楊洪海GENGFuhai耿福海CHENYonghang陳勇航LIHuimin李慧敏YUYang余陽WANGYuhui王宇暉WANGYukun王煜坤
HUANG Jia-min(黃家敏),ZHANG Jian-ying(張劍英),YANG Hong-hai(楊洪海),GENG Fu-hai(耿福海),3*,CHEN Yong-hang(陳勇航),2*,LIHui-min(李慧敏),YU Yang(余陽),WANG Yu-hui(王宇暉),WANG Yu-kun(王煜坤)
1 College of Environmental Science and Engineering,Donghua University,Shanghai201620,China
2 Shanghai Key Laboratory of Atmospheric Particle Pollution Prevention(LAP3),Shanghai200433,China
3 Shanghai Urban Environmental Meteorological Center of Shanghai Meteorological Bureau,Shanghai200135,China
Diurnal and Seasonal Variations in Particulate Matter at Shanghai during the Heavy Haze and Non-haze Periods
HUANG Jia-min(黃家敏)1,ZHANG Jian-ying(張劍英)1,YANG Hong-hai(楊洪海)1,GENG Fu-hai(耿福海)1,3*,CHEN Yong-hang(陳勇航)1,2*,LIHui-min(李慧敏)1,YU Yang(余陽)1,WANG Yu-hui(王宇暉)1,WANG Yu-kun(王煜坤)1
1 College of Environmental Science and Engineering,Donghua University,Shanghai201620,China
2 Shanghai Key Laboratory of Atmospheric Particle Pollution Prevention(LAP3),Shanghai200433,China
3 Shanghai Urban Environmental Meteorological Center of Shanghai Meteorological Bureau,Shanghai200135,China
In order to reveal the diurnal and seasonal variations in particulate mass concentration(PM1,PM2.5,and PM10)during the heavy haze periods and non-haze periods,the statistics based on the data from the Shanghai Urban Environmental M eteorological Center from December 2008 to November 2010 were analyzed.The results were shown as follows.The particulate matter and black carbon(BC)concentrations,especially the fine particulate matter concentrations during the heavy haze were significantly higher than that during the non-haze periods.Overall,the averaged proportion of PM2.5to PM10accounted for 59%during the non-haze periods and 81%during the heavy haze periods while that of PM1to PM10accounted for 43%for the non-haze periods and 70%for the heavy haze periods.Particulate matter concentration had two peaks at 11:00 and 17:00 in a day.The aerosols concentrations were the highest while the seasonal variation of visibility was the lowest in winter,followed successively by spring,autumn,and summer.
Shanghai;PM;black carbon(BC);heavy haze;non-haze
Introduction
According to the“National Environmental Analysis”released recently by the Asian Development Bank and Tsinghua University,99%of China's 500 cities including Shanghai do notmeet the air quality standard recommended by the World Health Organization[1].Shanghai is located in the Yangtze River Delta in eastern China with an area of 6 430 km2,a population of 19.2 million and automobiles over 3 million[2]. During the past two decades,with fast urbanization and economic development,Shanghaihas been seriously affected by haze pollution and its average annual number of haze days exceeding 150[3].The duration of haze will be propitious for the process of atmospheric chemical reaction and generation of chemical hazardous aerosols[4].Haze not only pollutes the environment,reduces visibility and increases traffic hazards but also affects people's physicalandmentalhealth[5].The exposure to high concentration ambient aerosols during haze can lead to respiratory and cardiovascular diseases[6].Therefore,haze pollution gets increasing attention.Current research in haze mainly focuses on its formation[7],related influencing factors[8]and aerosol physical,chemicaland optical properties[9].Studies based on a long time sequence of continuous observed data of PM1,PM2.5,PM10and black carbon(BC)have still rarely been reported.
Aerosol particles which are the main causes of haze formation are usually referring to all kinds of solid and liquid particles suspending in the atmosphere.Particle size ranges generally from 0.001 to tens of m icrons,the shape and composition are complex.Carbon aerosol in the atmosphere is classified to organic carbon(OC)and elemental carbon(EC),and EC is also known as BC because of its strong absorption of light.BC derives from the emissions of amorphous carbon which is caused by the incomplete combustion of carbonaceous material.BC contains a large number of potential toxic substances,which is a big threat to human health and the significantmotive factor that can cause climate warm ing[10].At the same time,BC is a carrier of many atmospheric chemical reactions and catalysts to accelerate the chemical reaction of the atmosphere[11].
Because of different sizes,particles'deposition sites of human respiratory system are different and the harm fulness of the human body is different.The fine aerosol particleswith BC accounted for a larger proportion of particulate matter are providing favorable conditions to form haze than large particles,so they are consideredmore likely to cause environmentproblem and human disease[12].Therefore,in this study,the diurnaland seasonal variations of particulate matter during the heavy haze and the non-haze periods were analyzed to reveal new observational evidences and provide scientific basis for the haze pollution control in Shanghai.
1 Data and Method
According to the new standards[13]issued by the meteorological industry in China,haze is defined as the average visibility is less than 10 km and the average relative humidity is less than 95%,without the occurrence of low-visibility conditions such as precipitation,sandstorm,blow ing sand,dust,smoke,blow ing snow,and snow storm.In this paper,if the average visibility is less than 3 km,it is defined as heavy haze.
The statistical data of haze hours were from the visibility and the relative humidity of the average hourly observation data which was obtained from the M ilos 500 seven elements automaticmonitor(made in Finland).The AE-31 BC analyzer (Aethalometer,Magee Scientific Co,USA)was used to measure the concentration of BC once an hour.The mass concentration of particulatematter was detected by GRIMM 180 online ambient particle detector which could measure PM1,PM2.5,and PM10once an hour at the same time.
In this paper,the data were from the Shanghai Urban Environmental Meteorological Center in Pudong district fromDecember 2008 to November 2010 where is located in eastern Shanghai(31.23°N,121.53°E)without obvious industrial pollution source.Therefore,the results in this paper represented aerosol variation characteristics of living and working environment inmodern city to some extent[14].
2 Results and Discussion
2.1 Distributions of aerosols concentration
Figures 1-3 manifested the frequency distributions of PM10,PM2.5as well as PM1concentrations during the heavy haze periods and the non-haze periods from December 2008 to November 2010 in Shanghai.There were 706 times for heavy haze and 1 326 times for non-haze.The average hourly concentration of PM10,PM2.5,PM1,and BC were classified into several ranges,the frequency in the diagrams were the percentage of occurrence for each range to total times.

Fig.1 Frequency distribution of PM10concentration during the heavy haze periods and the non-haze periods in Shanghai

Fig.2 Frequency distribution of PM2.5concentration during the heavy haze periods and the non-haze periods in Shanghai
PM10wasmainly concentrated in the range of 40-140μg/ m3,especially in the range of 60-100μg/m3during the heavy haze periods,accounting for 37.3%of the sample size(Fig. 1).However,PM10during the non-haze periods was mainly concentrated in the range of 10-60μg/m3and the highest frequency was in the range of 20-30μg/m3.The maximum hourly average concentration of PM10during the heavy haze periodswas 324.5μg/m3,which was 121.6μg/m3more than that during the non-haze periods.In addition,the average concentration of PM10in the total sample during the heavy haze periodswas 106.2μg/m3,which was much higher than that during the non-haze periods.

Fig.3 Distribution of frequency of PM1concentration during the heavy haze periods and the non-haze periods in Shanghai
In Fig.2,PM2.5was mainly concentrated in the range of 40-120μg/m3and appeared most frequently in the range of 60-80μg/m3during the heavy haze periods.In the non-haze periods,PM2.5wasmainly concentrated in the range of 5-30 μg/m3and the highest frequency was in the range of10-15μg/ m3which was about1/6 of that during the heavy haze periods. During the heavy haze periods,the highest hourly average concentration of PM2.5was 206.0μg/m3,and the average value of the total samplewas83.3μg/m3which was three times higher than theWorld Health Organization(WHO)air quality standards.During the non-haze periods,the highest hourly average concentration of PM2.5was 165.6μg/m3which was 40.4μg/m3less than that during the heavy haze periods and the average value of the total sample was 17.6μg/m3which was 65.7μg/m3less than that during the heavy haze periods.
As Fig.3 showed,PM1was mainly concentrated in the range of 40-100μg/m3and occurred most frequently in the range of 40-80μg/m3during the heavy haze periods.In the non-haze periods,PM1wasmainly concentrated in the range of 0-15μg/m3and the highest frequency was in the range of 5-10μg/m3which was nearly 1/8 of that during the heavy haze periods.During the non-haze periods,the maximum hourly average concentration of PM1was 147.7μg/m3which was 43.8μg/m3less than thatduring the heavy haze periods and the average value of the total sample was 13.1μg/m3which was 58.5μg/m3less than that during the heavy haze periods.
Figure 4 showed the frequency distribution of BC concentration in Shanghaiduring the heavy haze periods and the non-haze periods.BC wasmainly concentrated in the range of 3-8μg/m3,and it occurred most frequently in the range of 4-5μg/m3during the heavy haze periods.It was mainly concentrated in the range of 0-3μg/m3in the non-haze periods and occurred most frequently in the range of 1-2μg/m3,accounting for 55.7%of the sample size.During the heavy haze periods,maximum hourly average concentration of BCwas 26.2μg/m3which was 3.5μg/m3more than that during the non-haze periods and the average value of the total sample was 7.5μg/m3which was 5.6μg/m3more than that during the non-haze periods.
Figures 5 and 6 respectively showed the frequency distributions of proportion of PM2.5to PM10and PM1to PM10in Shanghai during the heavy haze periods and the non-haze periods.PM2.5accounted for 50%to 65%(average 59%)of PM10during the non-haze periodsbut75%to 95%(average81%)during the heavy haze periods.In addition,PM1accounted for about20%to 55%(average 43%)of PM10during the nonhaze periods and 65%to 90%(average70%)during the heavy haze periods.It indicated that when the heavy haze occurred,atmospheric aerosolsweremainly composed of fine particles.

Fig.4 Frequency distribution of BC during the heavy haze periods and the non-haze periods in Shanghai
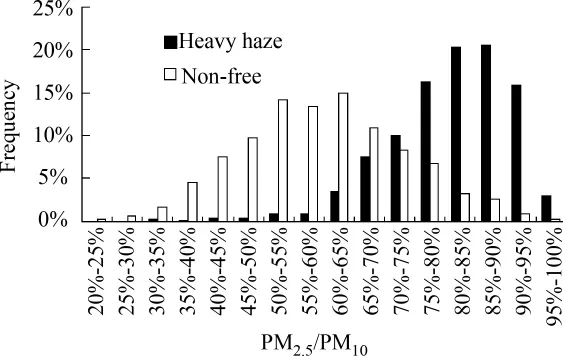
Fig.5 Frequency distribution of PM2.5/PM10concentration during the heavy haze periods and the non-haze periods in Shanghai

Fig.6 Frequency distribution of PM1/PM10concentration during theheavy haze periods and the non-haze periods in Shanghai
2.2 Diurnal variation of aerosols concentration
The hourly aerosolsmass concentration were averaged from 8:00 to 18:00 during the heavy haze and non-haze periods.The sample sizes of each hour were shown in Table 1.From Fig.7,the highest concentration of particulate matter was occurred at 8:00 during the non-haze periods.PM10,PM2.5and PM1hourly average concentration reached maxima of 45.5μg/m3,30μg/ m3and 23.7μg/m3,respectively.In Fig.8,particulatematter concentration had two peaks at 11:00 and 17:00 during the heavy haze periods.PM10,PM2.5and PM1hourly average concentration reached maxima of 107.7μg/m3,85.7μg/m3,and 73.6μg/m3,respectively.This phenomenon was related to the rush hours which the exhaust emission from motor vehicles was high in themorning and the early evening.
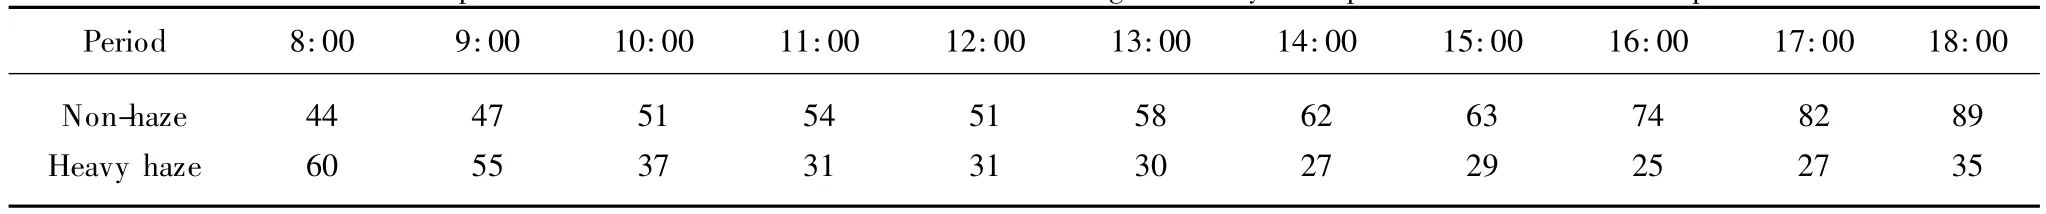
Table 1 Sample sizes of each hour from 8:00 to 18:00 during the heavy haze periods and the non-haze periods

Fig.7 Diurnal variation of aerosols concentration during the non-haze periods in Shanghai
2.3 Seasonal variations of aerosols concentration

Fig.8 Diurnal variation of aerosols concentration during the heavy haze periods in Shanghai
The seasonal variations of aerosols concentration among the heavy haze periods and the non-haze periods in Shanghai were shown in Figs.9 and 10.The visibility value and concentration value of PM10,PM2.5,and PM1for same season were averaged.The sample sizes of each season were shown in Table 2.During the non-haze periods,the aerosols concentration was the highest in w inter followed by autumn,spring,and summer while the visibility varied in the opposite order.During theheavy haze periods,the aerosols concentration was the highest in w inter followed by spring,autumn,and summer while the visibility varied in the opposite order.It indicated that in autumn and spring,the particulatematter had aweaker effecton visibility,so itwas less prone to the heavy haze.
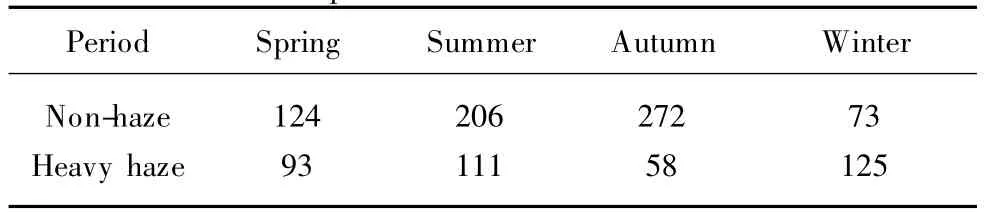
Table 2 Sample sizes of each season during the heavy haze periods and the non-haze periods

Fig.9 Seasonal variations of aerosols concentration during the non-haze periods in Shanghai

Fig.10 Seasonal variations of aerosols concentration during the heavy haze periods in Shanghai
3 Conclusions
Themain results in this study are summarized as follows.
(1)When the heavy haze occurred,the particulatematter concentrations of PM10,PM2.5,and PM1were significantly higher than those of the non-haze periods,especially that of the fine particulatematter.PM2.5and PM1concentration during the heavy haze periods were approximately 6 and 8 times asmuch as those during the non-haze periods.When PM2.5and PM1concentrations were higher than 40μg/m3,it is easier to form haze.
(2)During the heavy haze periods,BC was mainly concentrated in the range of 3-8μg/m3,and it occurred the most frequently in the range of 4-5μg/m3.During the nonhaze periods,BC was mainly concentrated in the range of 0-3μg/m3and it occurred themost frequently in the range of 1-2μg/m3.
(3)The concentrations of fine particles(PM1and PM2.5) played a significant part in the heavy haze.When the heavy haze occurred,the proportion of PM2.5to PM10rose from 59% to 81%while the proportion of PM1to PM10rose from 43%to 70%.
(4)During the non-haze periods,the concentration of particulatematter was the highest at 8:00,decreased gradually after 8:00,and rose near 18:00.During the heavy haze periods,particulate matter concentration had two peaks of concentration at11:00 and 17:00.
(5)During the non-haze periods,the aerosols concentration was the highest in w inter followed by autumn,spring,and summer while the visibility varied in the opposite order.During the heavy haze periods,the aerosols concentration was highest in w inter followed by spring,autumn and summer while the visibility varied in the opposite order.
[1]Staedter T.7 of 10 Most Air-Polluted Cities Are in China[DB/ OL].(2013-01-16)[2014-03-10].http://news.discovery. com/earth/weather-extreme-events/7-of-10-most-air-pollutedcities-china-130116.htm.
[2]Liu Q,Geng F H,Chen Y H,et al.Vertical Distribution of Aerosols during Different Intense Dry Haze Periods around Shanghai[J].China Environmental Science,2012,32(2):207-213.(in Chinese)
[3]Zieliński T,Zieliński A.Aerosols Extinction and AerosolsOptical Thickness in the Atmosphere over the Baltic Sea Determined with Lidar[J].Journal of Aerosols Science,2002,33(6):907-921.
[4]Wu D.Formation and Evolution of Haze Weather[J]. Environmental Science and Technology,2011,34(3):157-161. (in Chinese)
[5]Chen Y H,Liu Q,Geng F H,et al.Vertical Distribution of Optical and M icro-physical Properties of Ambient Aerosols during Dry Haze Periods in Shanghai[J].Atmospheric Environment,2012,50:50-59.
[6]Wu D.Distinction between Haze and Fog in Urban Metropolitans and Haze Weather Warnings[J].Environmental Science and Technology,2008,31(9):1-7.(in Chinese)
[7]Wang Y,Zhuang G S,Sun Y L,et al.The Variation of Characteristics and Formation Mechanisms of Aerosols in Dust,Haze,and Clear Days in Beijing[J].Atmospheric Environment,2006,40(34):6579-6591.
[8]Hu R Z,Liu H N,Zhang M G,et al.Simulation of Brownish Haze in Urban A reas of Nanjing[J].Acta Scientiae Circunstantiae,2009,29(4):808-814.(in Chinese)
[9]Lee K H,Kim Y J,Kim M J.Characteristics of Aerosol Observed during Two Severe Haze Events over Korea in June and October 2004[J].Atmospheric Environment,2006,40(27): 5146-5155.
[10]Gatari M J,Boman J.Black Carbon and Total Carbon Measurements at Urban and Rural Sites in Kenya,East Africa[J].Atmospheric Environment,2003,37(8):1149-1154.
[11]Geng F H,Hua J,Mu Z,et al.Differentiating the Associations of Black Carbon and Fine Particle with Daily Mortality in a Chinese City[J].Environmental Research,2013,120:27-32.
[12]Chen R J,Wang X,Meng X.Communicating Air Pollution-Related Health Risks to the Public:an Application of the Air Quality Health Index in Shanghai,China[J].Environment International,2013,51:168-173.
[13]QX/T113-2010,Meteorological Industry Standard of the People's Republic of China[S].Beijing:China Meteorological Press,2010.(in Chinese)
[14]Gao W,He Q S,Pan W W,et al.Observation of Dry Aerosol Optical Properties in Shanghai[C].The 29th China Meteorological Society Annual Conference,Shenyang,China,2012.(in Chinese)
X513
A
1672-5220(2015)04-0677-04
date:2014-05-22
s:National Basic Research Program of China(No.2011CB403405);Program of Science and Technology Development of Hangzhou,China(No.20120433B18);National Natural Science Foundation of China(Nos.51309053,41175026,40975012);Opening Project of Shanghai Key Laboratory of Atmospheric Particle Pollution Prevention(LAP3),China
*Correspondence should be addressed to GENG Fu-haiand CHEN Yong-hang,E-mail:fuhaigeng@263.net;yonghangchen@dhu.edu.cn
登錄APP查看全文
 Journal of Donghua University(English Edition)
2015年4期
Journal of Donghua University(English Edition)
2015年4期
- Journal of Donghua University(English Edition)的其它文章
- Empirical Analysis of Binary Logistic Model for the Influencing Factors of the Chinese Urban and Rural Residents'Woolen Products Consumption—Based on Questionnaires of 513 Urban and Rural Residents in 16 Provinces
- Analysis of Satisfaction with Business Cost in Shanghai Using Structural Equation Modeling Approach
- Ontology Mapping Based on Bayesian Network
- Swept-Volume Display System Based on Cylindrical Space Projection and Curved Reflectors
- Existence of Solutions for Infinity-Point Nonlinear Fractional Boundary Value Problem at Resonance
- Human Mouth-State Recognition Based on Image Warping and Sparse Representation Combined with Homotopy