Status Quo of China’s Textile Machinery Industry (Jan.–May,2015)
2015-10-30 04:54:35ByZhaoZihan
China Textile 2015年9期
By+Zhao+Zihan
Main indicators of the industry
Scale of the industry
From January to May of 2015, textile machinery industry realized main business income of 45.3739 billion yuan, an increase of 0.77% year on year. The assets amounted to 97.103 billion yuan with a year-on-year increase of 4.44%.
Cost structures
During the first five months of the year, the textile machinery industry saw a total cost of 42.595 billion yuan, an increase of 1.08% year on year. Among them, the main business cost saw a year-on-year growth of 1.38% to 38.388 billion yuan which accounted for 90.12 % of the total costs; the operating expenses decreased 5.95% year on year to 1.231 billion yuan which accounted for 2.89% of the total; the administrative expenses rose 0.03% year on year to 2.450 billion yuan which accounted for 5.75% of the total; the finance costs increased 1.75% year on year to 525 million yuan, accounting for 1.23% of the total.
Profitability
In the first five months of 2015, the textile machinery industry achieved total profits of 2.766 billion yuan with a year-on-year dropping of 0.825. The losses of loss-making enterprises in this industry increased 48.90% year on year to 386 million yuan. The percentage of businesses suffering losses of the industry reached 17.09%.
Investment
In this period, the investment into the fixed assets of the textile machinery industry saw an increase of 0.66% year on year to 10.643 billion yuan which accounted for 2.70% of that in the entire textile industry. There were 153 new projects in the textile machinery industry in the first three months of the year, a year-on-year falling of 8.93%.
Operation in key areas of textile machinery industry
The following charts (Tables 1-5) show how the textile machinery industry was affected by its scale, revenue, profits, export delivery value, total costs, etc. in Jiangsu, Shandong, Zhejiang and other provinces that are mainly contributing to the manufacturing of textile machinery in China.
Imports and exports of textile machinery products
According to the statistics of Chinese Customs, from January to May of 2015, Chinas total imports and exports of textile machinery amounted to 2.503 billion USD, down by 18.63% year on year. Among them, textile machinery saw exports of 1.303 billion USD, an increase of 8.28% year on year; imports of 1.2 billion USD, a dropping of 35.92% year on year. Chart 6 reflects the imports and exports of Chinas textile machinery. (Table 6)
Import summary of textile machinery products
During the first five months of the year, total imports of textile machinery from 56 countries and regions amounted to 1.2 billion USD, down by 35.92% year on year.
Imports of textile machinery products
According to different categories of imported products, the imports of chemical fiber textile machinery ranked the first with total imports of 248 million USD, down by 49.98% year on year, which accounted for 20.66% of total imports. The imports of all seven categories showed a decrease in imports, while the declining of chemical fiber, weaving, and non-woven fabric machinery was higher than the average of the industry. The specific is shown in Table 7.
Major countries and regions for Chinas imports of textile machinery
In the first five months of the year, Chinas imports of textile machinery were mainly from such countries and regions as Germany, Japan, Italy, Chinese Taiwan and Belgium. The total trade value of the top five countries and regions amounted to 979 million USD, down by 38.33%, accounting for 81.85% of total import value. The major overview is referred to Table 8.
Imports of textile machinery from Germany were in the first place, and the imports amounted to 521 million USD, decreasing 18.52% year on year. Among them, the chemical fiber machinery saw a trade value of 194 million USD with a yearon-year decrease of 29.66%. The weaving machinery imports saw the largest increase of 62.88% year on year while the non-woven fabric machinery showed the biggest decrease of 52.65% year on year.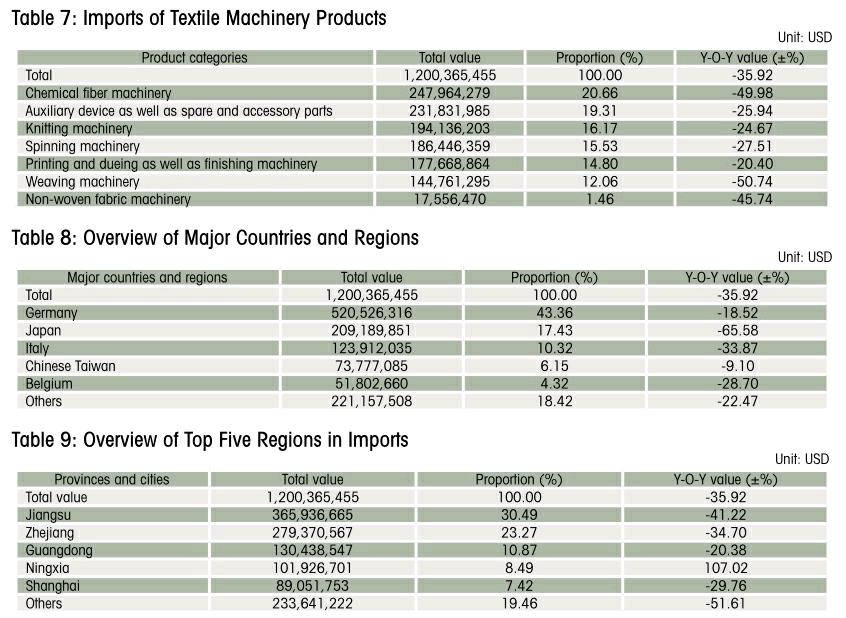
Overview of import regions in China
From January to May this year, the countrys 29 provinces and autonomous regions have a different number of imports. Jiangsu, Zhejiang, Guangdong, Ningxia and Fujian ranked the top five in terms of total import value, accounting for 80.54% of the total. (Table 9)
Jiangsu Province ranked first with total import value of 366 million USD, down by 41.22% year on year, accounting for 30.49%. However, Ningxia saw a jumping of 107.02% year on year to 102 million USD, while the spinning machinery saw imports of 68.5265 million USD with a high rocketing of 166.65%, accounting for 67.23%. Table 9 reflects the situation of imported textile top five provinces.
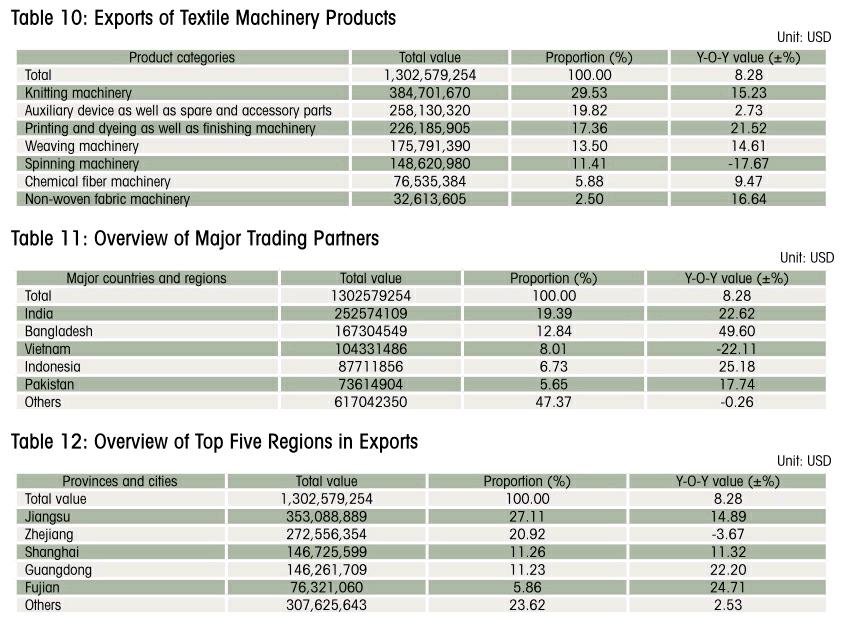
Export summary of textile machinery products
During the first five months of the year, total exports of textile machinery in China amounted to 1.303 billion USD, up by 8.28% year on year.
Exports of textile machinery products
The exports of textile machinery products in terms of different categories from January to May this year were shown in Table 10, which is from China Customs.
The knitting machinery enjoyed the first place in exports with a value of 385 million USD, a yearon-year rising of 15.23%, which was followed by auxiliary device as well as spare and accessory parts, printing and dyeing as well as finishing machinery, weaving, spinning machinery, chemical fiber machinery, and non-woven fabric machinery in sequence. Only spinning machinery saw a negative growth in exports.
Major trading partners in exports
During the first five months of 2015, Chinas textile machinery were exported to 162 countries and regions in all, and the top five ones are shown in Table 11.
Table 11 shows that from January to May of 20153, Chinas textile machinery exports in the top five ones accounted for 52.63%. Exports to India amounted to 253 million USD, an increase of 22.62% year on year, accounting for 19.39% of total exports.
Overview of export regions in China
From January to May this year, the countrys 31 provinces and autonomous regions have a different number of exports. In terms of total import value, the top five accounted for 76.38% of the total (Table 12).
In summary, under the complex and volatile economic environment, the enterprises are still facing great production and operation downward pressures as well as hard progress of industrial upgrading and structure adjustment difficulties. In particular the spinning machinery market is concentrated in the spinning project in Xinjiang from the major manufacturers of complete sets of equipment, and besides that, the other host machine manufacturing enterprises are suffering poor sales. The enterprises engaged in production of auxiliary device as well as basic spare and accessory parts are slightly better than those focusing on the host machine. It is expected to improve somewhat in the second half.