Fatigue Reliability Analyses Considering Short Crack and Dwell Time Effects
2016-05-16 06:16:03,,
船舶力學 2016年6期
,,
(1.China Ship Scientific Research Center,Wuxi 214082;2.Shanghai Engineering Research Center of Hadal Scicence and Technology,College of Marine Sciences,Shanghai Ocean University,Shanghai 201306,China;3.State Key Laboratory of Deep-sea Manned Vehicle,China Ship Scientific Research Center,Wuxi 214082,China)
Fatigue Reliability Analyses Considering Short Crack and Dwell Time Effects
WANG Ying-ying1,3,WANG Fang2,CUI Wei-cheng2
(1.China Ship Scientific Research Center,Wuxi 214082;2.Shanghai Engineering Research Center of Hadal Scicence and Technology,College of Marine Sciences,Shanghai Ocean University,Shanghai 201306,China;3.State Key Laboratory of Deep-sea Manned Vehicle,China Ship Scientific Research Center,Wuxi 214082,China)
Proper fatigue life prediction is important for the deep-sea manned cabin made of high strength metal.In real practice,many uncertainties both intrinsic and extrinsic properties affect the fatigue behavior of the manned cabin.In the former research,the fatigue reliability analysis was conducted based on a unified crack growth rate model,to provide a basis for fatigue life prediction of manned cabin.However,it could not consider the short crack effect and dwell time effect,both of which are essential in structure and load characteristics of manned cabin,and should be studied further.In this paper,a short crack growth rate model and two kinds of dwell fatigue crack growth rate models newly proposed by the authors’group aiming to better describe the dwell-fatigue behavior of the titanium alloys,will be analyzed combined with different reliability analysis methods.The difference of several fatigue analysis methods as well as how the input variables and the crack growth models affect the structural fatigue reliability will be analyzed and demonstrated.
uncertainty;fatigue reliability analysis;crack growth rate model
0 Introduction
Fatigue is the most common failure mechanism of metal structures under cyclic loads.It is reported that about 80%-90%of all observed structural or mechanical damages are due to fatigue[1],causing much socio-economic loss.The deep-sea manned cabin will be confronted with the fatigue problems.Considering the particularity of safety requirements to manned cabin and its working conditions,it is necessary to assess its fatigue performance.
Lots of research efforts have been made to figure out the physical mechanism of metal fatigue as well as predicting the fatigue behavior of metal in the several decades past.An overview of cumulative fatigue damage(CFD)models can be found in Fatemi(1998)[2],and another detailed overview about two main fatigue life prediction catagories(CFD&FCP)canbe seen in Cui(2002)[3],in which the fatigue crack growth models are all deterministic.Recently,a short crack growth model[4]and two dwell crack growth models for the titanium alloys[4-5]have been proposed,also deterministic.In practice,there are always uncertainties caused by both intrinsic and extrinsic properties in structures which will influence the fatigue life prediction.In deterministic analysis,a main measure of handling these uncertainties to ensure the safety of structures is to employ a general safety factor[6],but it is unable to account for the uncertainties physically,thus it is better to assess the fatigue life probabilistically[7].
In this paper,the authors overviewed several reliability analysis methods first,and then made effort to apply those methods to the structural fatigue assessments based on the newly proposed crack growth models considering short crack effect and dwell time effect,and the statistical properties of the data were assumed to demonstrate the procedure.
1 Fatigue reliability analysis methods
Fatigue reliability analysis is the most common measure to accommodate uncertainties existing in structures[7],trying to ensure that the occasions leading to catastrophe are extremely unlikely for a given targeted probability of failure[8].
When crack growth method is applied in fatigue reliability analysis,the effects of uncertainties can exist in crack growth prediction,causing scatters in fatigue life.It is essential to accurately represent uncertainties for safe and efficient decisions[6].Haldar&Mahadevan[9]introduced the modeling of uncertainties,the commonly used probability distributions,and the procedure to determine statistical properties according to observed data.Several commonly used types of distribution are normal distribution,lognormal distribution,Weibull distribution or shifted Rayleigh distribution,extreme value distribution,etc.When fatigue reliability analyses are carried out in engineering structures,there are several commonly used analysis methods which are described as follows.
1.1 Monte Carlo Simulation(MCS)
MCS is convenient to assess failure probability based on the large number law.A key step in MCS is generating variables that follow specified probability distributions[6].If N is very large, the failure probability can be calculated through


MCS is feasible for whatever types of distributions and whatever forms of constraint functions[10]without being restricted by either nonlinear approximation or equivalent normalization, which enables the results of MCS to be a guidance for the fatigue reliability analyses.However,the failure probability is usually so small in reality industry that MCS will cost too muchtime.Although more effective sampling methods have been developed,sometimes it can be too expensive and/or time-consuming,as a result,other methods were developed to be alternatives.
1.2 First Order Reliability Method(FORM)
FORM is the most commonly used reliability index method,and the most popular FORM is the Most Probable Point(MPP)method.The MPP method is originally to be developed for the normal distributed variables.The MPP method is also nominated as JC method,and the MPP is the point defined in the normal space,the distance from the origin to which is the shortest.This very shortest distance is nominated as reliability index,written as β[11].
The MPP u*can be searched through the formulas below[12]:
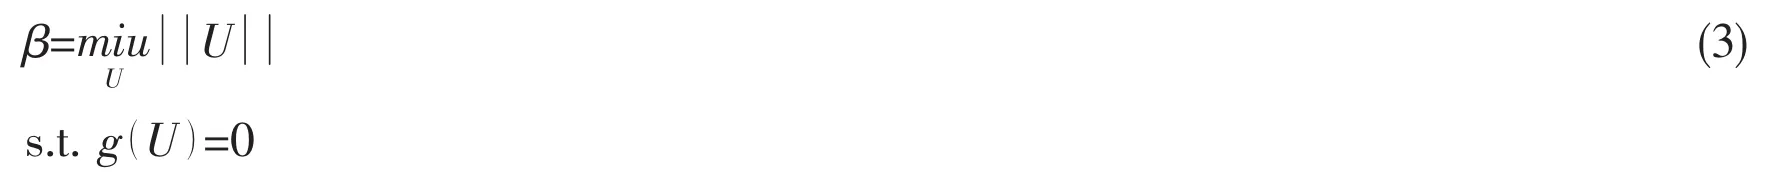
The detailed process of calculation for β,i.e.,the solution of Eq.(3),can be found in Choi et al(2007)[6].The variables should be transformed into normal variables first if they are not normal distributed using the formulae proposed by Rosenblatt(1952)[13],i.e.

JC method is convenient and effective to use,and can offer reliability index of certain accuracy,however,if the limit state function is highly nonlinear,Second Order Reliability Method (SORM)as introduced below can be more accurate than FORM.
1.3 Second Order Reliability Method(SORM)
SORM considers the nonlinear curvatures of the limit-state surface around MPP,so it can be an alternative to FORM if the limit-state function is highly nonlinear.
The SORM formulae proposed by Breitung(1984)is as follows[14]:

Tvedt(1983)[15]has developed another popular SORM approximation which is thought to be more accurate than the Breitung’s formulation.The detailed procedures of both formulas can be found in Choi et al(2007)[6].
1.4 The response surface methods(RSM)
RSM is an efficient and widely used approach especially for complicated systems which have no implicit or only have ambiguous limit state function.The main concept of RSM is fitting an explicit form of response surface function(RSF)at the design point.The predominantly form of the RSM was the polynomial function.Considering the cross terms,a complete quadratic RSF is as follows[16]:
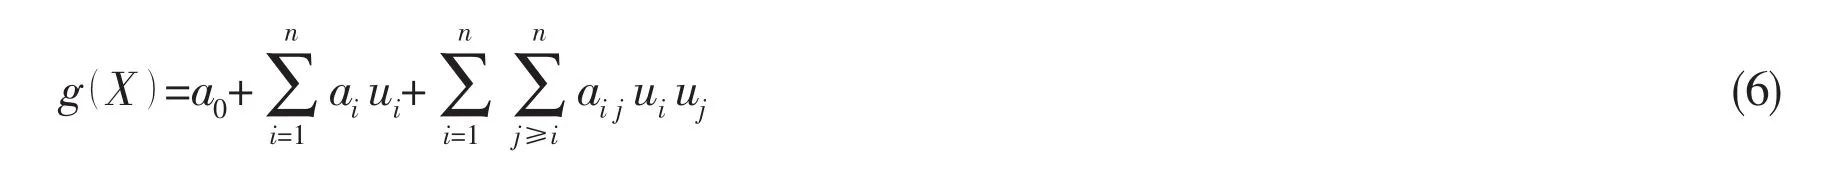
The values of a0,ai,and aijcan be obtained by numerical methods.
1.5 Neural Network Simulation
There are many structures whose performance response to input variables are numerically obtained instead of being described through an explicit limit state function,and neural network simulation is effective to handle these problems.Among several kinds of neural networks, Back Propagation(BP for short)neural network simulation is of strong nonlinear mapping ability.It has been proved mathematically that a 3-layer BP neural network can approach limit state function at any precision given adequate hidden layer neurons[17].However,the most appropriate number of the hidden layer neurons is determined by trial and error rather than a unified rule,which might increase calculation work.
It is worth mentioning that the reliability analysis methods introduced above are complementary to each other rather than mutually exclusive,and a lot of researches were carried out combing two or more analysis methods.
2 Crack growth rate models
Fatigue reliability analyses in essence can be seen as the application of reliability analysis methods to the assessments of structural fatigue life,whose most distinctive feature is that the limit state function is established through a specified fatigue criterion.Various fatigue life models may involve different number of random variables and parameters,leading to different limit state functions.The authors have carried out a simple reliability analysis based on the unified fatigue life prediction method(UFLP)[18],and in this paper,the fatigue reliability analysis will be based on a short crack growth rate model[4]and two dwell-fatigue crack growth rate models[4]which are proposed as the basis for service life prediction of welded titanium alloy deep-sea pressure hull by the authors’group.
2.1 Short fatigue crack growth rate model
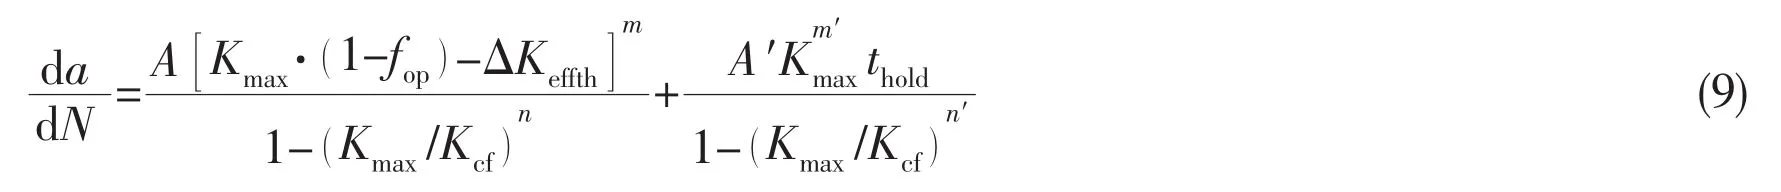
Short crack growth rate model proposed by Wang et al(2014)[4]is in the form as follows:
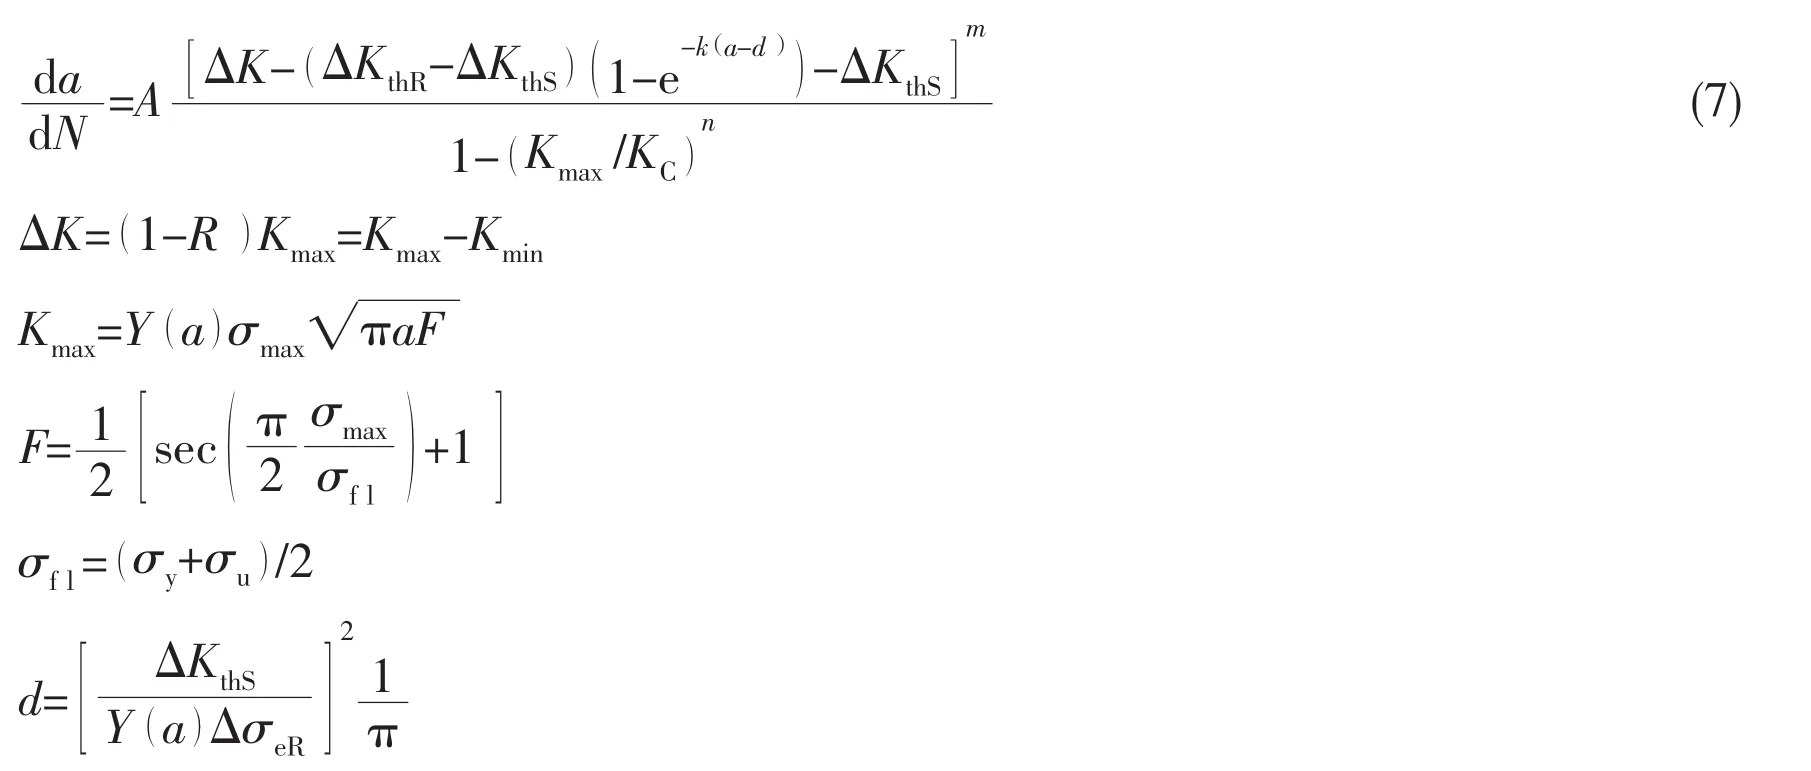
where A is a material and environmentally sensitive constant,m is also a ma-terial constant which indicates the slope of the crack growth rate curve;a is the crack length, m;n is the unstable fracture index;KCis the fracture toughness of the material,R is the stress ratio;ΔKthRis the threshold for long crack under the stress ratio R;ΔKthSis the threshold for short crack under the stress ratio R,with corresponding crack length d;σflis the flow stress of the material,MPa;ΔσeRis the material fatigue limit with the stress ratio R.
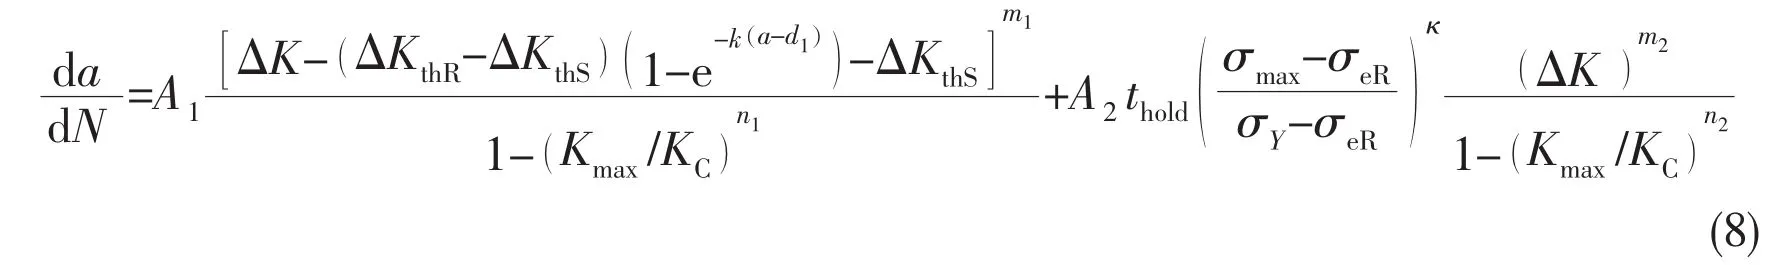
2.2 Dwell-fatigue crack growth model I
Wang(2015)[4]proposed a dwell-fatigue crack growth model and verified the model on titanium alloy IMI834.The model attributes the dwell-fatigue crack growth rate to two terms, one is the normal fatigue crack growth rate and the other is the crack growth rate due to a certain time of the dwell loading:
2.3 Dwell-fatigue crack growth model II
Wang et al(2013)[5]has presented another dwell-fatigue crack growth model which is extended on the basis of UFLP,written as follows:
where Kmax,ΔK are calculated by the formulae proposed by Cui et al(2011)[18].The model has been verified on titanium alloy Ti-6242 at room temperature[5].
3 Fatigue reliability analyses
The limit state function will be established based on the short crack growth model and dwell fatigue crack growth rate models I and II respectively.And the criteria of failure is g()X =N-Nc≤0,in which N is the integration of the inverse of the crack growth rate formulae.
3.1 Fatigue reliability analysis based on short crack growth model
The limit state function based on short crack growth model[4]is,
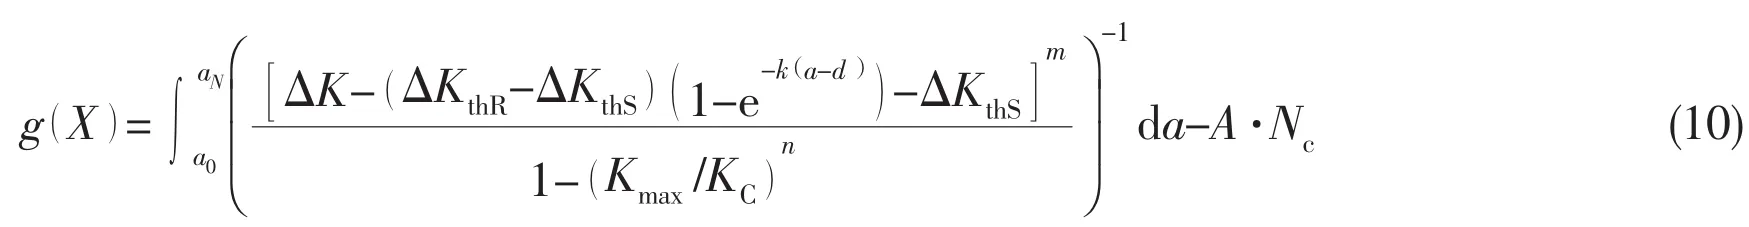
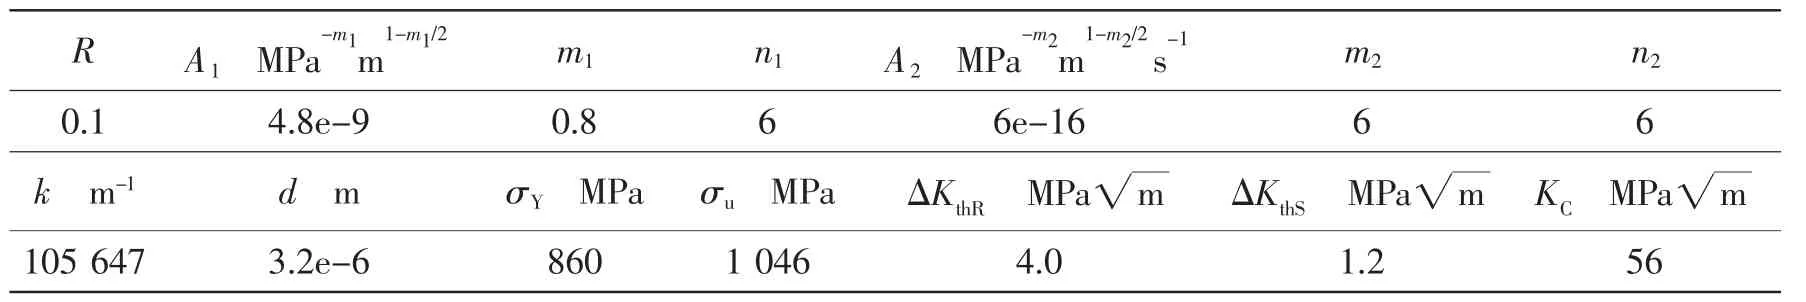
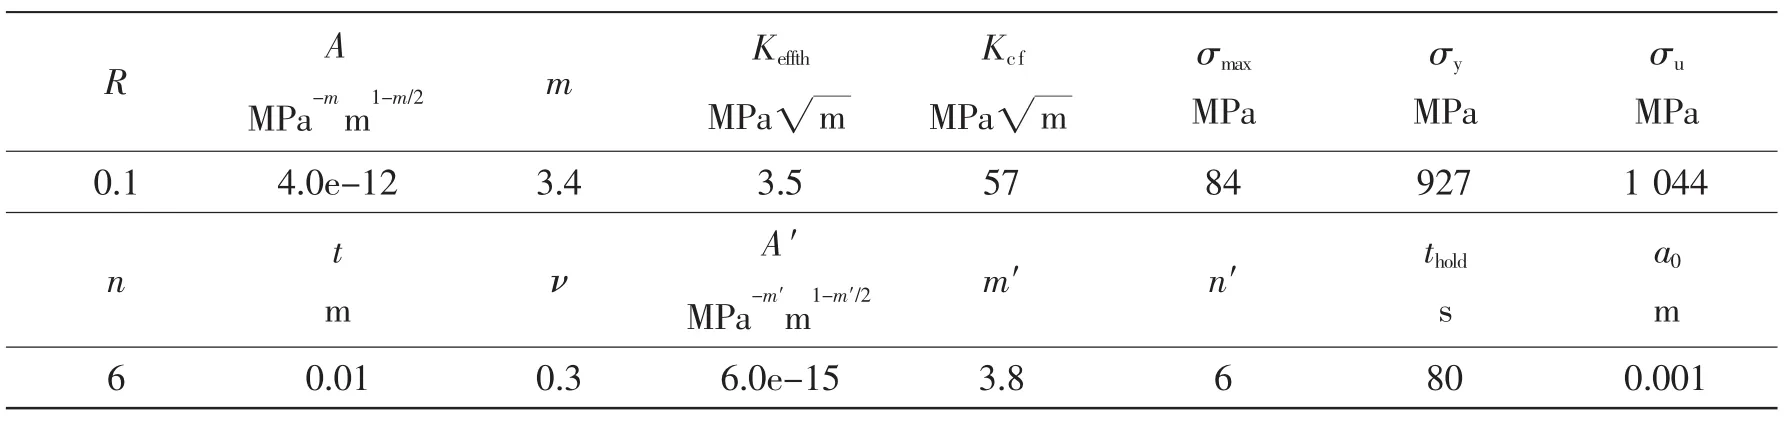
The uncertainties in Eq.(10)come from the parameters a0,aN,Kmax,ΔK,n,KC,A,ΔKthR, ΔKthS,k,d,m.Considering the total process of short crack growth,it is assumed that⑴ The crack will begin to grow when the stress intensity factor range approaches to ΔKthS;⑵ The crack will grow unstably when the maximum stress intensity factor range reaches KC.a is the crack length in Eq.(9),and both Kmaxand ΔK are intermediate variables.The authors thencombined the uncertainties of a0&d into that of ΔKthS,and uncertainty of aNinto that of KCfor simplicity,thus the uncertain variables are n,KC,A,ΔKthR,ΔKthS,k,m.The example is to validate the feasibility of analysis methods in assessing the fatigue reliability,and it is assumed that all the uncertain variables follow the lognormal distribution.It is without loss of generality because the processes of application of different analysis methods for various distributions are similar.
The mean values of uncertain variables are taken as the same with those given in Wang (2015)[4],and the statistical properties of the uncertain variables are assumed to be those listed in Tab.1.
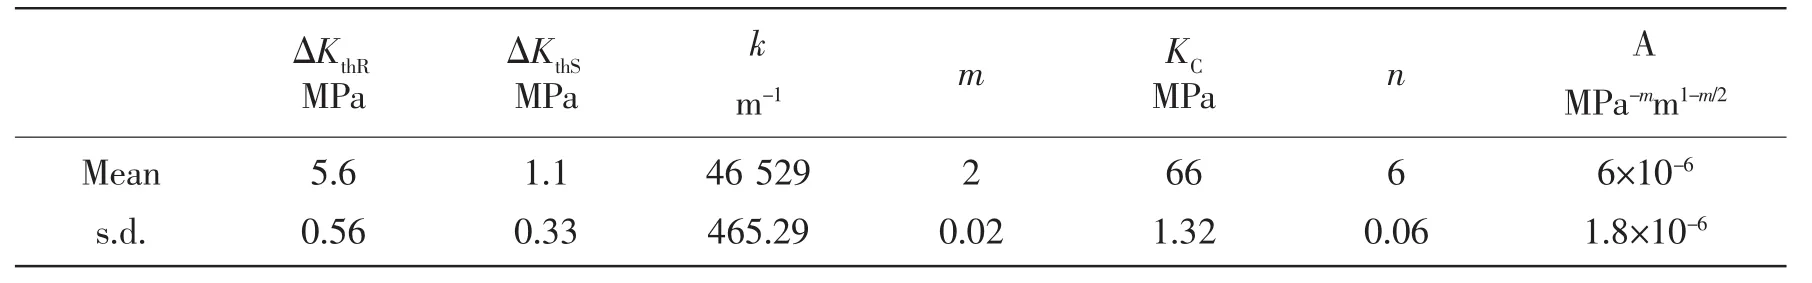
Tab.1 The statistical properties of uncertain variables
In general,the fatigue reliability analysis is carried out through MCS and RSM.MSC simulation numbers are 107and 106respectively.After using RSM to find a quadratic RSF at MPP, the reliability index calculation by MSC(with simulation number 107),FORM and SORM with Breitung formulae and Tvdet formulae respectively will be employed.The results are illustrated in Fig.1 and Fig.2.It can be seen that the results by five methods are in good agreement when N>1 200.The fatigue reliability analysis in this paper used MCS simulation 107and 106respectively and the corresponding highest reliability index is 5.199(about N=1 200,and pf= 10-7),when the reliability index became larger(N<1 200)MCS must have samples more than 107which is too time-consuming to carry out in this paper.The RSF in RSM is of a form of quadratic polynomial without cross terms,which is not highly nonlinear,then the reliability index calculated by FORM and SORM are close to each other.
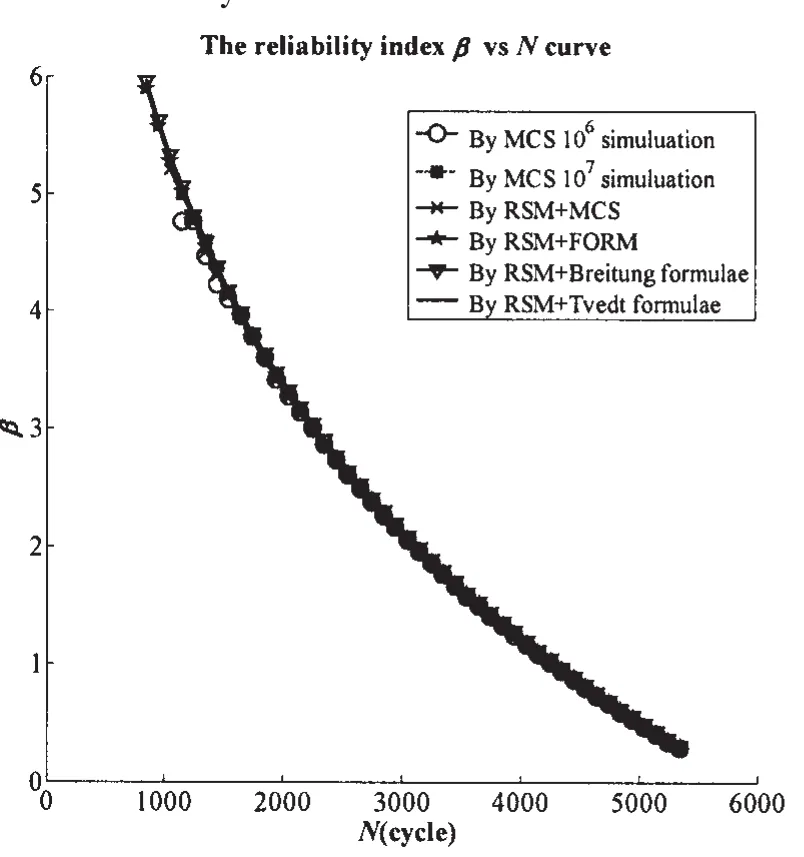
Fig.1 The reliability index β calculated by different methods
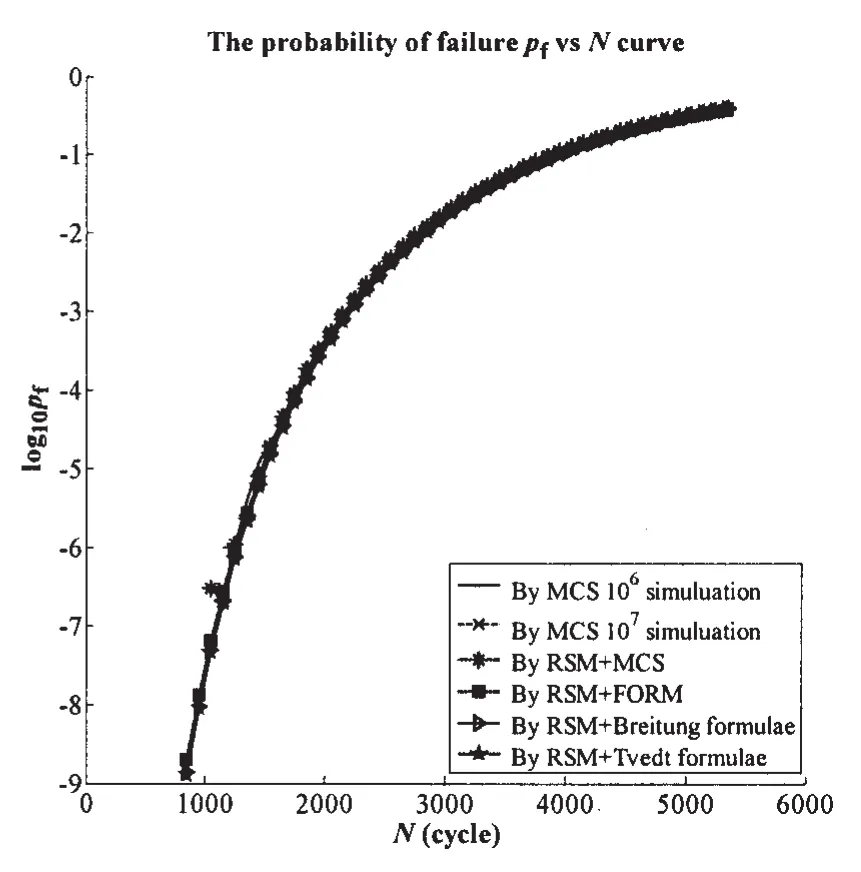
Fig.2 The failure probability pfcalculated by different methods
The authors calculated further with different standard deviations(s.d.),in which cases the s.d.of the variables are half and twice as assumed in Tab.1,and the results have been plotted in Fig.3.It can be seen that the larger the s.d.are,the less reliability index,as bigger s.d.indicate that the data have more scatters around the mean values which will result in more failure occurrences.
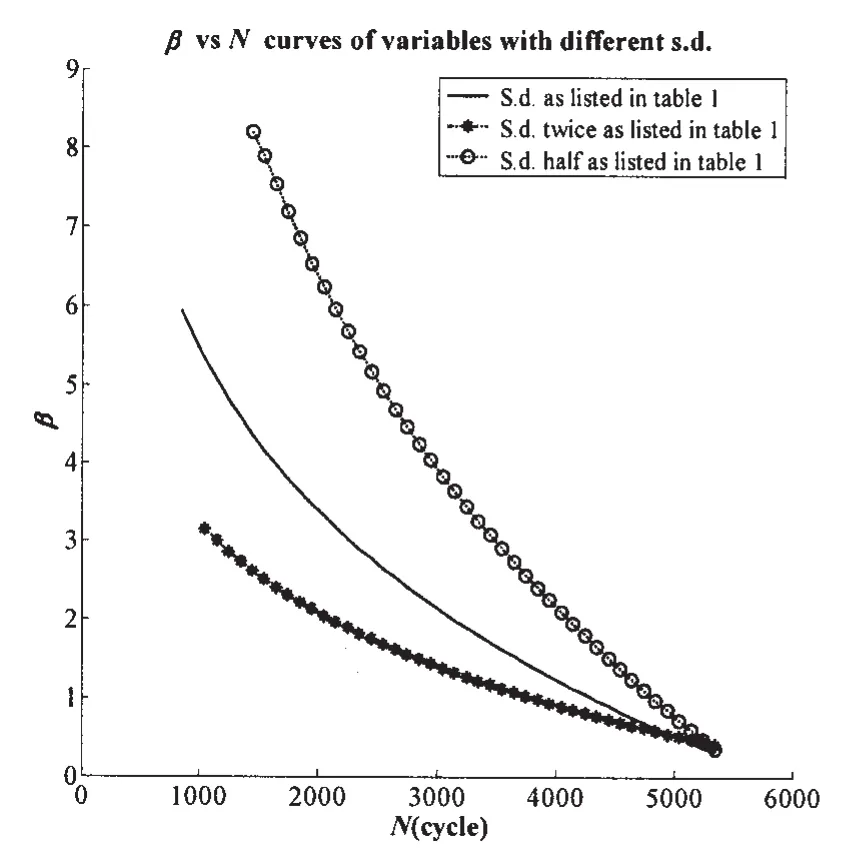
Fig.3 β~N curves calculated by RSM+Breitung SORM for three different cases of s.d.
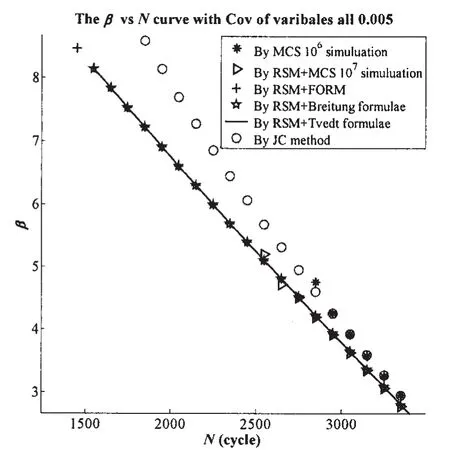
Fig.4 β~N curves calculated by different methods with Cov of variables all 0.005
3.2 Fatigue reliability analysis based on dwell fatigue crack growth rate model I
The limit state function based on dwell fatigue crack growth rate model I[4]is

We assumed six different cases in which the coefficients of variation(Cov)of these variables are all,for simplicity,0.005,0.01,0.02,0.03,0.05 and 0.1 respectively,and all the variables are lognormal distributed.The reliability index curves are plotted in Fig.4 to Fig.9 through different methods.It can be seen from the figures that the reliability index is reduced with the Cov increasing for the same cycle number.Generally speaking,when Cov are smaller,which means the s.d.are also smaller,the reliability index is larger because the data points are more closer to the mean values which reduces the failure probability.Especially,when Cov are equal to 0,there are no uncertainty in the parameters,and the fatigue analysis turns to be a deterministic one.
Tab.2 The mean value of parameters in Eq.(11)according to Wang(2015)[4]
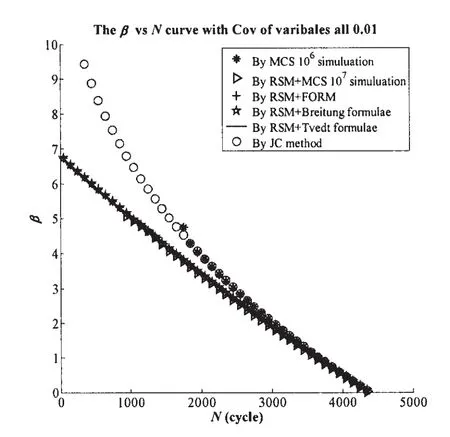
Fig.5 β-N curves calculated by different methods with Cov of variables all 0.01
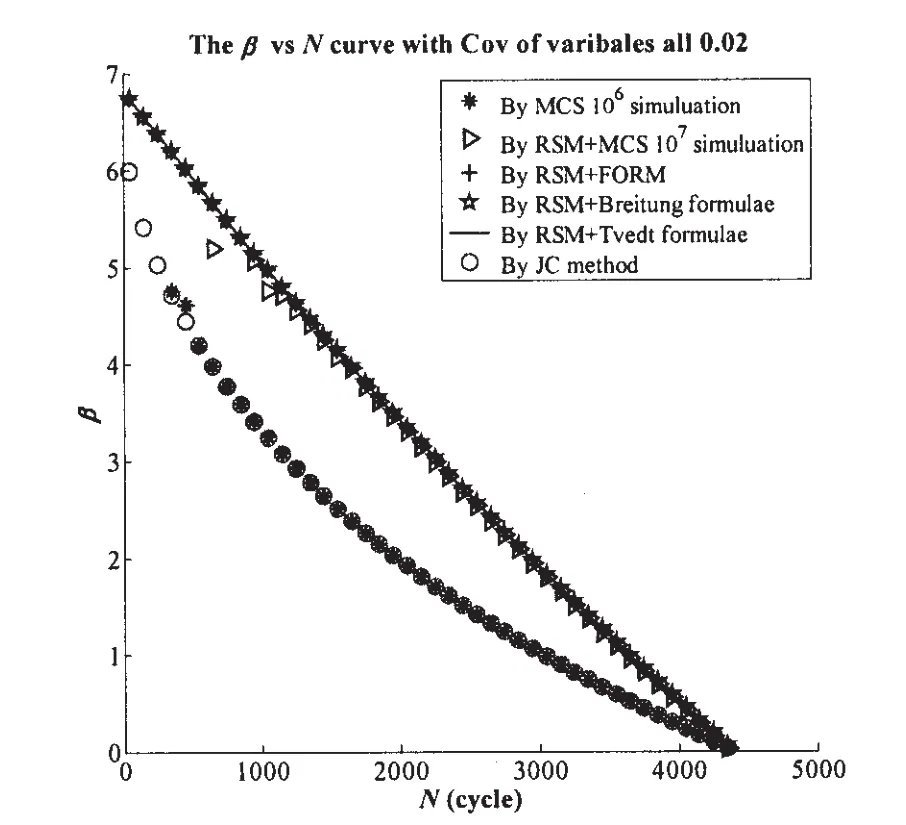
Fig.6 β-N curves calculated by different methods with Cov of variables all 0.02
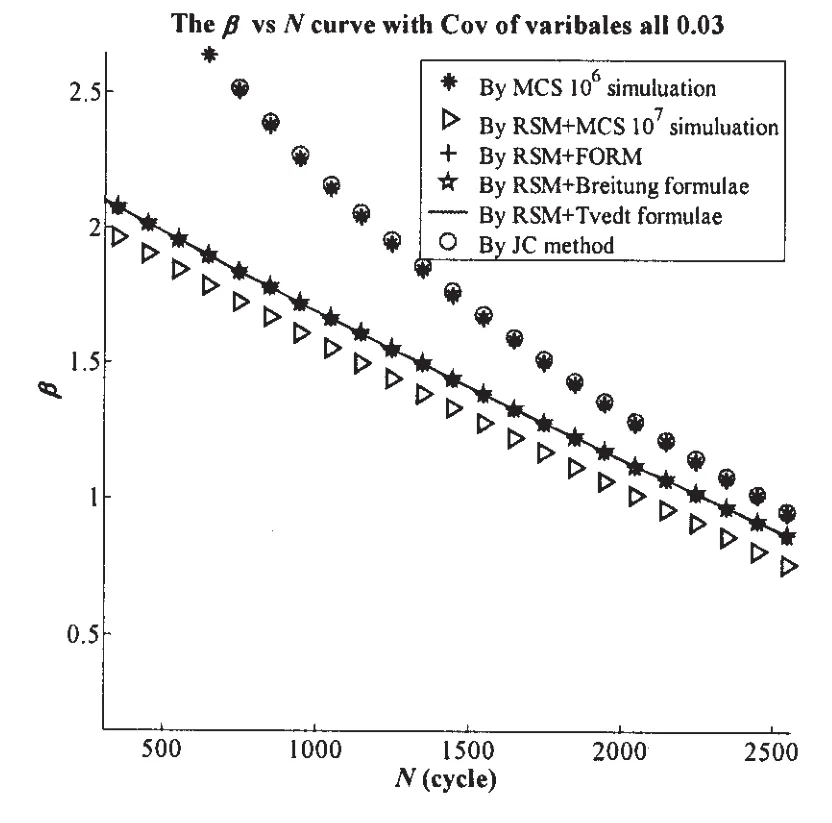
Fig.7 β-N curves calculated by different methods with Cov of variables all 0.03
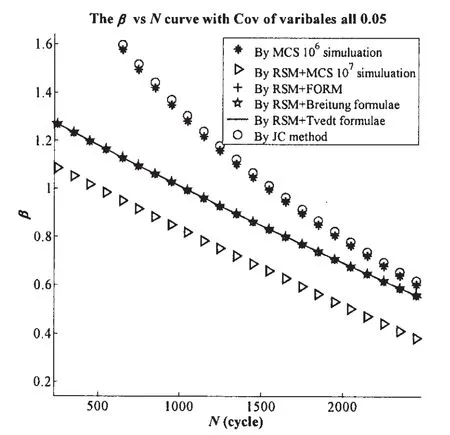
Fig.8 β-N curves calculated by different methods with Cov of variables all 0.05
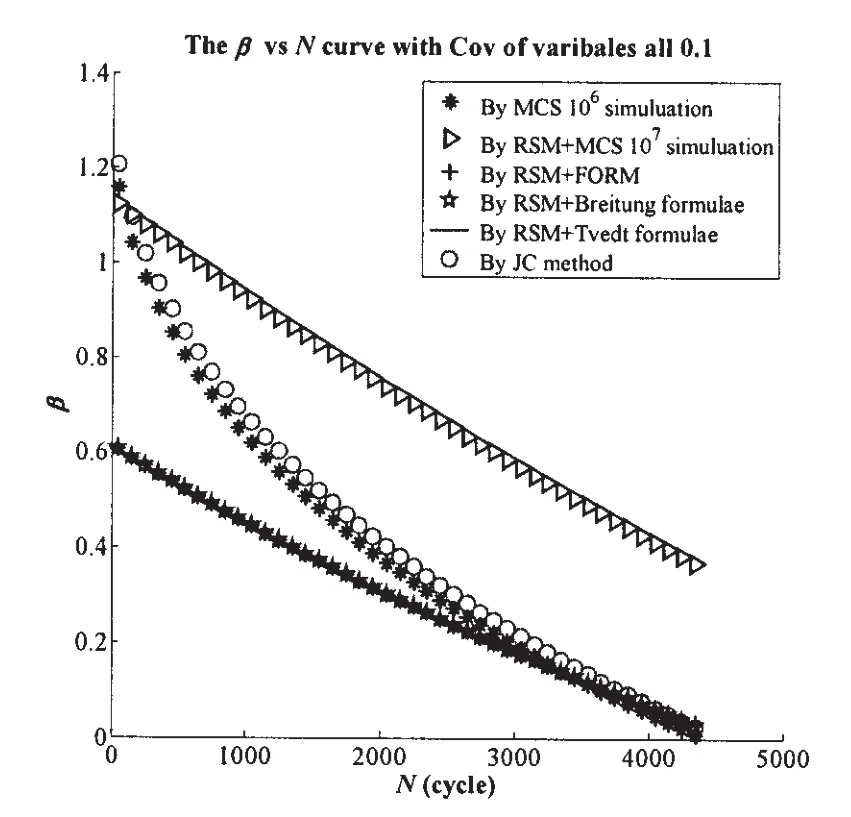
Fig.9 β-N curves calculated by different methods with Cov of variables all 0.1
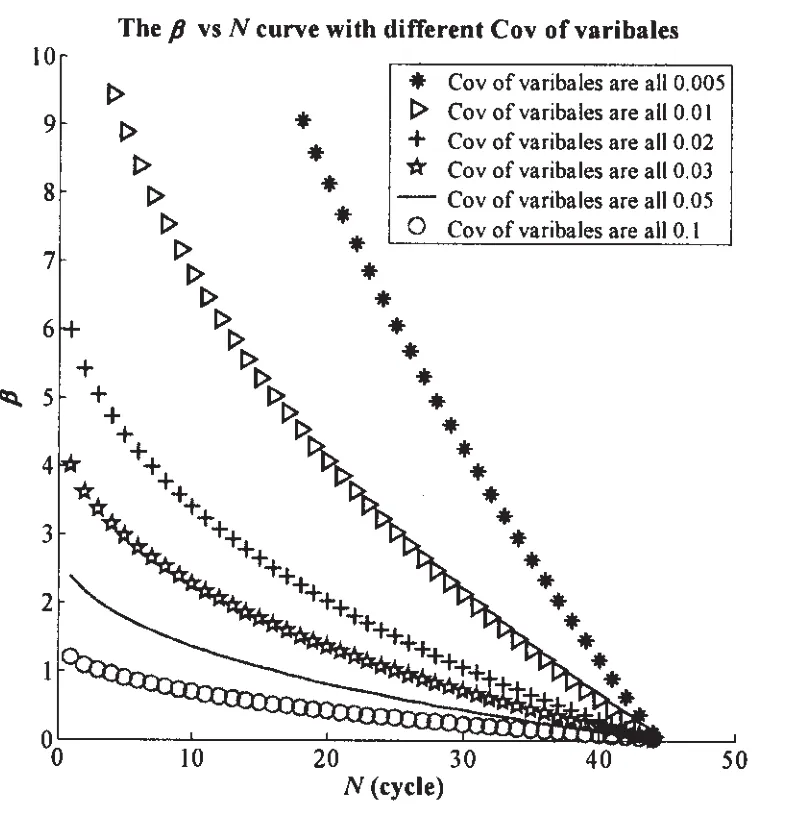
Fig.10 β-N curves calculated by JC method with different Cov values of variables
In the six cases of different Cov values of variables,the results obtained by MCS and direct JC method agree to each other quite well.However,the difference between the results of MSC and RSM grows larger as the Cov become larger.Fig.9 indicates that the results of RSM and MCS agree to each other poorly.The RSM has failed in trying to reach an appropriate approximation of the limit state function as received,especially when the Cov are large.Therefore in this paper the authors calculated the reliability index with different Cov values using JC method directly as a comparison,in whose procedure the partial differentials of the limit state function were obtained numerically,and the reliability index curves obtained are plotted in Fig.10.The trend of the curves in Fig.10 emphasizes the fact that if the Cov of variables are larger,the fatigue reliability decreases as a result,and that the parameters in the limit state function need to be determined as accurately as possible.
3.3 Fatigue reliability analysis based on dwell fatigue crack growth rate model II
When the dwell fatigue crack growth rate model II is employed,the limit state function is
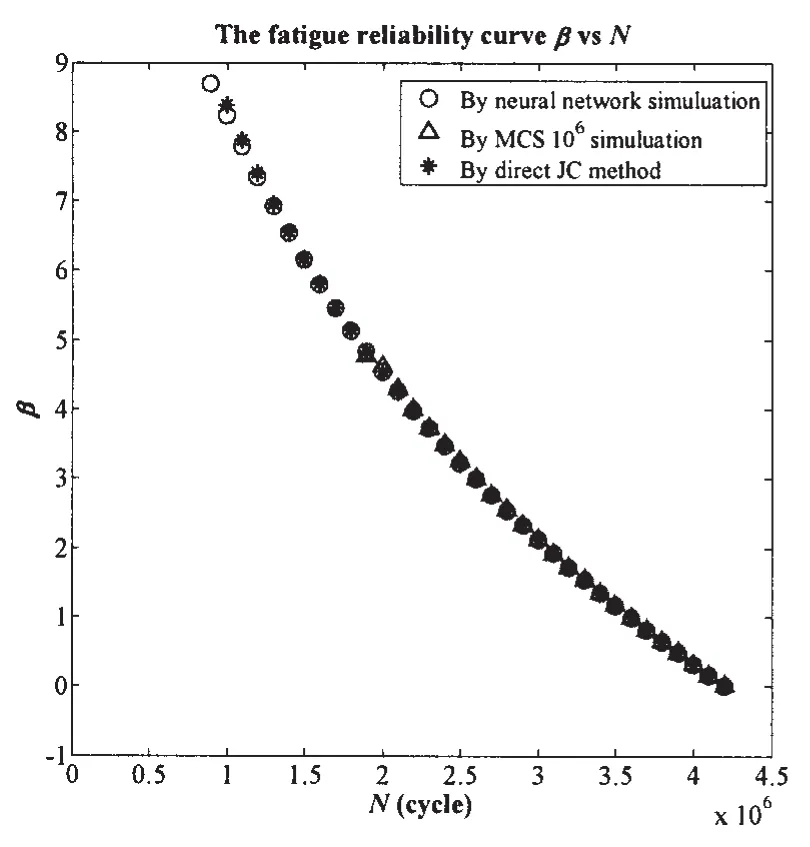
Fig.11 β-N curves calculated by different methods with Cov of variables all 0.02
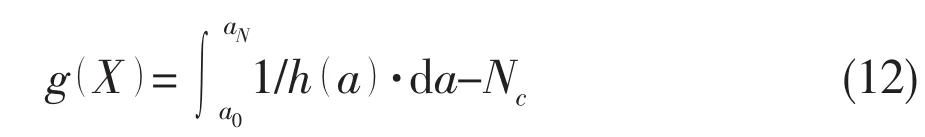

Fig.12 β-N curves calculated by BP neural network with different Cov of variables.The‘BP NN’in the figure denotes‘BP neural network simulation’
Tab.3 The mean value of parameters in Eq.(12)according to Wang et al(2013)[5]
4 Summary and conclusions
In this paper,fatigue reliability analyses are carried out to the full depth manned cabin titanium alloy based on a newly proposed short crack growth model and two dwell fatigue crack growth models,with the several reliability analysis methods and the different crack growth rate models,the following conclusions can be drawn.
(1)For a specified limit state function,there are several reliability analysis methods available to use,at least one of which may be promising to obtain an accurate result as well as costing reasonable time.
(2)For a fatigue reliability assessment based on the short crack growth model mentioned here,as there is no explicit function,RSM may be employed to carry out the analysis,which can offer a quadratic approximation to fit the limit state function at MPP,and then several methods can be used to calculate failure probability.
(3)For a fatigue reliability analysis based on dwell fatigue crack growth rate model I,the authors used MCS,RSM+MCS,RSM+FORM,RSM+Breitung formulae SORM,RSM+Tvdet formulae SORM and JC to calculate the reliability index.For all the conditions considered,the JC method agrees best with MCS,and the approximation ability of RSM diminished with the Cov of variables increasing.
(4)In this paper,the statistical properties of the parameters are assumed,and the authors calculated the reliability index under the conditions in which the parameters are with different s.d.or Cov,whose results indicated that the larger the s.d.or Cov are,the more scatters will be drawn into the reliability index.Therefore,the parameters in the limit state function should be determined as accurately as possible.
(5)For a fatigue reliability analysis based on dwell fatigue crack growth rate model II,the authors used MCS,JC method and BP neural network simulation to carry out the fatigue reliability analysis and the conclusion is that the BP neural network simulation can not only calculate the reliability index without knowing the limit state function but its accuracy can be satisfactory.However it is better to determine the number of hidden layer in BP neural network by trial and error which may increase the calculation work.
Acknowledgments
This work is supported by the National Hi-tech Research and Development Plan(863Plan)Project of China(Grant No.2014AA09A110),the State Key Program of National Natural Science of China‘Structural Reliability Analysis on the Spherical Hull of Deep-sea Manned Submersibles’(Grant No.51439004)and the Sci-tech Innovation Funds from CSSRC(Grant No.G3314)
[1]Wirsching P.Application of Reliability Methods to Fatigue Analysis and Design[M].Recent Developments in Reliability Based Civil Engineering(A.Haldar,ed),World Scientific Publishing Co.,2006.
[2]Fatemi A,Yang L.Cumulative fatigue damage and life prediction theories:A survey of the state of the art for homogeneous materials[J].International Journal of Fatigue,1998,20(1):9-34.
[3]Cui W C.A state-of-the-art review on fatigue life prediction methods for metal structures[J].Journal of Marine Science and Technology,2002a,7:43-56.
[4]Wang K.Study on the cold dwell-fatigue life prediction method for titanium alloys[D].Shanghai:Shanghai Jiao Tong University,2015.
[5]Wang K,Wang F,Cui W C.Prediction method of the dwell-fatigue crack growth for titanium alloys and its validation on Ti-6242 at room temperature[J].Journal of Ship Mechanics,2013,17(11):1309-1317.
[6]Choi S,Grandhi R,Canfield R.Reliability-based Structural Design[M].Springer,London,2007.
[7]Hu Z,Du X,Conrad D,Twohy R,Walmsley M.Fatigue reliability analysis for structures with known loading trend[J]. Structural&Multidisciplinary Optimization,2014,50:9-23.
[8]Du X,Sudjianto A,Huang B.Reliability-based design with the mixture of random and interval variables[J].Journal of Mechanical Design,2005,127(2):1068-1076.
[9]Haldar A,Mahadevan S.Probability,Reliability and Statistical Methods in Engineering Design[M].John Wiley&Sons, Inc.New York,1999.
[10]Du X,Wei C.Towards a better understanding of modeling feasibility robustness in engineering design[J].Journal of Mechanical Design,2000,122:385-394.
[11]Hasofer A,Lind N.Exact and invariant second-moment code format[J].Journal of the Engineering Mechanics Division. 1974,100(EMI):111-121.
[12]Du X,Chen W.A most probable point based method for uncertainty analysis[C]//Proceedings of DETC'00,ASME 2000 Design Engineering Technical Conferences and Computers and Information in Engineering Conference.Maryland,2000: 1-10.
[13]Rosenblatt M.Remarks on a multivariate transformation[J].The Annals of Mathematical Statistic,1952,23:470-472.
[14]Breitung K.Asymptotic approximations for multinormal integrals[J].Journal of Engineering Mechanics,1984,1103:357-366.
[15]Tvedt L.Two second-order approximations to the failure probability[R].Det Norske Veritas,Technical Report No.RDIV/ 20-004083,1983.
[16]Gayton N,Bourinet J M,Lemaire M.CQ2RS:A new statistical approach to the response surface method for reliability analysis[J].Structural Safety,2003,25(1):99-121.
[17]Su H,Cheng J.Application of neural network in reliability analysis of prestressed concrete bridges[J].Structural Engineers,2009,25(2):71-76.
[18]Cui W C,Wang F,Huang X P.A unified fatigue life prediction method for marine structures[J].Marine Structures,2011, 24(2):153-181.
考慮小裂紋和保載時間效應的疲勞可靠性分析
王瑩瑩1,3,王 芳2,崔維成2
(1.中國船舶科學研究中心,江蘇 無錫 214082;2.上海海洋大學 海洋科學學院 上海深淵科學工程技術研究中心,上海 201306;3.中國船舶科學研究中心 深海載人裝備國家重點實驗室,江蘇 無錫 214082)
大深度載人潛水器的載人艙材質是高強度金屬,不可避免地會受到疲勞損害現象的挑戰。實際的載人艙結構中存在著由外部因素和內部因素引起的不確定性,其疲勞壽命將受到這些不確定性的影響。在前期的研究中,課題組基于統一的疲勞裂紋擴展率模型進行了疲勞可靠性分析方法的探討,可作為進一步進行載人艙疲勞壽命預報的基礎。但是,該模型無法反映小裂紋和保載時間的影響,而這正是載人艙結構和所受載荷的重要特征,應進行深入研究。所以,課題組提出了一個小裂紋擴展率模型和兩個反映保載時間效應的裂紋擴展率模型,以更好地解釋載人艙用鈦合金金屬的蠕變疲勞特性。文中基于這三個模型,結合不同的理論方法,進行了疲勞可靠性分析,考察了可靠度分析方法之間的不同、輸入參數以及不同的裂紋擴展理論模型對結構的疲勞可靠性的影響。
不確定性;疲勞可靠性分析;裂紋擴展率模型
U661.4
A
王瑩瑩(1983-),女,中國船舶科學研究中心博士研究生;
U661.4
A
10.3969/j.issn.1007-7294.2016.06.007
1007-7294(2016)06-0710-12
王 芳(1979-),女,上海海洋大學副研究員;
崔維成(1963-),男,上海海洋大學教授,博士生導師。
Received date:2016-04-15
Founded item:Supported by the National Hi-tech Research and Development Plan(863 Plan)Project of China (Grant No.2014AA09A110);the Sci-tech Innovation Funds from CSSRC(Grant No.G3314)and the State Key Program of National Natural Science of China‘Structural Reliability Analysis on the Spherical Hull of Deep-sea Manned Submersibles’(Grant No.51439004)
Biography:WANG Ying-ying(1983-),female,Ph.D.student,E-mail:yunbeidou@yeah.net;
WANG Fang(1979-),female,associate professor;CUI Wei-cheng(1963-),male,professor/tutor.
猜你喜歡
林業科學研究(2022年5期)2022-10-12 06:50:18
艦船科學技術(2022年13期)2022-08-11 09:29:16
紡織科學研究(2021年9期)2021-10-14 08:52:14
紡織科學研究(2021年7期)2021-08-14 01:42:38
科技進步與對策(2021年3期)2021-03-11 00:57:34
紡織科學研究(2020年1期)2020-05-21 00:31:08
意林·全彩Color(2019年7期)2019-08-13 00:53:50
World Journal of Diabetes(2019年7期)2019-07-23 11:52:08
韓國語教學與研究(2017年2期)2017-03-07 17:48:24
法語學習(2015年2期)2015-04-17 09:05:31
- 船舶力學的其它文章
- Overview on the Development of Autonomous Underwater Vehicles(AUVs)
- Identification of Non-stationary Excitation and Analysis of Transient Radiation Noise on Steering Engine
- Research on the Fracture Toughness for Ship Cracked Plates Based on the Accumulative Increment Plastic Deformation
- Forced Vibrations of a Submerged Finite Cylindrical Shell with an Internal Longitudinal Plate
- Study on the Structural Strengthening Design under the Ship-ice Collision Load
- Prediction of Crack Growth Rates of a High Strength Titanium Alloy for Deep Sea Pressure Hull under Three Loading Patterns