Cotton Market Fundamentals & Price Outlook
2016-08-10 18:42:59byCottonIncorporated
China Textile 2016年7期
by Cotton Incorporated
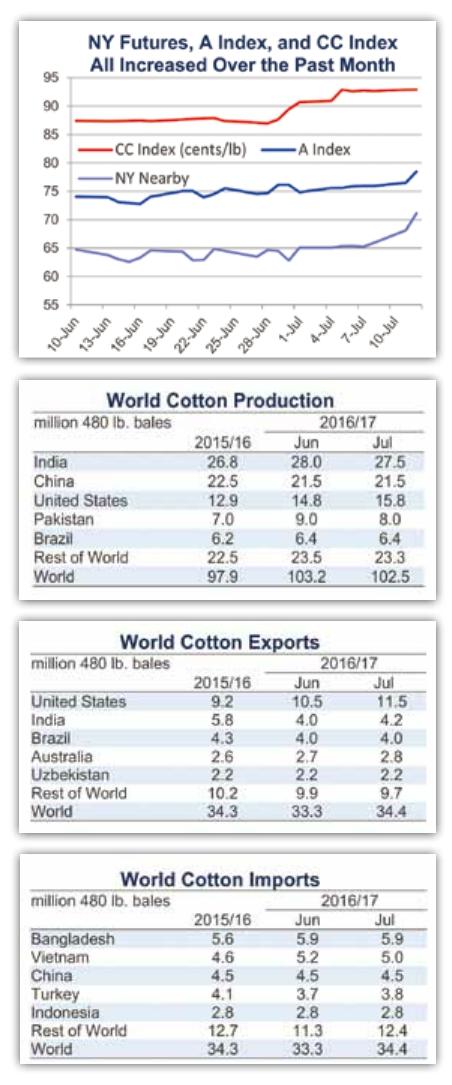
Recent price movement
All benchmark prices rose over the past month.
Values for the December NY futures rose slightly, rising from levels near 65 cents/lb early last month to those above the 70 cent mark in the latest trading. Current levels for NY futures are slightly higher those experienced late last summer.
The A Index also increased, rising from levels near 75 cents/lb a month ago to those above 77 cents/lb recently. Current values are also a little higher than those reached last summer.
The China Cotton (CC) Index rose six cents/lb in international terms over the past month, climbing from values equivalent to 87 cents/lb to those equal to 93 cents/lb. In domestic terms, the CC Index increased from 12,600 RMB/ton to 13,600 RMB/ton.
Prices for the Indian Shankar-6 variety continued to surge higher, rising from 73 to 83 cents/lb in international terms. In local terms, values increased from 38,300 to 44,000 INR/candy.
Movement in Pakistani spot prices was less dramatic. In international terms, spot prices rose from 65 to 68 cents/lb. In domestic terms, prices rose from 5,550 to 5,800 PKR/maund.
Supply, demand, & trade
This months USDA report featured reductions to world production figures for 2015/16 (-0.2 million bales, from 98.1 to 97.9 million) and 2016/17 (-0.6 million bales, from 103.2 to 102.5 million) and increases to world mill-use estimates for 2015/16 (+1.4 million bales, from 108.8 to 110.2 million) and 2016/17 (+1.0 million bales, from 110.6 to 111.6 million). The combination of lower production and increased consumption implies lower ending stocks, and the forecast for world ending stocks in 2016/17 dropped by 3.4 million bales (from 94.7 to 91.3 million). With a projected stocks-to-use ratio of 81.8%, global supply relative to demand remains nearly double the historic average, but this months reduction to estimated ending stocks suggests that the process of working through the excess is proceeding more rapidly than previously believed.
At the country-level, the largest revisions to 2015/16 production estimates were concentrated in the southern hemisphere, with the figure for Brazil falling 300,000 bales (from 6.5 to 6.2 million) and the figure for Argentina dropping 100,000 bales(from 1.0 to 0.9 million). For 2016/17, the largest updates included the additions for the U.S. (+1.0 million bales, from 14.8 to 15.8 million) and Australia (+200,000 bales, from 2.6 to 2.8 million) as well as reductions for Pakistan (-1.0 million bales, from 9.0 to 8.0 million), India (-500,000 bales, from 28.0 to 27.5 million), Greece(-230,000, from 1.2 to 1.0 million), and Uzbekistan (-100,000 bales, from 3.8 to 3.7 million).
In terms of consumption, the revi- sions to the global figures were principally a result of increases to mill-use estimates for China, where numbers were raised by 1.5 million bales for both 2015/16 (to 34.0 million) and 2016/17 (to 35.0 million). Other notable changes to 2016/17 consumption numbers included reductions for India (-250,000, from 24.3 to 24.0 million), Pakistan (-250,000, from 10.5 to 10.3 million), and Vietnam (-200,000, from 5.1 to 4.9 million). These three countries are the largest exporters of cotton yarn to China. The reduction in Chinese cotton prices during the 2016 calendar year is likely driving all of these changes. Lower prices have made Chinese mills more competitive and therefore reduced the advantage of importing of cotton yarn. Thus far into the calendar year (data available January-May), the volume of Chinese cotton yarn imports is down 19% relative to a year ago.
The global trade forecast for 2016/17 was raised 1.0 million bales (from 33.3 to 34.4 million) to a level virtually even with that for the current crop year (34.3 million). Import estimates were increased for Pakistan (+700,000 bales, from 1.7 to 2.4 million), India (+250,000, from 0.7 to 1.0 million), Brazil (+150,000, from 50,000 to 200,000), and Turkey (+100,000, from 3.7 to 3.8 million). The U.S. export figure was increased 1.0 million bales (to 11.5 million), matching the increase to the U.S. production figure. Other changes to export numbers included additions for India(+200,000, from 4.0 to 4.2 million) and Australia (+100,000, from 2.7 to 2.8 million) and a reduction for Greece (-200,000, from 1.1 million to 0.9 million).
Price outlook
The recent rally in cotton prices has been supported by tightening of supply available to meet near-term demand. This has been most acute in India, where domestic prices have risen the equivalent of 15 cents/lb over the past month. After exporting a significant amount of cotton to Pakistan earlier in the crop year, India has had to rely increasingly on imports itself. In the latest official trade data (for April), India imported 71% more cotton than a year ago.
There has also been tightening in China, where prices have risen about five cents/lb in recent weeks even though 2015/16 ending stocks are estimated at 178% of mill-use. Correspondingly, the issue in China is primarily one of accessibility, despite on-going sales from reserves. Since the onset of sales in early May, virtually all of the cotton put up for sale (both foreign and domestic) has been purchased. However, the volume of cotton offered dropped off in June. Reports indicate this was a result of quality, with some cotton processed for reclassification failing to meet requirements. In addition, reports suggest traders have been buying recently auctioned cotton and taking speculative positions by holding onto their purchases.
As the new crop becomes available, the tightness in India and China should abate. In the coming crop year, prices can be expected to face downward pressure. An important question for prices is how easily the additional 5.6 million bales expected to be grown outside of China in 2016/17 will be able to find buyers. If China remains on the sidelines of international trade, as expected, that could prove difficult in the current environment of sluggish consumption growth.

- China Textile的其它文章
- 500+ professionals trained to help improve textile industry competitiveness in Bangladesh
- NCTO lauded congressional actions to preserve critical requirements for DOD
- Lenzing announced a partnership with The Woolmark Company
- Improved enforcement of IP laws in China encourages world—class technologies
- Intertextile Pavilion Shenzhen 2016 commenced this July
- German tech meets VN textile