Influences of the interannual variability of vegetation LAI on surface temperature
2016-11-23 03:30:20ZHUJiWenndZENGXioDong
ZHU Ji-Wennd ZENG Xio-Dong,b
aInternational Center for Climate and Environment Sciences, Institute of Atmospheric Physics, Chinese Academy of Sciences, Beijing, China;
bCollaborative Innovation Center on Forecast and Evaluation of Meteorological Disasters, Nanjing University of Information Science & Technology,Nanjing, China
Influences of the interannual variability of vegetation LAI on surface temperature
ZHU Jia-Wenaand ZENG Xiao-Donga,b
aInternational Center for Climate and Environment Sciences, Institute of Atmospheric Physics, Chinese Academy of Sciences, Beijing, China;
bCollaborative Innovation Center on Forecast and Evaluation of Meteorological Disasters, Nanjing University of Information Science & Technology,Nanjing, China
The infuences of interannual variability of vegetation LAI on surface temperature are investigated via two ensemble simulations, applying the Community Earth System Model. The interannual LAI,derived from Global Inventory Modeling and Mapping Studies NDVI for the period 1982-2011, and its associated climatological LAI, are used in the two ensemble simulations, respectively. The results show that the signals of the infuences, represented as ensemble-mean diferences, are generally weaker than the noises of the atmospheric variability, represented as one standard deviation of the ensemble diferences. Spatially, the signals are stronger over the tropics compared with the mid-high latitudes. Such stronger signals are contributed by the signifcant linearity between LAI and surface temperature, which is mainly caused via the infuences of LAI on evapotranspiration. The maximum amplitudes of the infuences on the interannual variability of surface temperature are high and thus deserve full consideration. However, the mean magnitudes of infuences are small because of the small changes in the amplitudes of LAI. This work only investigates the infuences of the interannual variability of LAI and does not consider interannual changes in other vegetation characteristics, such as canopy height and fractional cover. Further work involving dynamic vegetation models may be needed to investigate the infuences of vegetation variability.
ARTICLE HISTORY
Revised 12 April 2016
Accepted 12 April 2016
Interannual variability;leaf area index; surface temperature
通過兩組模式的集合模擬,本論文研究了植被葉面積指數的年際變化對地表溫度的影響。結果表明葉面積指數的年際變化的影響信號整體弱于大氣變率的噪聲。但是,就空間分布而言,熱帶地區的影響信號強于中高緯度地區。這主要是由于熱帶地區的葉面積指數通過影響地表蒸散發導致其與地表溫度具有顯著的線性關系。
1. Introduction
Vegetation plays signifcant roles in regulating exchanges of water and energy between the land surface and the atmosphere via its infuences on evapotranspiration and albedo. Changes in vegetation characteristics, such as LAI, can result in considerable feedbacks to climate (Zhu and Zeng 2015). Vegetation variability is considered as an important forcing for climate as atmospheric dynamics and ocean circulations (Pielke et al. 1998).
Many previous studies have been published to discuss the feedbacks and mechanisms via idealized modeling simulations in which vegetation is drastically changed (Charney, Stone, and Quirk 1975; Dickinson and Henderson-Sellers 1988; Bonan, Pollard, and Thompson 1992; Bounoua et al. 2000; Buermann et al. 2001). These results provide valuable references for understanding the processes of land-atmosphere interactions. For example,an increased vegetation density is expected to result in regional or even global climate warming by reducing the surface albedo. Meanwhile, it is also favorable for cooling a surface because of intensifed evapotranspiration. However, these idealized simulations are unlikely to occur in the current century and may overestimate the feedbacks(Chapin et al. 2005).
Therefore, in this work, the long-term interannual vegetation LAI (1982-2011), derived from Global Inventory Modeling and Mapping Studies (GIMMS) NDVI (Zhu et al. 2013), is used to estimate the degree to which the interannual variability of vegetation infuences surface temperature. Section 2 describes the model, LAI datasets, and the experimental design. Section 3 presents the results and discussion. Concluding remarks are given in Section 4.
2. Methods
2.1. Model
This study applies version 4 of the Community Land Model(CLM4; Oleson, Lawrence, and Bonan 2010; Lawrence et al. 2011), coupled with version 4 of the Community Atmosphere Model (CAM4; Neale et al. 2013). In CLM4, LAI is included in the surface data. LAI can afect the radiation of a vegetated surface via changing the albedo of plant functional types for visible and near-infrared solar radiation (Sellers et al. 1986; Dorman and Sellers 1989; Asner et al. 1998). The evapotranspiration over a vegetated surface is also impacted by LAI via evaporation from wetted leaves, and transpiration from dry leaves. These feedbacks result in changes in surface energy budgets, and consequently surface temperature.
2.2. Datasets
Two LAI datasets are used in this study. One comprises the global datasets of vegetation LAI derived from GIMMS NDVI for the period 1982-2011 (Zhu et al. 2013). The data are available at a 15-day temporal frequency and a 1/12° spatial resolution. For application in the CESM simulations,the data are interpolated into a monthly frequency and a 1.9° (latitude) × 2.5° (longitude) horizontal resolution. The other data-set employed is the multi-year mean of the above interannual LAI. Figure 1 shows the spatial distribution of the multi-year mean LAI from 1982 to 2011 and its interannual variability evidenced by its standard deviation.
2.3. Experimental design
First, forced by climatological SSTs (Hurrell et al. 2008), a 20-year initial simulation is conducted. Its land and atmosphere initial conditions are the default datasets of CLM4 and CAM4. These datasets are derived from the spin-up simulations of CESM. The initial simulation is controlled to output 20 restart fles each frst day of January. Then,two ensemble experiments are carried out. Each ensemble comprises 20 members that use the 20 diferent atmospheric initial conditions derived from the initial simulation,and the land initial conditions are also the default initial datasets of CLM4. The two ensemble experiments, defned as INT and CLI, utilize the above interannual LAI and its associated climatological LAI, respectively. They difer only with respect to the LAI datasets. Both ensemble experiments are run for 30 years, and are forced by climatological SSTs to isolate the infuence of the interannual variability of SSTs.
3. Results and discussion

Figure 1.(a) Multi-year mean LAI from 1982 to 2011 (units: m2m-2). (b) Standard deviation of annual LAI.
The results reported in this section have been averaged for 12 months. Furthermore, following Notaro and Liu (2008),we use the ensemble mean diferences, INT minus CLI, to represent the signal of the infuences of vegetation variability, and use one standard deviation of the 20 ensembles of diferences between INT and CLI to represent the noise of the atmospheric variability.
Figure 2(a) shows the time-averaged ratios for the 30 model years between the signals and noises. Generally, the signals are weaker than the noises. Over most areas of the land the ratios are less than 50%. Larger ratios occur over the tropics compared to the mid-high latitudes, which demonstrates that the weaker infuence of LAI interannual variability on surface temperature over tropics is buried by the internal variability of the atmosphere.
Such stronger signals of the infuences over the tropics mainly result from the signifcant linearity between LAI and surface temperature. In CLM4, the inputted LAI is adjusted for vertical burying snow (Wang and Zeng 2009; Oleson,Lawrence, and Bonan 2010). The LAI that is not buried by snow is defned as exposed LAI (ELAI), which directly correlates to the calculations of water and energy exchanges(Oleson, Lawrence, and Bonan 2010). Figure 2(b) shows the time correlations between the diferences in ELAI and surface temperature. Over the tropics, the changes in surface temperature negatively correlate with the changes in ELAI at the 95% confdence level, with correlation coefcients reaching up to -0.9.
These negative correlations are mainly caused via the infuences of ELAI on evapotranspiration. Figure 3 shows time series of the ensemble-mean diferences for surface temperature, ELAI, and latent heat over the tropics. It is clear that the changes in ELAI positively correlate with those of latent heat, with a correlation coefcient of 0.88 at a statistically signifcant level (p < 0.001). However, the changes in latent heat are signifcantly negatively correlated with the changes in surface temperature, with a correlation coefcient of -0.87 at a statistically signifcant level (p < 0.001). Therefore, signifcantly negative correlations are shown in Figure 2(b) over the tropics.
To highlight the amplitudes of the infuences on the interannual variability of surface temperature over the tropics, we defne cases MAX and MIN, representing the diferences in surface temperature exceeding +0.9 and -0.9 standard deviations, respectively. Based on this criterion, eight and six modeling years are selected for cases MAX and MIN, respectively (Figure 3).
Figure 4(a) shows the diferences in surface temperature of case MAX minus those of case MIN over the tropics,which is used to represent the maximum amplitudes of the infuences on the interannual variability of surface temperature. Over most areas of the tropics the amplitudes are between 0.1 and 0.2 K, which should not be ignored compared to the trends in surface temperature over thetropics from 1981 to 2012 - about 0.2 K/10 yr from the National Climatic Data Center Merged Land-Ocean Surface Temperature Analysis (IPCC 2013).

Figure 2.(a) Time-averaged ratios of 30 model years between absolute values of ensemble-mean diferences in surface temperature and one standard deviation of 20 ensemble diferences between INT and CLI. (b) Time correlations between ensemble-mean diferences in ELAI and surface temperature.

Figure 3.Time series of area-averaged diferences in ELAI (units: m2m-2), surface temperature (TS; units: K) (left ordinates), and latent heat (LH; units: W m-2) (right ordinates) over signifcant grids of 15°S-15°N in Figure 2(b).
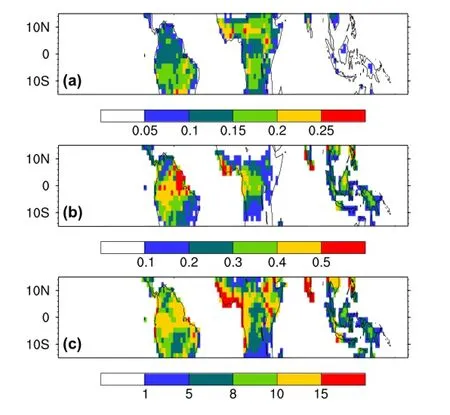
Figure 4.(a) The amplitudes of the diferences in surface temperature (units: K) in case MAX minus those in case MIN. (b) As in (a) but for ELAI (units: m2m-2). (c) Ratios (units: %) between the amplitudes shown in (b) and the multi-year mean ELAI.
Although over the tropics the maximum amplitudes of the infuences are deserving of full attention, the mean magnitudes of infuences are small. The main reason is that the changes in ELAI are small; and not only the absolute amplitudes, but also the relative changes. Figure 4 shows that the maximum amplitudes of interannual variability of ELAI are less than 0.5 m2m-2over most areas of the tropics,and these amplitudes are less than 15% of the multi-year mean ELAI.
This work only investigates the infuences of the interannual variability of LAI on surface temperature. The fractional cover, canopy height, and stem area index of vegetation are still climatological. These characteristics of vegetation also play signifcant roles in regulating land-atmosphere interaction (Bonfls et al. 2012; Zhu and Zeng 2015). Therefore,the results in this work may underestimate the infuences. The other limitation of the work is that it is a one-way interaction between vegetation and climate. The static LAI forces the atmosphere and causes its changes. However, such changes cannot in turn infuence vegetation. Therefore, it is necessary to couple a dynamic vegetation model with the atmosphere in order to better estimate the infuences.
4. Conclusions
Two ensemble experiments have been carried out in this study to investigate the infuences of the interannualvariability of vegetation LAI on surface temperature. The interannual LAI and its associated climatological LAI are used in the two ensembles, respectively.
The results show that the signals of the infuences of LAI interannual variability on surface temperature are generally weaker than the noises of the atmosphere. Spatially, the signals are stronger over the tropics compared to the mid-high latitudes. Such stronger signals result from the signifcant linearity between LAI and surface temperature. The signifcant linearity is mainly caused via the infuences of LAI on evapotranspiration. The magnitudes of the infuences on the interannual variability of surface temperature can reach up to 0.2 K. However, the mean magnitudes of infuences are small because of the weak changes in LAI.
This work primarily investigates the infuences of the interannual variability of vegetation by employing observed interannual LAI. However, the variability of other vegetation characteristics, such as canopy height and fractional cover, should also be included. Additionally, coupling between the atmosphere and dynamic vegetation is necessary to better estimate the efects.
Disclosure statement
No potential confict of interest was reported by the authors.
Funding
This work was supported by the major research projects of the National Natural Science Foundation of China [grant number 91230202].
Notes on contributors
ZHU Jia-Wen is an assistant researcher in the Institute of Atmospheric Physics, Chinese Academy of Sciences. His main research interests focus on land-atmosphere interactions. Recent publications include papers in Advances in Atmospheric Sciences, and Atmospheric and Oceanic Sciences Letters.
ZENG Xiao-Dong is a professor in the Institute of Atmospheric Physics, Chinese Academy of Sciences. His main research interests focus on the development of Dynamic Global Vegetation Model. Recent publications include papers in Advances in Atmospheric Sciences, Global biogeochemical cycles, Journal of Geophysical Research (Biogeosciences), and Tellus.
References
Asner, G. P., C. A. Wessman, D. S. Schimel, and S. Archer. 1998.“Variability in Leaf and Litter Optical Properties: Implications for BRDF Model Inversions Using AVHRR, MODIS, and MISR.”Remote Sensing of Environment 63: 243-257.
Bonan, G. B., D. Pollard, and S. L. Thompson. 1992. “Efects of Boreal Forest Vegetation on Global Climate.” Nature 359: 716-718.
Bonfls, C. J. W., T. J. Phillips, D. M. Lawrence, P. Cameron-Smith,W. J. Riley, and Z. M. Subin. 2012. “On the Infuence of Shrub Height and Expansion on Northern High Latitude Climate.” Environmental Research Letters 7: 015503. doi: http://dx.doi.org/10.1088/1748-9326/7/1/015503.
Bounoua, L., G. J. Collatz, S. O. Los, P. J. Sellers, D. A. Dazlich,C. J. Tucker, and D. A. Randall. 2000. “Sensitivity of Climate to Changes in NDVI.” Journal of Climate 13: 2277-2292.
Buermann, W., J. R. Dong, X. B. Zeng, R. B. Myneni, and R. E. Dickinson. 2001. “Evaluation of the Utility of Satellite-Based Vegetation Leaf Area Index Data for Climate Simulations.”Journal of Climate 14: 3536-3550.
Chapin, F. S., M. Sturm, M. C. Serreze, J. P. McFadden, J. R. Key,A. H. Lloyd, A. D. McGuire, et al. 2005. “Role of Land-Surface Changes in Arctic Summer Warming.” Science 310: 657-660.
Charney, J., P. H. Stone, and W. J. Quirk. 1975. “Drought in the Sahara: A Biogeophysical Feedback Mechanism.” Science 187: 434-435.
Dickinson, R. E., and A. Henderson-Sellers. 1988. “Modelling Tropical Deforestation: A Study of GCM Land-Surface Parametrizations.” Quarterly Journal of the Royal Meteorological Society 114: 439-462.
Dorman, J. L., and P. J. Sellers. 1989. “A Global Climatology of Albedo, Roughness Length and Stomatal Resistance for Atmospheric General Circulation Models as Represented by the Simple Biosphere Model (SiB).” Journal of Applied Meteorology 28: 833-855.
Hurrell, J. W., J. J. Hack, D. Shea, J. M. Caron, and J. Rosinski. 2008. “A New Sea Surface Temperature and Sea Ice Boundary Dataset for the Community Atmosphere Model.” Journal of Climate 21: 5145-5153.
IPCC. 2013. “Climate Change 2013: The Physical Science Basis.” In Contribution of Working Group I to the Fifth Assessment Report of the Intergovernmental Panel on Climate Change, edited by T. F. Stocker, D. Qin, G.-K. Plattner, M. Tignor, S. K. Allen,J. Boschung, A. Nauels, Y. Xia, V. Bex, and P. M. Midgley, 1535. Cambridge: Cambridge University Press.
Lawrence, D. M., K. W. Oleson, M. G. Flanner, P. E. Thornton,S. C. Swenson, P. J. Lawrence, X. B. Zeng, et al. 2011. “Parameterization Improvements and Functional and Structural Advances in Version 4 of the Community Land Model.”Journal of Advances in Modeling Earth Systems 3. 27 pp. doi: http://dx.doi.org/10.1029/2011MS000045.
Neale, R. B., J. Richter, S. Park, P. H. Lauritzen, S. J. Vavrus,P. J. Rasch, and M. H. Zhang. 2013. “The Mean Climate of the Community Atmosphere Model (CAM4) in Forced SST and Fully Coupled Experiments.” Journal of Climate 26: 5150-5168.
Notaro, M., and Z. Y. Liu. 2008. “Statistical and Dynamical Assessment of Vegetation Feedbacks on Climate over the Boreal Forest.” Climate Dynamics 31: 691-712.
Oleson, K. W., D. M. Lawrence, G. B. Bonan, M. G. Flanner,E. Kluzek, P. J. Lawrence, S. Levis, et al. 2010. Technical Description of Version 4.0 of the Community Land Model (CLM),NCAR Technical Note, NCAR/TN478+STR. Boulder: National Center for Atmospheric Research, 257.
Pielke, R. A., R. Avissar, M. Raupach, A. J. Dolman, X. B. Zeng, and A. S. Denning. 1998. “Interactions between the Atmosphereand Terrestrial Ecosystems: Infuence on Weather and Climate.” Global Change Biology 4: 461-475.
Sellers, P. J., Y. Mintz, Y. C. Sud, and A. Dalcher. 1986. “A Simple Biosphere Model (SiB) for Use within General Circulation Models.” Journal of the Atmospheric Sciences 43: 505-531.
Wang, A., and X. Zeng. 2009. “Improving the Treatment of the Vertical Snow Burial Fraction over Short Vegetation in the NCAR CLM3.” Advances in Atmospheric Sciences 26: 877-886. doi:http://dx.doi.org/10.1007/s00376-009-8098-3.
Zhu, J. W., and X. D. Zeng. 2015. “Comprehensive Study on the Infuence of Evapotranspiration and Albedo on Surface Temperature Related to Changes in the Leaf Area Index.”Advances in Atmospheric Sciences 32 (7): 935-942. doi: http://dx.doi.org/10.1007/s00376-014-4045-z.
Zhu, Z. C., J. Bi, Y. Z. Pan, S. Ganguly, A. Anav, L. Xu, A. Samanta,S. Piao, R. R. Nemani, and R. B. Myneni. 2013. “Global Data Sets of Vegetation Leaf Area Index (LAI)3g and Fraction of Photosynthetically Active Radiation (FPAR)3g Derived from Global Inventory Modeling and Mapping Studies (GIMMS)Normalized Diference Vegetation Index (NDVI3g) for the Period 1981 to 2011.” Remote Sensing 5: 927-948.
30 December 2015
CONTACT ZHU Jia-Wen zhujw@mail.iap.ac.cn
? 2016 The Author(s). Published by Informa UK Limited, trading as Taylor & Francis Group.
This is an Open Access article distributed under the terms of the Creative Commons Attribution License (http://creativecommons.org/licenses/by/4.0/), which permits unrestricted use, distribution, and reproduction in any medium, provided the original work is properly cited.
猜你喜歡
中學生數理化·八年級物理人教版(2022年3期)2022-03-16 05:55:08
鴨綠江(2021年35期)2021-04-19 12:24:18
當代陜西(2021年2期)2021-03-29 07:41:24
考試與評價·高一版(2020年6期)2020-11-02 02:45:24
中國生殖健康(2019年3期)2019-02-01 06:12:26
媽媽寶寶(2017年3期)2017-02-21 01:22:28
中國塑料(2016年3期)2016-06-15 20:30:00
通信電源技術(2016年3期)2016-03-26 07:13:38
鑿巖機械氣動工具(2016年3期)2016-03-01 04:00:25
海軍航空大學學報(2015年3期)2015-11-11 17:20:00
 Atmospheric and Oceanic Science Letters2016年4期
- Atmospheric and Oceanic Science Letters的其它文章
- Assessment of surface drag coefficient parametrizations based on observations and simulations using the Weather Research and Forecasting model
- A multidecadal oscillation in the northeastern Pacific
- Precipitation responses to radiative processes of water- and ice-clouds: an equilibrium cloud-resolving modeling study
- Cooling effect of urban parks and their relationship with urban heat islands
- The link between the Victoria mode in the preceding boreal winter and spring precipitation over the southeastern USA and Gulf of Mexico
- Biogenic isoprene emissions over China: sensitivity to the CO2inhibition effect