Modelling windwave driven by typhoon Chan-Hom(201509)in the East China Sea
2017-01-06 08:47:02ZhangNie
H.Q.Zhang,B.C.Nie
aKey Laboratory for Mechanics in Fluid Solid Coupling Systems,Institute of Mechanics,Chinese Academy of Sciences,Beijing 100190,China
bSchool of Engineering Science,University of Chinese Academy of Science,Beijing 100049,China
cSchool of Civil Engineering,Beijing Jiaotong University,Beijing 100044,China
Modelling windwave driven by typhoon Chan-Hom(201509)in the East China Sea
H.Q.Zhanga,b,?,B.C.Niec
aKey Laboratory for Mechanics in Fluid Solid Coupling Systems,Institute of Mechanics,Chinese Academy of Sciences,Beijing 100190,China
bSchool of Engineering Science,University of Chinese Academy of Science,Beijing 100049,China
cSchool of Civil Engineering,Beijing Jiaotong University,Beijing 100044,China
H I G H L I G H T S
·Discussed anisotropic energy dissipation in the wave propagation direction.
·The new modified model to simulate and forecast wave evolution caused by Chan-Hom(201509).
·Discussed typical wave parameters near Donghai Bridge.
A R T I C L E I N F O
Article history:
Received 2 November 2016
Received in revised form
4 November 2016
Accepted 4 November 2016
Available online 17 November 2016
Windwave
Wave dissipation
Saturation spectrum
Significant wave height
Typhoon
Typhoon-generated waves pose a serious threat to the development of offshore wind power;therefore typical wave parameters caused by typhoon near Donghai Bridge,a demonstration area of offshore wind farm,were analysed.We pay particular attention to the dissipation term which is one of the source terms of governing equation for windwave evolution in WAVEWATCH III.Anisotropic energy dissipation in the wave propagation direction is considered and further applied in our model.A good agreement is observed by comparison with in situ data.Furthermore,the new improved model is used to simulate and forecast wave evolution caused by Chan-Hom(201509).The evolution of typical wave parameters i.e.significant wave height and mean wave period were discussed in the East China Sea,especially near Donghai Bridge.
?2016 The Authors.Published by Elsevier Ltd on behalf of The Chinese Society of Theoretical and Applied Mechanics.This is an open access article under the CC BY-NC-ND license(http:// creativecommons.org/licenses/by-nc-nd/4.0/).
Air–sea interaction is one of the important fluid dynamical processes which mediate exchanges of momentum,heat,and gases between atmosphere and ocean[1].On the other hand, rouge waves generated by wind have profound implications for the design,placement,and safety of offshore wind power system.Based on these considerations,in this paper,we primarily explore the classical problem of windwave especially for typhoongenerated waves that occur in the East China Sea,where a few marine wind farms are under construction now.The study on the wave spectrum forecast made great progress and developed from the first generation to the third generation.Numerical method and source terms are continuously improved and modified.In these source terms,one of the least known is the dissipation term.Phillips[2]thought that in the balance equation,the wind term,the wave–wave interaction,and the dissipation term are all important.Balanced by wave–wave interactions,the dissipation term is the cube of‘saturation’.Later results showed that the wave breaking has an obvious critical value.Banner et al.[3]found that there is a relationship between wave breaking probability and saturation spectrum,and wave breaking happened when saturation level exceeds a certain threshold.Ardhuin et al.[4] further supposed that energy dissipation caused by wave breaking are in proportion to probability and dimension of the wave breaking,and so energy dissipation by wave breaking is expressed as

Total wave energy or wave action is conservation which gives the balance equation for the wave action density spectrumNas Eq.(2)in the spherical coordinate system.
whereRis the radius of the earth;λandφare the longitude and latitude,respectively;UλandUφare current components;θis the wave travelling direction in the Cartesian definition,andθ=0 corresponds to waves travelling from west to east;kandcgare wavenumberandgroupvelocity,respectively;andσistherelative frequency observed in a frame of reference moving with the mean current.
The source termSat the right hand of the equation consists of four parts,an energy input termSin,a nonlinear wave–wave interactions termSnl,a dissipation termSds,and a bottom friction termSbot.

By analysing the source terms,we primarily focus on the term ofSdsas it plays a major role in the balance and is not well understood thus far.The dissipation termSdsin the source terms due to wave breaking are generally considered as a combination of the saturation-based termthe wave–turbulence interaction termand other dissipation termsas follows:

whereSis the saturation level;CifandChfare switch coefficients of unsaturation and saturation terms,respectively.
The saturation-based term related to the spectral density, breaking probability and breaking severity is parameterized by the saturation spectrum,as shown in Eq.(1).In the past,the saturation spectrum is usually assumed independent of wave propagation direction.
However,recent research shows that energy dissipation due to wave breaking is anisotropic in the wave propagation direction. Thus we integrate the direction-weighted saturation spectrumexpressed as Eq.(5)into the windwave predicting model expecting to improve its accuracy.
據(jù)《2017年歐盟產(chǎn)業(yè)研發(fā)投入記分牌》[8]報(bào)告對(duì)全球研發(fā)投入排名前2 500家企業(yè)(占全球企業(yè)研發(fā)總投入90%以上)所做的調(diào)查,2016年,全球企業(yè)研發(fā)投入連續(xù)6年保持增長(zhǎng),總額達(dá)7 416億歐元,同比增長(zhǎng)5.8%,遠(yuǎn)高于其凈銷售額0.1%的增長(zhǎng)幅度。

Fig.1.History of the significant wave height at station(12.10°E,34.45°N).The open square is in situ data from Ref.[10].

whereF(f,θ′)is the wave’s spectral density over frequenciesfand directionsθ′;pwas suggested to take 2 which is related to the maximum orbital velocity in directionθfor waves with frequencies close tof.
Considering the effect of wave direction on energy dissipation caused by wave breaking,in this paper,new definition of saturation spectrum expressed by Eq.(6)is applied in WAVEWATCH III.
Muifa(201109)is chosen to validate our new model.The target typhoon formed as a tropical depression over the Western Pacific Ocean on July 25,2011,and then strengthened to a super typhoon by the end of the month.It came to the East China Sea on August 5,and landed North Korea on August 9.Thus,we studied the windwave of the East China Sea in 5 days since August 5.Our results are validated with significant wave heights from three observation stations:(120.10°E,34.45°N),(126.02°E,37.23°N), and(125.77°E,36.25°N),hereinafterreferredtoasSI,SIIandSIII.As an example,the comparisons of significant wave height between in-situ SI data and our model are illustrated in Fig.1,which shows that the maximum significant wave heights are 2.18 m(in situ) and 2.54 m(our model).Comparing with the in situ data,our result has a sight phase delay.That is caused by the wind data updating delay in our computing,since the wind data we used is the remotely sensed wind field data from NASA’s cross-calibrated, multi-platform ocean surface wind velocity project with time resolution six hours.The maximum significant wave heights at SII and SIII are 4.58 m(in situ)and 6.95 m(our results)and 3.86m(insitu)and5.97m(ourresults),respectively.Thedeviation between simulation and observations,i.e.the significant wave heights of simulation seem larger than the in situ observation, are in fact in the allowable tolerance.Because mechanisms of wave dissipation in inshore water,where those three observation stations located,are quite complicated due to the nonlinear effect in wave breaking and bottom friction.Moreover,the effects such as reflection,refraction,and wave–current interaction will also become significant in those regions.In addition,wind field and bathymetry data in inshore waters seems somewhat coarser due to land terrain effect and large bathymetry slope.
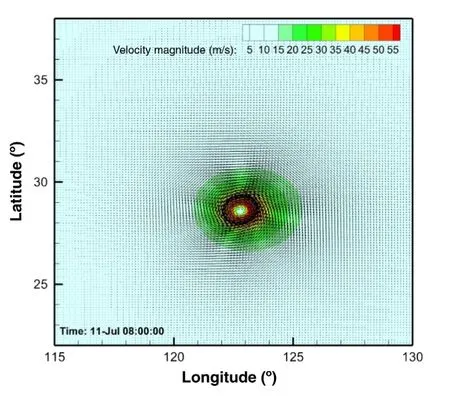
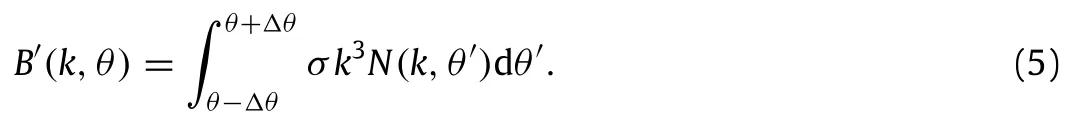
Fig.2.Wind field caused by Chan-Hom at 08:00:00,July 11.
Chan-Hom(201509)formed on June 29,2015 from a westerly wind burst on the Northern Pacific Ocean.It headed northwest and intensified into a typhoon on July 7 before passing between the Japanese islands of Okinawa and Miyako-jima,and it reached the peak winds of 165 km/h two days later.The wind speed of typhoons hit China coast often decayed greatly during their way to China Seas.However,the wind speed of Chan-Hom was still as high as 130 km/h when it struck the coast of Zhejiang on July 11. Then it turned to north crossing the East China Sea and Yellow Sea, and made landfall on the Korean Peninsula on July 13 finally.Since the East China Sea is the region of interest,the geographical area considered in this analysis is formed by a rectangle covering those areas.Its four corners being assigned at the most northerly,the mostsoutherly,thewesternmost,andthemosteasterlypointsare: 38.00°N,22.00°N,115.00°E,and 130.00°E.Based on the track,our analysis period lasts from 02:00:00 of July 8 to 22:00:00 of July 12.
The Bathymetry data is retrieved from the National Centers for Environment Information,which belongs to National Oceanic and Atmospheric Administration.In this analysis,ETOP01,a 1 arcminute global relief model of Earth’s surface,was utilized.
The wind field caused by Chan-Hom was reconstructed based onthetropicalcyclonemodel[11,12].Inthetropicalcyclonemodel we used,wind field v is decomposed into three components: tangential wind speed vT,radial wind speed vR,and environmental scale wind velocity vEas expressed by Eq.(7).

We here only present the final expressions of those three components,for the details one may refer to Ref.[12].vT,vR, and vEare given as Eqs.(8)–(10)with vector marks omitted for convenience.

whereVmis the maximal wind velocity,U0is the translation velocity of the cyclone.RGis the length scale of the environmental scale processes of order of 500 km,ris the distance form tropical cyclonecentre.Risr/RM,whereRMistheradiustomaximumwind speed.As for the coefficientsB,Candk,we took the typical valuesB=1.5,C=0.013,andk=0.16 as suggested by Jakobsen and Madsen[12].aequals tofRM/(2Vm),wherefis the Coriolis parameter related to latitude.
Using the aforementioned tropical cyclone model,wind field can be obtained once the maximal wind velocity and location of tropical cyclone centre are given.In this analysis,the maximal wind velocity and location were retrieved from the joint typhoon warning center(JTWC),a joint United States Navy.Its time resolution is 6 h during the life cycle time of Chan-Hom.As a demonstration,the wind field at 08:00:00 July 11 is presented as Fig.2.From which,the eye of Chan-Hom and the asymmetric wind vectors due to translation heading northwest are quite straightforward.
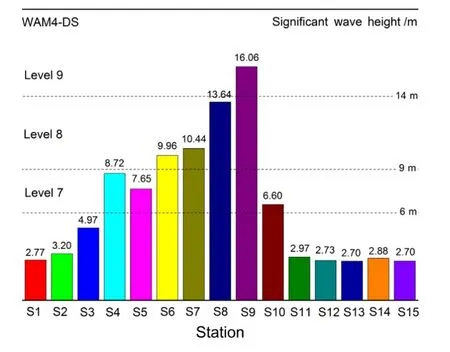
Fig.3.Maximal significant wave heights at observation stations in Chan-Hom life cycle.S1–S15 are the observation stations located along China coast from the Taiwan Strait to the Shandong Peninsula.

Fig.4.History of significant wave heights at S5 to S9.The observation stations S5 to S9 are Zhoushan,Daishan,Chengshan,Dajishan,and Sheshan,respectively.The horizontal and vertical axes are time from 24:00:00 July 9 to 00:00:00 July 13 and significant wave height,respectively.
The maximal significant wave heights of fifteen stations along China coast from the Taiwan Strait to the Shandong Peninsula were observed.The observation stations are Pingtan(120.190°E,25.49°N),Beishuang(120.830°E,26.71°N),Nanlu (121.580°E,27.46°N),Dachen(122.500°E,28.46°N),Zhoushan (123.040°E,29.87°N),Daishan(123.000°E,30.27°N),Chengshan (123.460°E,30.73°N),Dajishan(122.950°E,30.83°N),Sheshan (122.810°E,31.52°N),Waikejiao(122.180°E,33.02°N),Binhai (120.780°E,34.28°N),Lianyungang(119.860°E,34.79°N),Qianliyan(121.960°E,36.25°N),Chengshantou(123.36°E,37.38°N), Penglai(121.20°E,37.86°N),which are referred to as S1–S15,respectively,hereinafter.
As shown in Fig.3,the maximal significant wave heights of S1–S3(at nearshore of provinces Fujian and southern Zhejiang) and S11–S15(at nearshore of provinces Shandong and Jiangsu)are all below 6 m,since those stations are a little bit far away from the typhoon track.While the maximal significant wave heights of S6–S9,i.e.Daishan station,Chengshan station,Dajishan station and Sheshan station,are all above 9 m,in which S9 reaches 16.06 m.Those stations sit at the nearshore of Shanghai and northern Zhejiang,just on the track(see Fig.5).Besides,the wind speed is still as high as 130 km/h when Chan-Hom passing this region.

Fig.5.Distribution and evolution of significant wave heights.Subfigure(a)–(f)are for different moments:(a)18:00 July 8,(b)06:00 July 9,(c)18:00 July 9,(d)06:00 July 10,(e)06:00 July 11,(f)06:00 July 12.The solid line is track of Chan-Hom.
To be more specific,the histories of significant wave height of S5–S9 are presented as shown in Fig.4.Significant wave heights rise sharply at morning of July 10 and decay at July 12,it is coincident with the arriving and leaving time of Chan-Hom for those stations.Histories of significant wave height in Fig.4 are not single peak curves,i.e.two peaks exist for each curve roughly.The‘twopeaks’phenomenoncanbeexplainedas:themaximumwind speed radius,the eye and the maximum wind speed radius will pass those stations in sequence because they are just on the track of the eye.
In addition,the distribution/evolution of significant wave heights(see Fig.5)and mean wave periods(see Fig.6)are presented.Figure 5 shows that the maximum significant wave height moves forward along the typhoon track.The shape of area with large significant wave height,say significant wave height above 8 m,seems more slender comparing with the elliptic wind field.This tailing effect is due to wave dissipation is much gentler comparing with the sharp growth by the strong driven wind because of lack of intense dissipation force.From Fig.5(d)and (e),we can say significant wave height is strongly affected by bathymetry through wave breaking and bottom friction.As for the mean wave period(see Fig.6(d)and(e)),short mean wave period (<10 s)is in the high wind speed area where wave in the growth stage.While the mean wave period of mature wave in Yellow Sea is about 20 s(see Fig.6(e)).When the maximum wind speed decreased to 90 km/h on 06:00 July 12 as shown in Fig.6(f),mean wave periods are all below 15 s.
In this paper,we preliminarily examine the wind generated waves in the East China Sea using a theoretical model which considers the directional behaviours of the spectral dissipation.In comparisonofnumericalsimulationwithinsitudata,basically,the model is shown to be reasonable.In the future,more in situ data is desired to further validate the model.In addition,the influences of other source terms are planned to be explored in more detail.
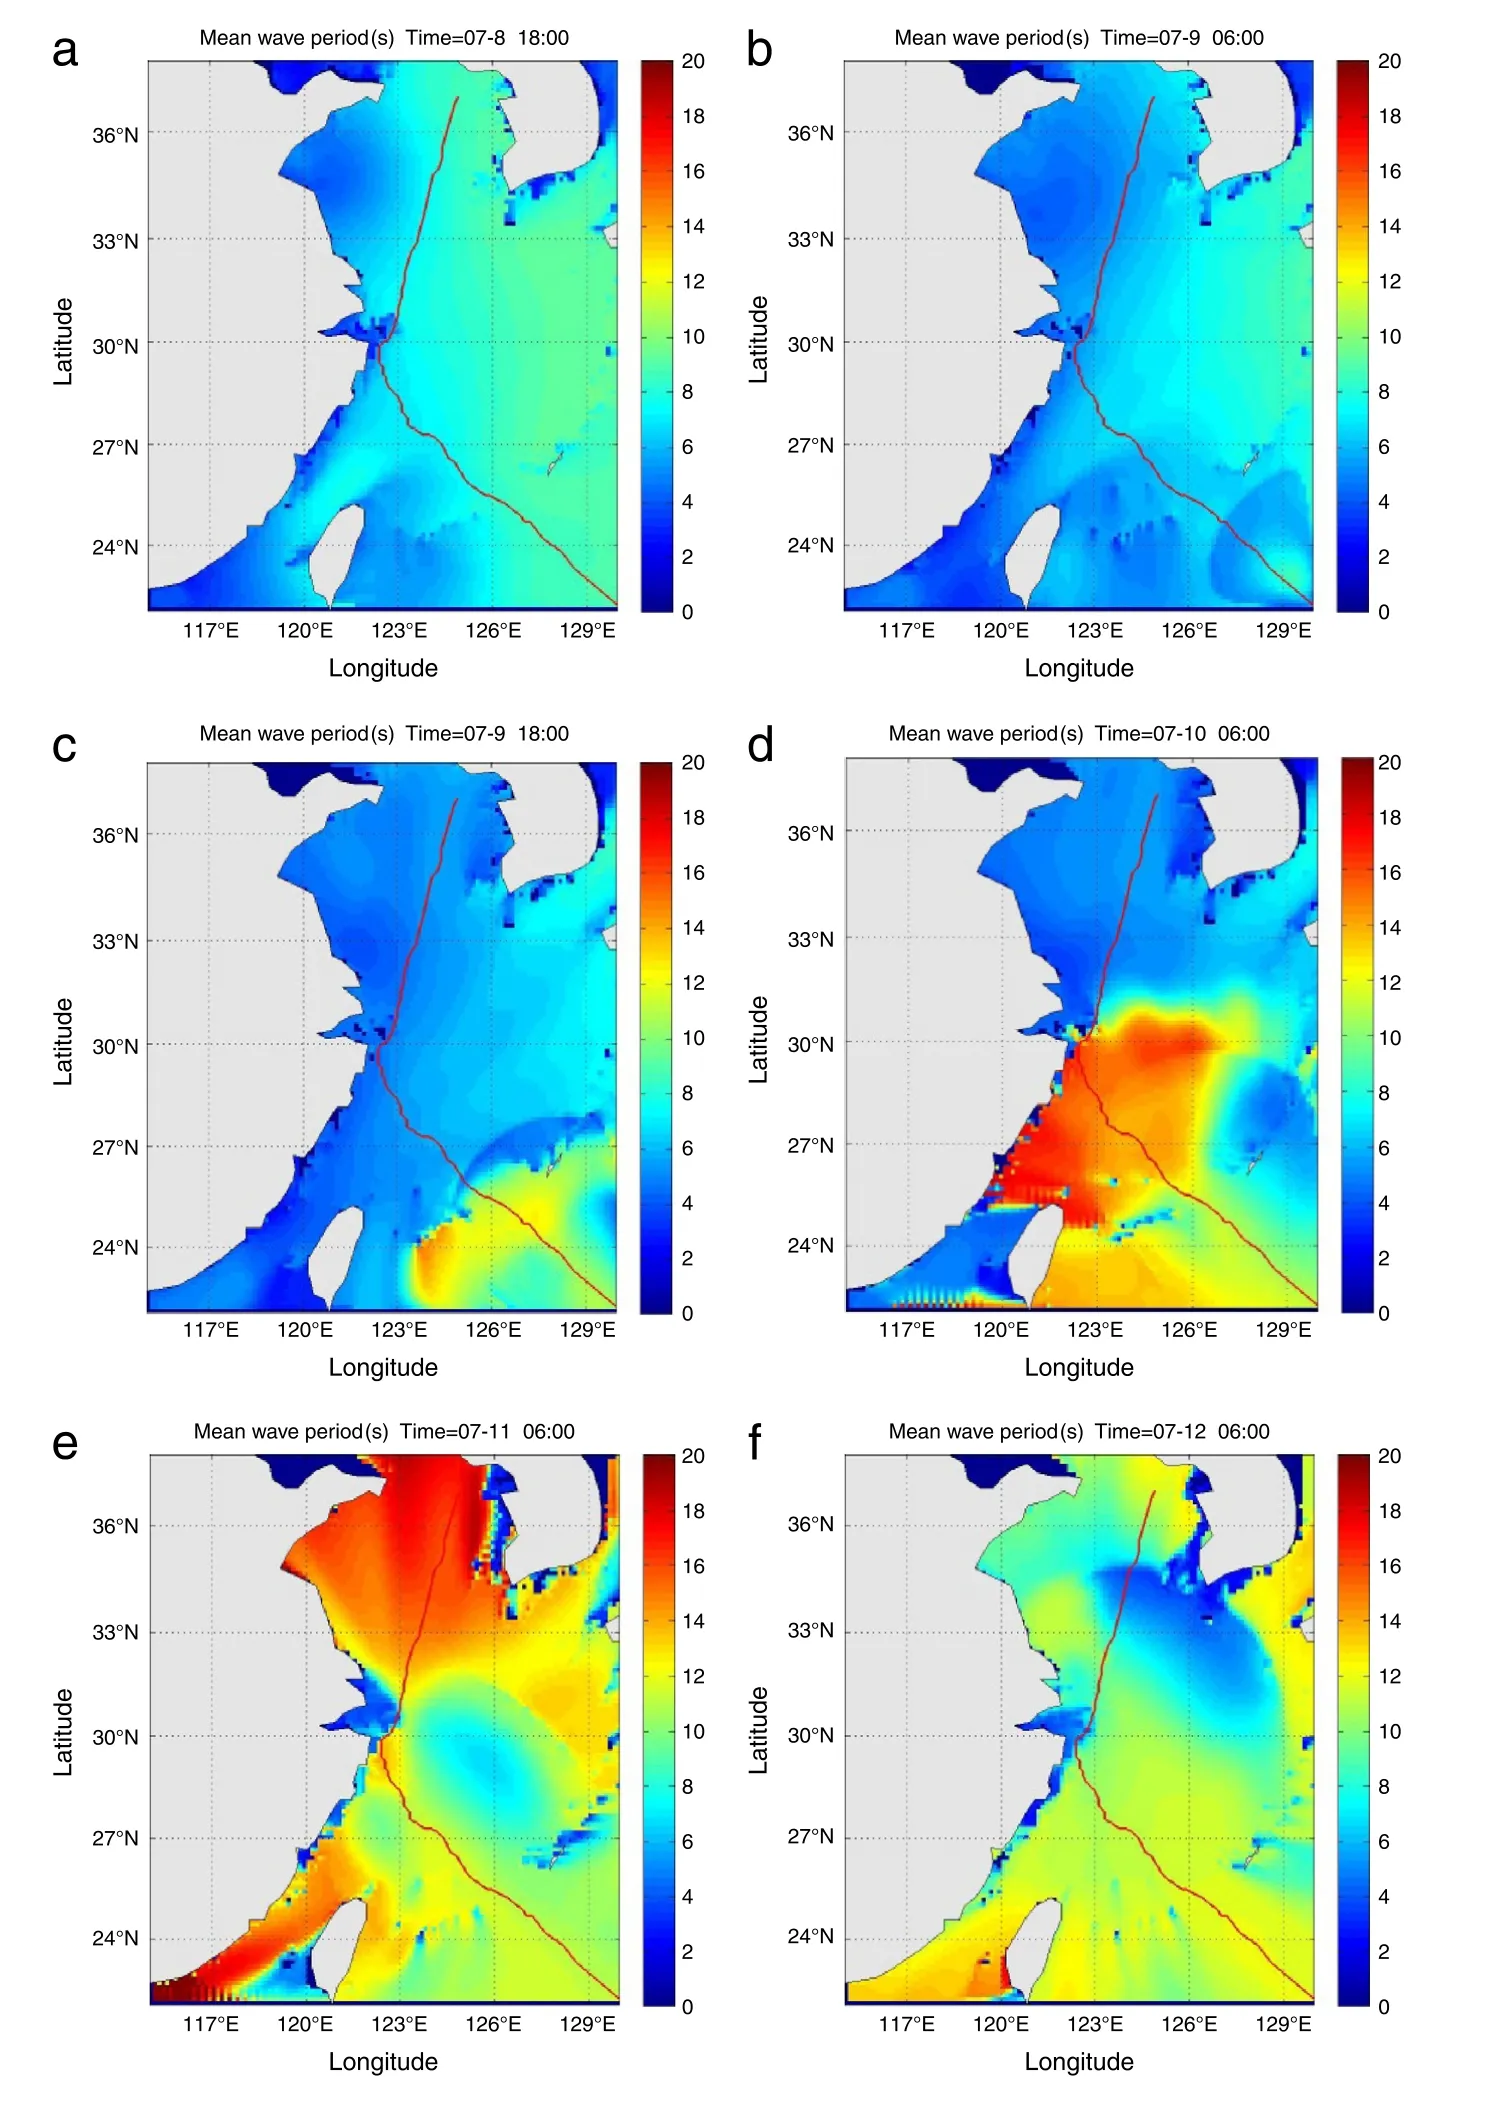
Fig.6.Distribution and evolution of mean wave period.Subfigure(a)-(f)are for different moments:(a)18:00 July 8,(b)06:00 July 9,(c)18:00 July 9,(d)06:00 July 10, (e)06:00 July 11,(f)06:00 July 12.The solid line is track of Chan-Hom.
Acknowledgements
This work was supported by the National Science Foundation for the Youth of China(11102212)and the State Key Program of National Science of China(11232012).The authors would like to extend our sincere gratitude to Prof. Jiachun Li and Dr. Lizhen Wang for their instructive advice and useful suggestion on this study.
[1]Z.F.Zhang,J.C.Li,Numerical simulation of momentum heat and moisture transfer on air-sea interface,J.Hydrodyn.16(2001)119(in Chinese).
[2]O.M.Philips,Spectral and statistical properties of the equilibrium range in wind-generated gravity waves,J.Fluid Mech.156(1985)505–531.
[3]M.L.Banner,A.V.Babanin,I.R.Young,Breakingprobabilityfordominantwaves on the sea surface,J.Phys.Oceanogr.30(2000)3145–3160.
[4]F.Ardhuin,F.Collard,B.Chapron,et al.Spectral wave dissipation based on observations:a global validation,Proceedings of Chinese-German Joint Symposium on Hydraulics and Ocean Engineering,Darmstadt,Germany, (2008)391–400.
[5]F. Ardhuin, A. Le Boyer, Numerical modeling of sea states: validation of spectral shapes, Navigation 54 (2006) 55–71 (in French).
[6]M.L.Banner,J.R.Gemmrich,D.M.Farmer,Multiscale measurement of ocean wave breaking probability,J.Phys.Oceanogr.32(2002)3364.
[7]I.R Young,A.V.Babanin,Spectral distribution of energy dissipation of windgenerated waves due to dominant wave breaking,J.Phys.Oceanogr.36(2006) 376.
[8]F.Ardhuin,E.Rogers,A.Babanin,et al.,Semi-empirical dissipation source functions for wind-wave models:part I,definition,calibration and validation, J.Phys.Oceanogr.40(2010)1917.
[9]L.Z.Wang,Study on Extreme Marine Environment and the Safety of Offshore Platforms(Doctoral dissertations),2011(in Chinese).
[10]H.Hou,Y.Chen,C.Zhang,Numerical simulation of typhoon waves along Jiangsu coast,Port Waterway Eng.478(2013)13.(in Chinese).
[11]G.D.Hubbert,G.J.Holland,L.M.Leslie,et al.,A real-time system for forecasting tropical cyclone storm surges,Weather Forecast.6(1991)86–97.
[12]F.Jakobsen,H.Madsen,Comparison and further development of parametric tropical cyclone models for storm surge modelling,J.Wind Eng.Ind.Aerodyn. 92(2004)375–391.
?Corresponding author.
E-mail address:zhanghuiqin@imech.ac.cn(H.Q.Zhang).
http://dx.doi.org/10.1016/j.taml.2016.11.003
2095-0349/?2016 The Authors.Published by Elsevier Ltd on behalf of The Chinese Society of Theoretical and Applied Mechanics.This is an open access article under the CC BY-NC-ND license(http://creativecommons.org/licenses/by-nc-nd/4.0/).
*This article belongs to the Fluid Mechanics
猜你喜歡
當(dāng)代水產(chǎn)(2022年8期)2022-09-20 06:44:30
當(dāng)代水產(chǎn)(2022年6期)2022-06-29 01:11:44
當(dāng)代水產(chǎn)(2022年5期)2022-06-05 07:55:06
當(dāng)代水產(chǎn)(2022年3期)2022-04-26 14:27:04
當(dāng)代水產(chǎn)(2022年2期)2022-04-26 14:25:10
云南畫報(bào)(2020年9期)2020-10-27 02:03:26
南方人物周刊(2017年32期)2017-10-28 22:48:36
南風(fēng)窗(2016年26期)2016-12-24 21:48:09
南風(fēng)窗(2015年22期)2015-09-10 07:22:44
南風(fēng)窗(2015年14期)2015-09-10 07:22:44
 Theoretical & Applied Mechanics Letters2016年6期
- Theoretical & Applied Mechanics Letters的其它文章
- A large eddy simulation of flows around an underwater vehicle model using an immersed boundary method
- Sufficiently diffused attachment of nitrogen arc by gasdynamic action
- Numerical simulation of Gurney flap on SFYT15thick airfoil
- On transition of type V interaction in double-wedge flow with non-equilibrium effects
- On the role of piezoelectricity in phonon properties and thermal conductivity of GaN nanofilms
- Coriolis effect on responses of rotating thin piezoelectric hollow cylinder