Effects of urban grass coverage on rainfall-induced runoff in Xi'an loess region in China
2017-02-01 08:50:05JingLiZhanbinLiMengjingGuoPengLiShengdongCheng
Water Science and Engineering
2017年4期
Jing Li,Zhan-bin Li,Meng-jing Guo*,Peng Li,Sheng-dong Cheng
State Key Laboratory Base of Eco-Hydraulic Engineering in Arid Areas,Xi'an University of Technology,Xi'an 710048,China
1.Introduction
In the process of urbanization,natural vegetation and agricultural land are being replaced by urban impervious land(Dobbs et al.,2014;Morse et al.,2003;Robinson and Lundholm,2012;Savva et al.,2010;Wang et al.,2001).The increase in urban impervious land surface results in drastic changes in urban hydrology,such as an increase in total rainfall-induced runoff,a sharp increase in peakflow,and an earlier occurrence of theflood peak(Fletcher et al.,2013;Han and Burian,2009;Jacobson,2011;Miller et al.,2014).These phenomena have intensified the threat of urban storm floods,and the world has become more concerned with the resulting urban waterlogging issues.
In view of these problems,many scholars suggest that priority be given to the development of eco-friendly sponge cities(Argent et al.,2008;Juncosa et al.,2007;Liu et al.,2016).The improvement of urban ecology is closely related to the full play of various types of urban vegetation(Mason et al.,2010;Mitchell et al.,2016;Scholz and Yazdi,2009;Sheets and Manzer,1991).As a kind of natural osmosis mechanism,urban vegetation not only collects and stores rain water and increases soil infiltration,but also reduces flood peak discharge,delaysflood peak occurrence,and mitigates urban waterlogging(Cerdˋa,2001;Dwivedi and Sreenivas,2002;Li,2012;Piekarczyk et al.,2012;Zhao et al.,2004).Studying the regulatory effects of urban vegetation on rainfallinduced runoff is highly significant to preventing urban waterlogging and utilizingflood water.
Many studies have been conducted on the relationship between urban vegetation and rainfall-runoff processes,andnumerous achievements have been made.For example,hydrological models have been used to study factors in urban rainfall-runoff processes(Cuo et al.,2010;Jacobson,2011;Yang and Wang,2014;Yu and Lane,2006;Zoppou,2001),the effects of urban land use on rainfall-runoff processes,the effects of the type and coverage of vegetation on rainfallrunoff processes(Blanco et al.,2004;Dunne et al.,1991;Marques et al.,2007;Pan and Shangguan,2006),the relationship between vegetation surface runoff and rainfall intensity,and the control of urban storm floods(Cerdˋa et al.,2016;Ellis et al.,2012;Melville and Morgan,2006;Pitt et al.,2008;Susca et al.,2011).However,most of these studies have focused on rainy and wet regions and few on arid regions where water resources are relatively deficient.
In this study,a total of 80 grass blocks,each sized 0.5 m×0.5 m×0.5 m,were taken from a well-grown grass slope in the eastern suburban area of Xi'an City in Shannxi Province of China and sent to a laboratory for rainfall simulation experiments in order to investigate the effects of urban grass coverage on rainfall-runoff processes.The main purposes of the study were(1)to analyze the runoff and infiltration processes of urban land covered with vegetation at different coverage ratios,(2)to investigate the regulatory effects of grass coverage on rainfall-runoff processes,and(3)to analyze the effects of grass coverage on theflood peak discharge and occurrence time of theflood peak.This study was carried out to provide a scientific basis for storm flood control in cities in arid regions.
2.Materials and methods
2.1.Experimental materials
Experimental loess was taken from the eastern suburban area of Xi'an City.Soil samples were dried,screened,and purified,with the moisture content and dry bulk density limited to around 11%and 1.30 g/cm3,respectively.The wellgrown manilagrass with root systems was sampled from thefield,and sent to the laboratory for one-week curing before use.Grass blocks sized 0.5 m×0.5 m×0.5 m were used in the experiment.
2.2.Experiment design
In rainfall simulation experiments,the rainfall intensity and slope gradient were determined to be 2.0 mm/min and 21°,respectively.Four grass coverage ratios were used in the experiment:0%(bare slope),25%,50%,and 75%.Several vegetation patterns were selected,depending on the position of vegetation and grass coverage ratio,with the 25%coverage ratio scenario including four patterns(L1,IL1,IU1,and U1),the 50%coverage ratio scenario includingfive patterns(L2,M2,U2,IL2,and IU2),and the 75%coverage ratio scenario including two patterns(L3 and U3),as shown in Fig.1.
The experimental soil bin was 4 m long,1 m wide,and 0.8 m high.Each soil bin was divided into four grids,each having a plane size of 1 m×1 m.Before the experiment,a 20 cm-thick natural sand layer was laid at the bottom of the soil bin to ensure that the soil permeability was uniform and close to the natural state.Subsequently,experimental soil and grass blocks with a thickness of 50 cm were laid on the sand layer to form different vegetation patterns,as shown in Fig.1.Gaps between soil and grass blocks werefilled with soil that was compacted to prevent the grass blocks from sliding during rainfall.
Twelve rainfall simulation experiments were conducted for the twelve vegetation patterns(L0,L1,IL1,IU1,U1,L2,M2,U2,IL2,IU2,L3,and U3).In the experiment,rainfall was produced using tap water from lateral jets,4 m above the ground.Rainfall drops(with a median diameter of 2.2 mm)followed a parabolic trajectory and fell vertically to the soil surface nearly at the terminal velocity with a controllable intensity and a uniformity of over 85%.The rainfall lasted for more than 60 min in each run.Plastic containers with a volume of 20 L were used to collect the runoff output from the soil bins at a 1-min interval.
3.Results and discussion
3.1.Runoff process
As shown in Fig.2,runoff gradually increases as rainfall continues,and the runoff generation from the slope in scenarios with grass coverage is lower than that in the bare slope scenario.
At a 25%coverage ratio,the initial runoffs of the vegetation patterns L1,IL1,IU1,and U1 were 2.44 L,1.05 L,1.99 L,and 2.14 L,respectively,showing small differences between one another.However,the influence of the vegetation pattern on the reduction of runoff varies greatly.During each run of the rainfall simulation experiments,the total runoff from the slope for different vegetation patterns decreases in the order of U1,IU1,IL1,and L1,indicating that the vegetation pattern with the area of grass coverage located at the lower part of the slope reduces runoff generation more than other patterns(Fig.2(a)).
At a 50%coverage ratio,the total runoff from the slope decreases in the order of U2,IU2,M,IL2,and L2,also indicating that the vegetation pattern with the area of grass coverage located at the lower part of the slope controls runoff generation more than other patterns.In general,the controlling effect at a 50%coverage ratio is better than that at a 25%coverage ratio.Nevertheless,the runoff process at a 50%coverage ratio seems chaotic and lacks regularity(Fig.2(b)).
不僅如此,通過對于個人所得稅的征收制度的研究能夠看出,我們國家使用的就是以個人當作納稅單位的分項所得稅制度,這樣的一種制度根據不同征稅項目計算以及納稅方面選擇源泉扣繳的措施,如此可以充分顯示出稅收效率所存在的優勢,進而更好地進行管理以及控制。不過把個人當作納稅單位的分項所得稅制的主要問題就是公平性較低,僅僅可以顯示出單個項目,很難顯示出個人所有收入項目的整體負擔能力,并且會忽視掉所存在的家庭因素。
At a 75%coverage ratio,the total runoffs from the slope were 171.13 L and 193.55 L for vegetation patterns L3 and U3,respectively,during each run of the rainfall simulation experiments,indicating the better effect of pattern L3 on the reduction of runoff than that of pattern U3(Fig.2(c)).Compared with 25%and 50%coverage ratios,there is a significant reduction of slope runoff at a 75%coverage ratio.
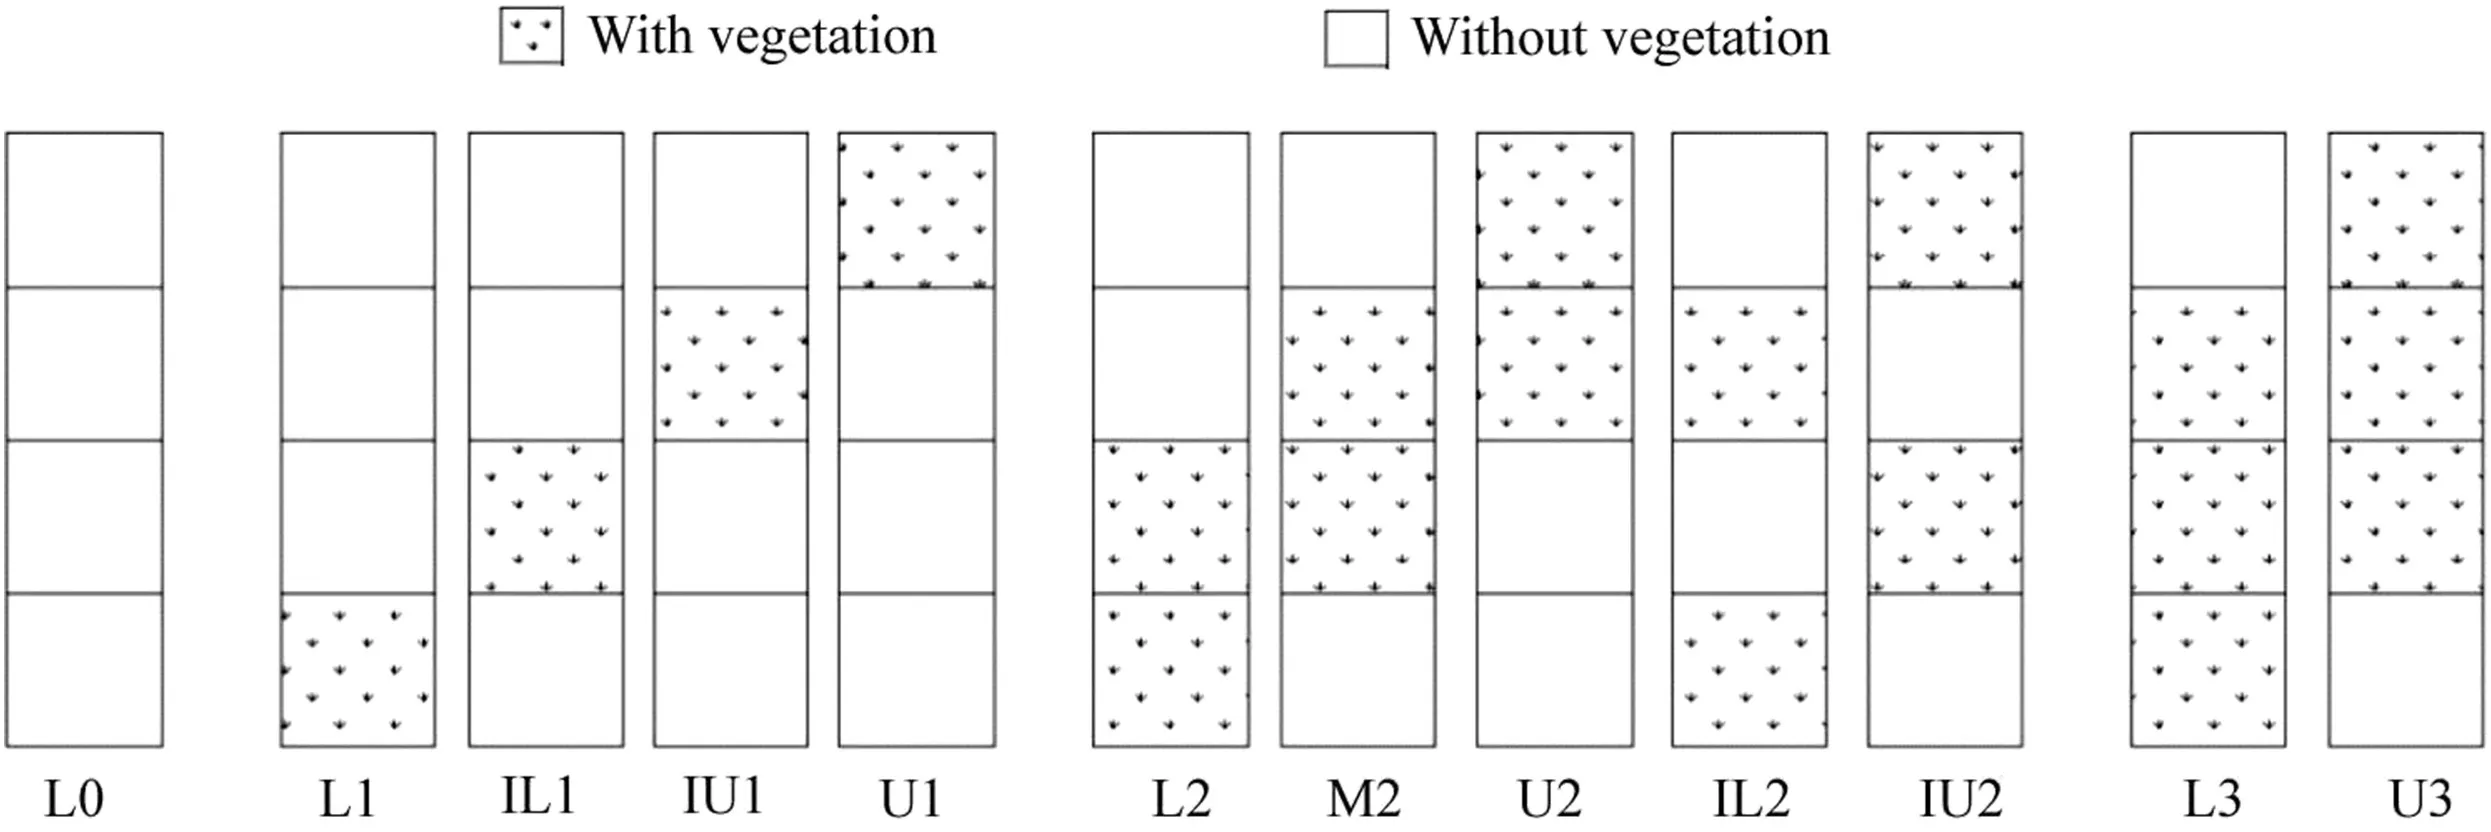
Fig.1.Schematic diagram of vegetation patterns with lowest and highest grids corresponding to bottom and top of slope.
At 0%coverage ratio(bare slope),the total runoff from the slope was 352.55 L.The average values were 250.58 L,221.59 L,and 182.34 L at 25%,50%,and 75%coverage ratios,respectively.Compared with the bare slope scenario,the average total runoffs at 25%,50%,and 75%coverage ratios decreased by 101.97 L,130.96 L,and 170.21 L,respectively.The total runoff from the slope decreases with theincrease of the grass coverage ratio,meaning that grass coverage can help to reduce runoff generation.
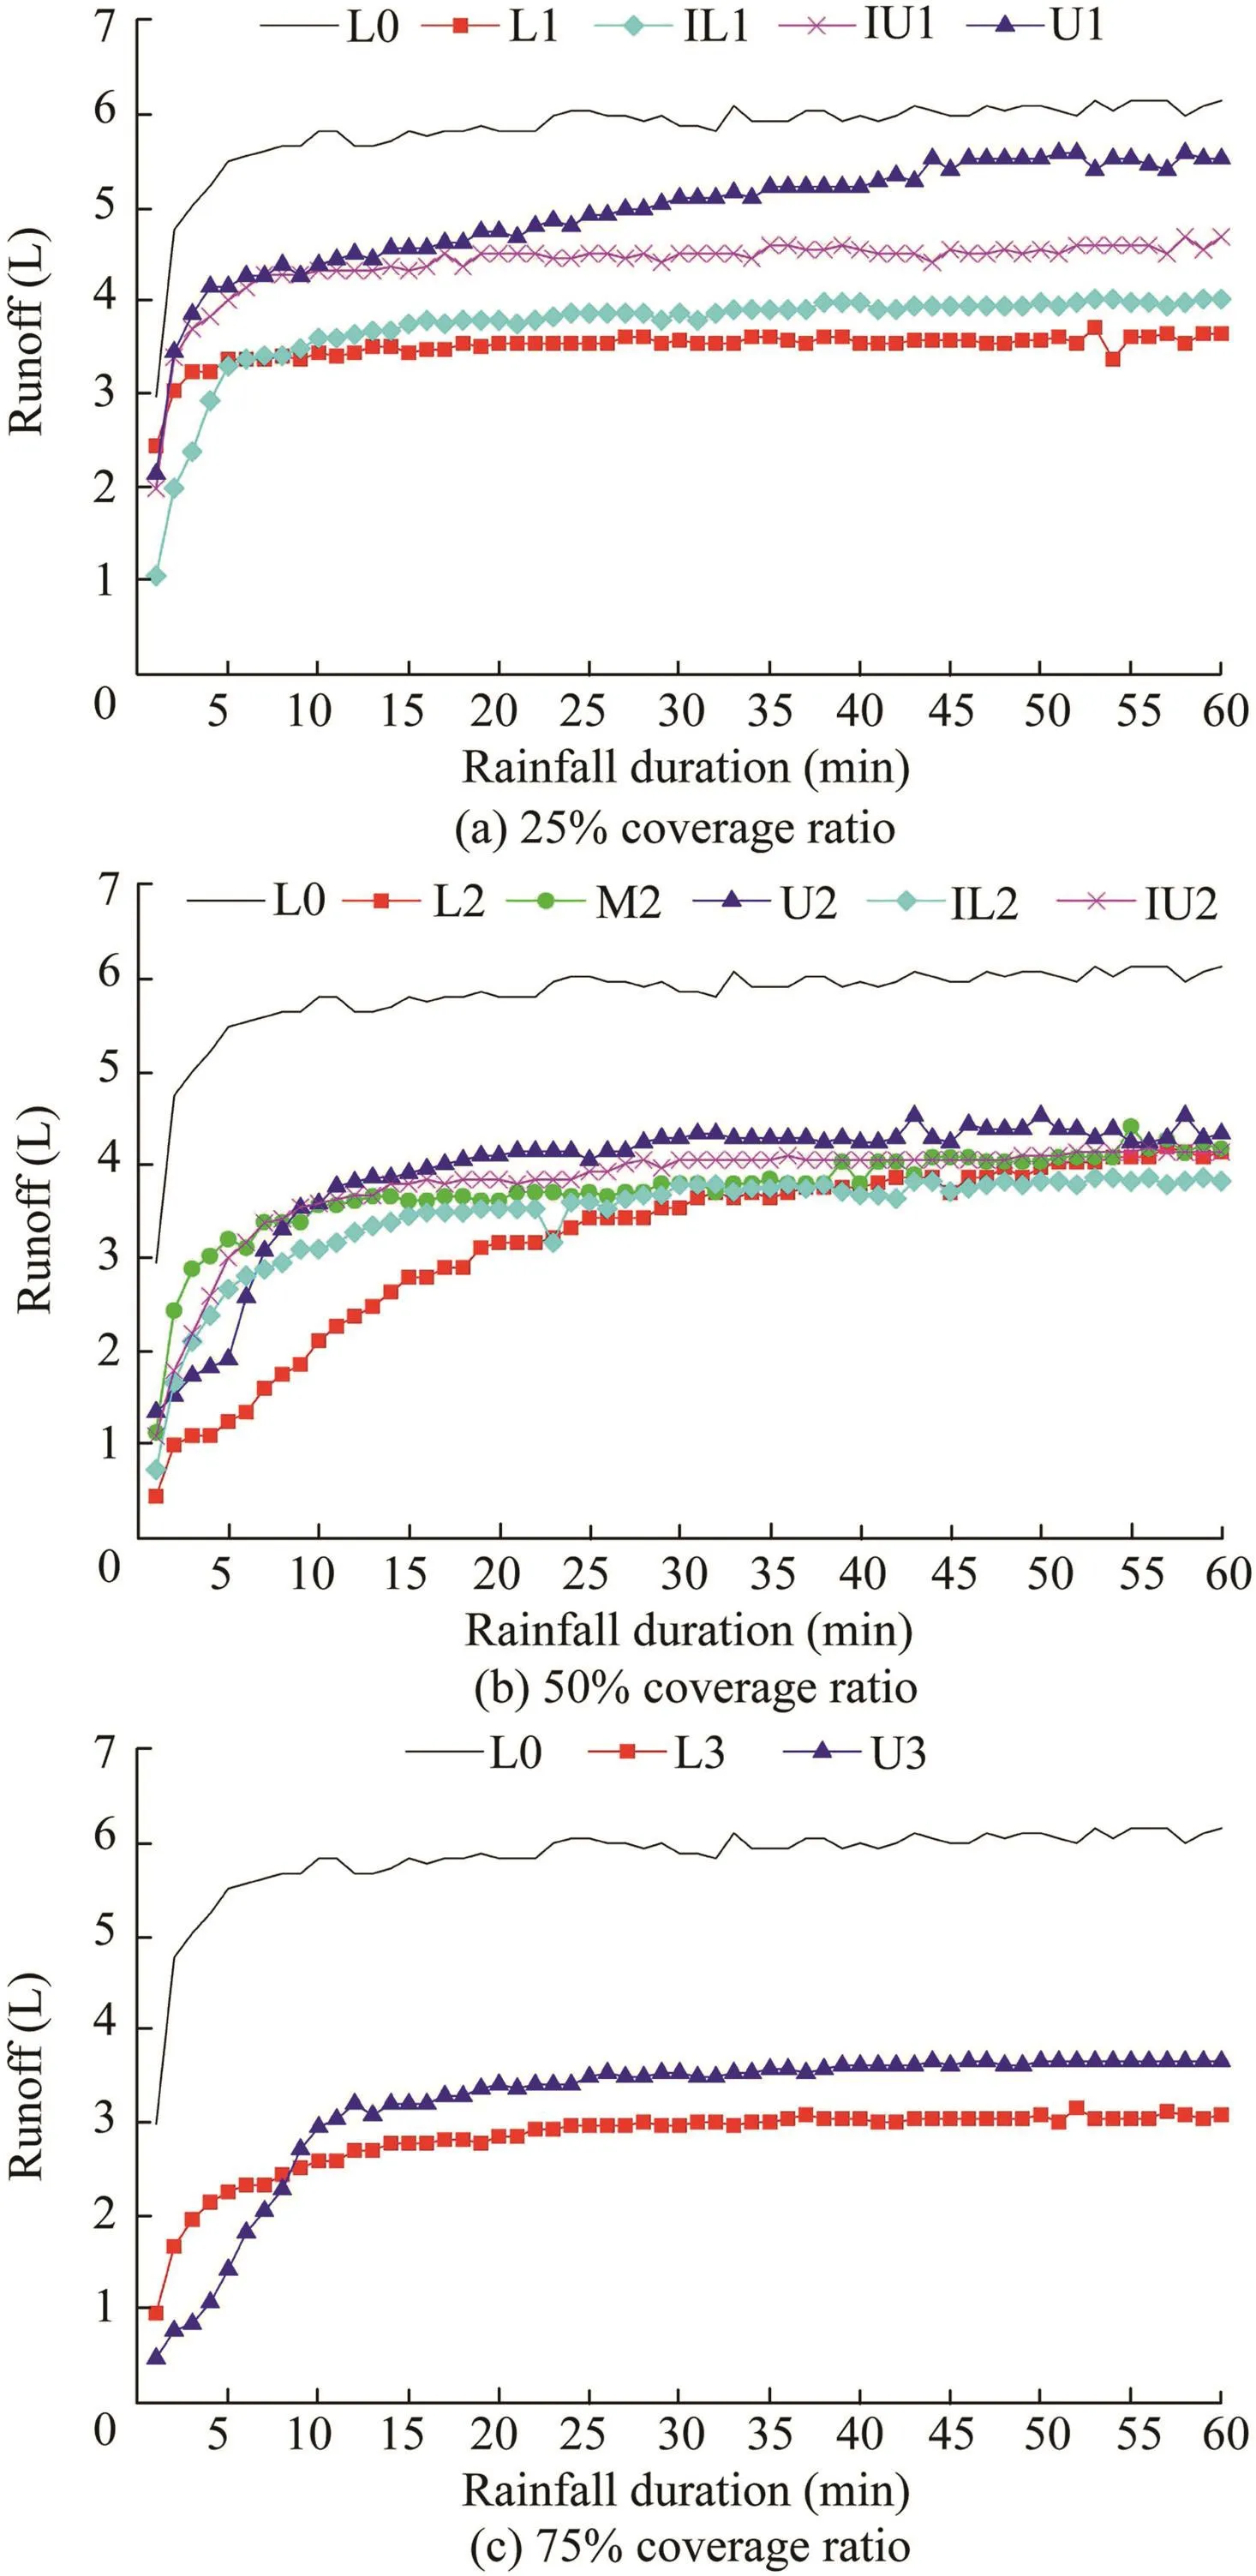
Fig.2.Runoff processes at different grass coverage ratios.
3.2.Infiltration process
The infiltration processes of the slope at different grass coverage ratios are similar:the infiltration rate drops when rainfall starts and becomes stable as rainfall continues(Fig.3).The infiltration rate of the slope with grass coverage is higher than that of a bare slope(with a steady value of 0.35 mm/min),and increases with the increasing grass coverage ratio.The infiltration rate of the slope for different vegetation patterns decreases in the order of L1,IL1,IU1,and U1 at a 25%coverage ratio(Fig.3(a));and in the order of L2,IL2,M2,IU2,and U2 at a 50%coverage ratio(Fig.3(b)).At a 75%coverage ratio,the infiltration rate of the slope for L3 is higher than that for U3(Fig.3(c)).In comparison with 25%and 50%coverage ratios,the slope infiltration process at a 75%coverage ratio has lessfluctuation.
The time required for the infiltration rate to reach a stable value(briefly as the stabilization time)varies with the grass coverage ratio and vegetation pattern.In the bare slope scenario,the stabilization time was about 5 min.At a 25%grass coverage ratio,the stabilization time was about 3-5 min for four vegetation patterns,of which the infiltration process of pattern L1 shows higher stability than others(Fig.3(a)).The infiltration rate of vegetation pattern U1 shows a decreasing trend for 25-42 min,and then becomes stable.This may be related to the formation of soil crust on the slope.At a 50%grass coverage ratio,the stabilization time was about 5-9 min for vegetation patterns U2,IU2,M,and IL2,and 19 min for pattern L2(Fig.3(b)).At a 75%grass coverage ratio,there is a large difference between the stabilization time of vegetation patterns L3 and U3,which were 6 min and 12 min,respectively(Fig.3(c)).The results show that a higher grass coverage ratio leads to more cumulative infiltration and a longer stabilization time,which has a significant effect on the regulation of rainfall infiltration.
3.3.Discussion
3.3.1.Effects of grass coverage on total runoff
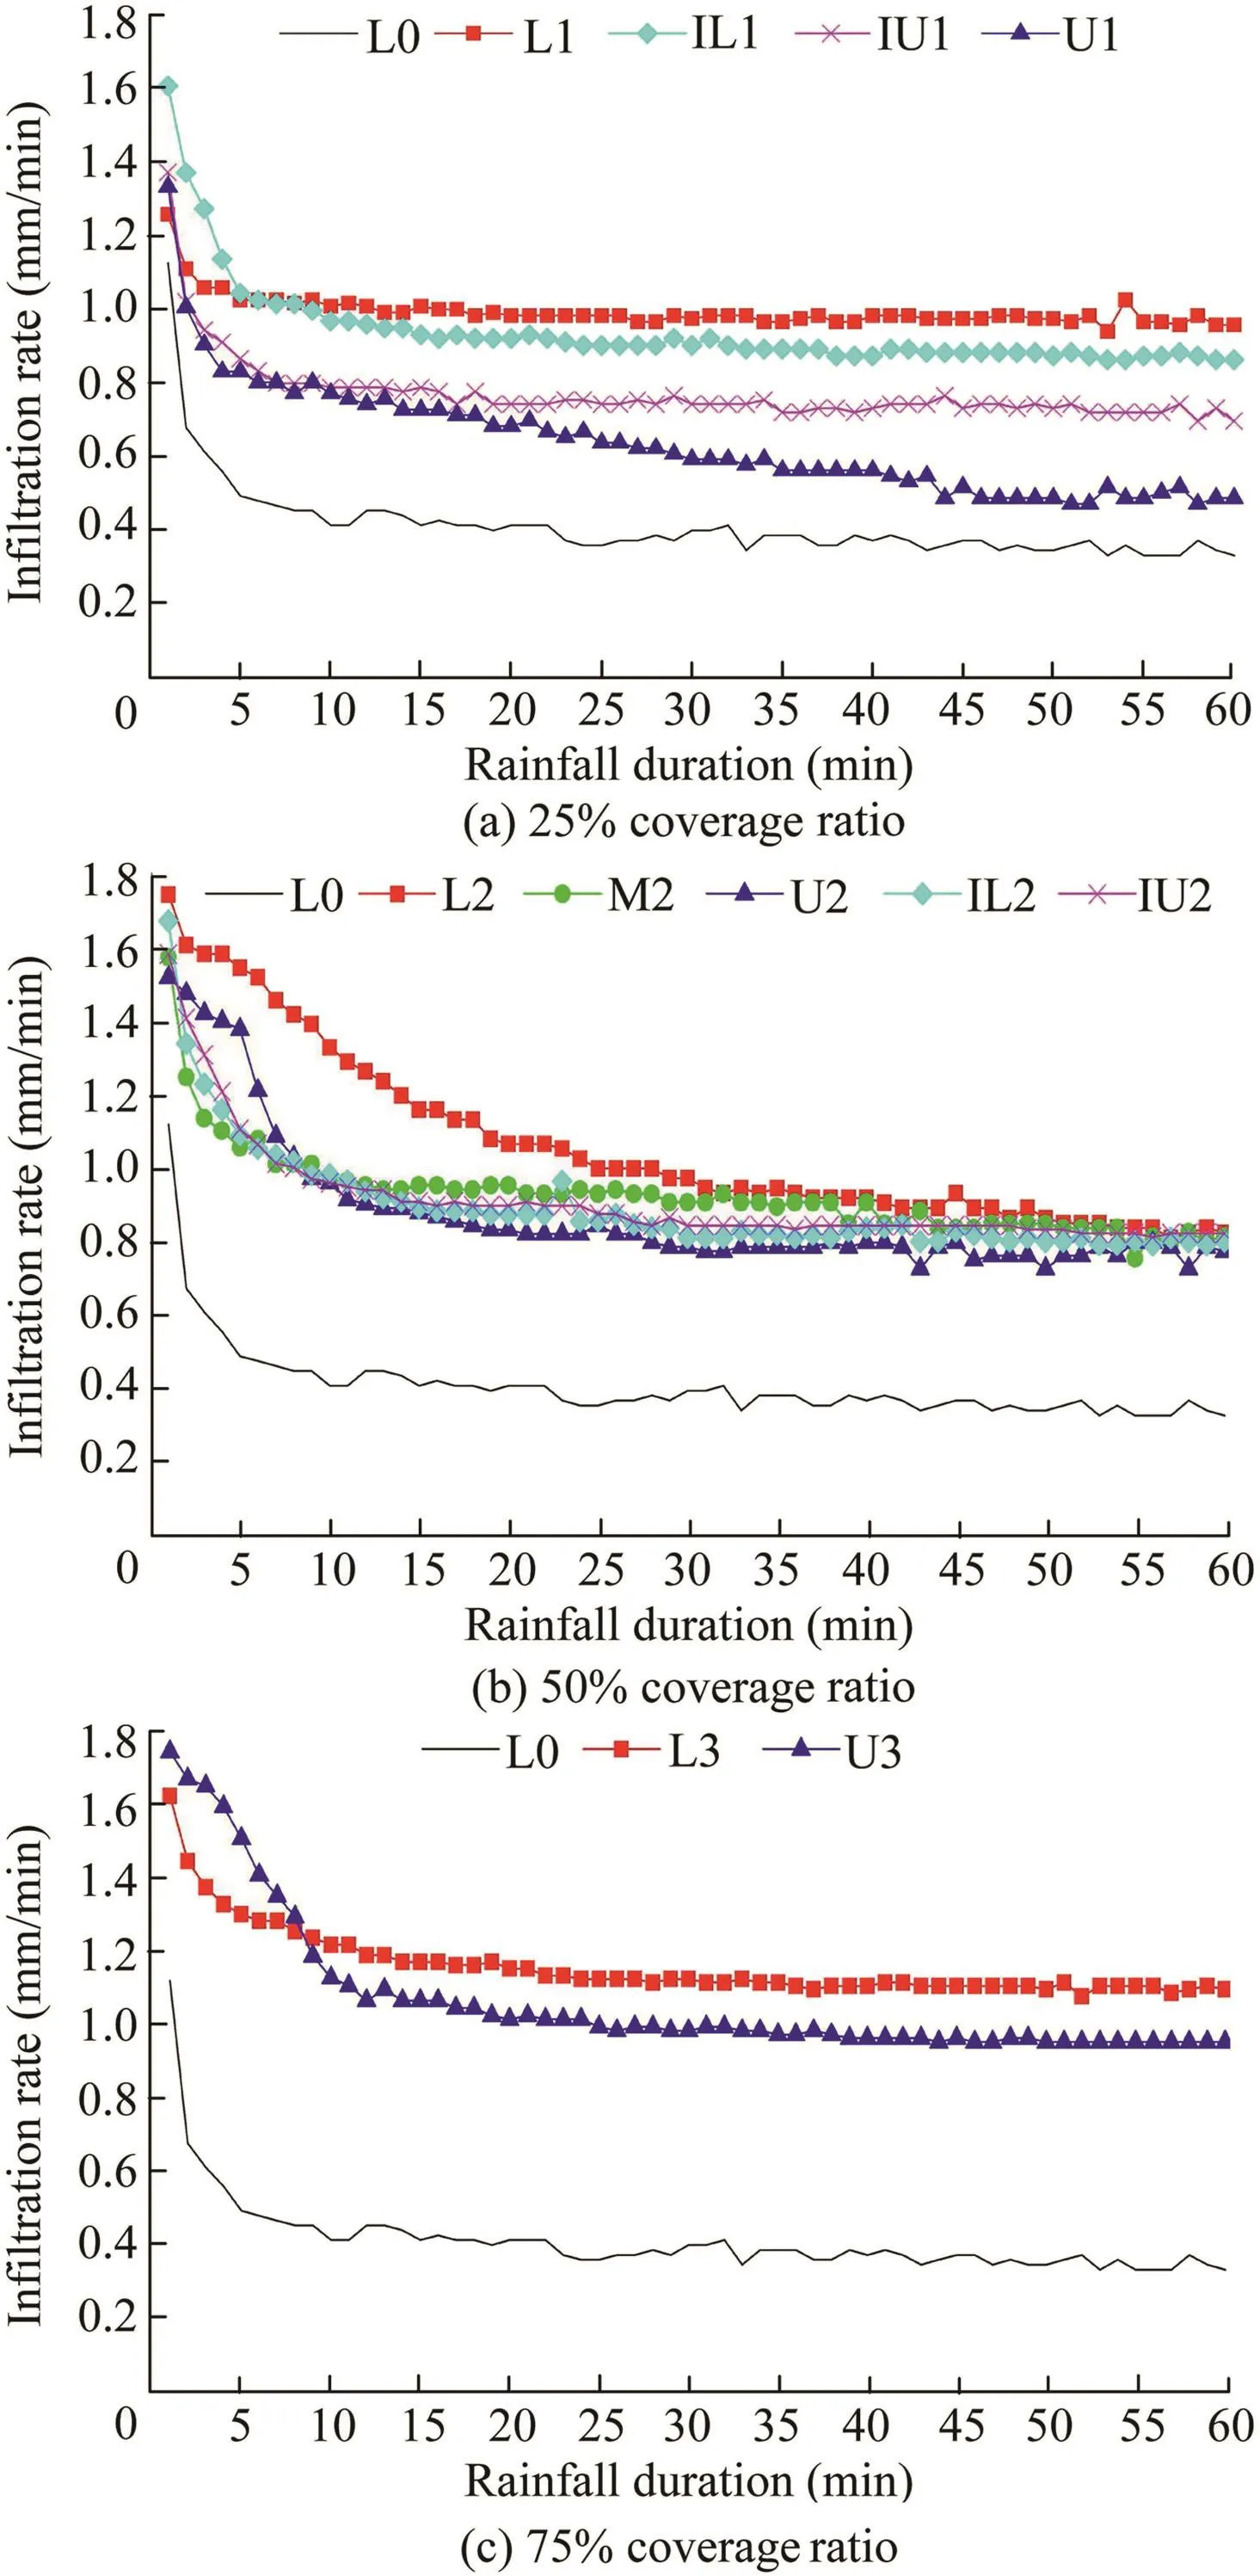
Fig.3.Infiltration processes at different grass coverage ratios.
Table 1 shows the runoff coefficients at different grass coverage ratios.The maximum value of the runoff coefficient occurs in the bare slope scenario.With the increase of the grass coverage ratio,the runoff coefficient decreases accordingly,leading to increased rainfall infiltration and decreased total runoff.The runoff coefficient for different vegetation patterns increases in the order of L1,IL1,IU1,and U1 at a 25%coverage ratio;in the order of L2,IL2,M2,IU2,and U2 at a 50%coverage ratio;and in the order of L3 and U3 at a 75%coverage ratio.For a constant grass coverage ratio,the runoff coefficient and total runoff decrease when the area of grass coverage moves downward on the slope.
Therunoffreductionrateforeachvegetationpattern(Table1)was calculated for 25%,50%,and 75%coverage ratios,using the total runoff in the bare slope scenario as the baseline.In comparison with the total runoff in the bare slope scenario,the runoff reduction rates at 25%,50%,and 75%coverage ratios varied within the ranges of 15%-40%,32%-44%,and 45%-51%,respectively.Comparison of the runoff reductionratios for different vegetation patterns and different grass coverage ratios shows that the regulatory effect of the grass coverage ratio on the total runoff is minor,while the effect of thevegetationpatternissignificant.
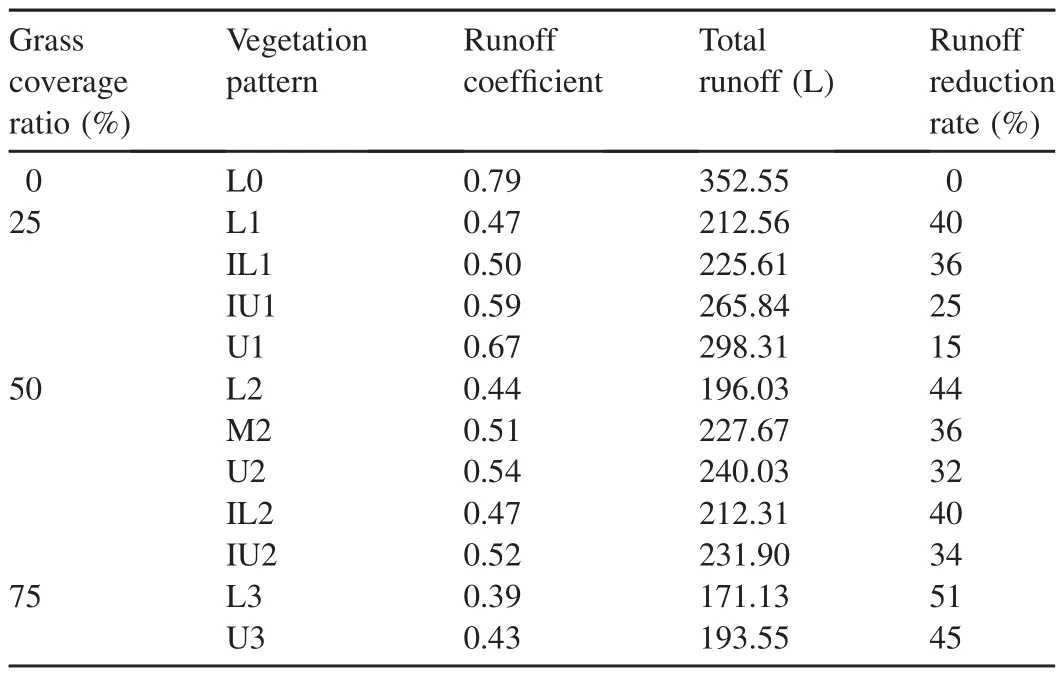
Table 1 Regulatory effects of grass coverage ratio and vegetation pattern on runoff coefficient and total runoff.
According to the calculated results of the runoff coefficient and runoff reduction rate,the minimum runoff coefficient and the maximum runoff reduction rate were obtained in vegetation pattern L3 at a 75%coverage ratio,indicating that rainfall-runoff processes can be effectively regulated at a high grass coverage ratio by locating vegetation at the lower part of the slope.
3.3.2.Effects of grass coverage onflood peak and its occurrence time
The peakflow process during the experiments differs from that of the natural rainfall.A constant rainfall intensity was assumed in the experiment.Under such a precondition,the slope runoff steadily increased as rainfall continued,and theflood peak occurred during the period with steady runoff,mostly in the later period of rainfall.Theflood peak discharges of vegetation patterns L1,L2,IL2,and L3 are lower than those of other patterns(Table 2).At a 50%grass coverage ratio,theflood peak discharges of patterns IL2 and IU2 are lower than those of M2 and U2,showing that vegetation patterns with discontinuous grass blocks have stronger regulatory effects on the runoff process than those with continuous grass blocks,which attenuate theflood peak discharge in a more effective manner to ensure steady runoff.
As for theflood peak occurrence time,the grass coverage ratio has a minor effect on delaying the occurrence of theflood peak(Table 2).In the bare slope scenario,theflood peak occurred at 8 min.In patterns L1,L2,and L3,theflood peaks occurred,respectively,at 13 min,19 min,and 17 min,all later than in the bare slope scenario,indicating that there are stronger regulatory effects on the runoff process when vegetation is located at the lower part of the slope.
At the same coverage ratio,as the area of grass coverage moves downward on the slope,theflood peak discharge gradually decreases,and theflood peak occurs later.Thereason is that rainfall-runoff processes are blocked by vegetation on the lower slope,leading to increases in the residence time of rainfall and rainfall infiltration,and a decrease in theflow velocity on the slope.Thus,theflood peak discharge with vegetation located on the lower slope is less than that with vegetation located on the upper slope.For the same reason,theflood peak occurs later.

Table 2 Comparison of flood peak discharges and flood peak occurrence time of different vegetation patterns at different coverage ratios.
4.Conclusions
In the study,the regulatory effects of urban vegetation on rainfall-runoffprocesseswere analyzed through rainfall simulation experiments.It was found that,with the increase of the grass coverage ratio,the runoff coefficient decreases,the infiltration rate increases,and the time required for the infiltration rate to reach a stable value increases,leading to a decrease of theflood peak discharge and a later occurrence of theflood peak.Moreover,the role of vegetation in the reduction of runoff shows a high degree of spatial variation.At a constant grass coverage ratio,with the area of grass coverage moving downward on the slope,the runoff coefficient gradually decreases,and the total runoff decreases as well.Meanwhile,theflood peak discharge gradually decreases and theflood peak occurs later as vegetation moves downward.In general,optimal regulatory effects on rainfall-induced runoff are expected at a high grass coverage ratio,with the area of grass coverage located at the lower part of the slope.
Argent,N.,Rolley,F.,Walmsley,J.,2008.The sponge city hypothesis:Does it hold water? Aust.Geogr.39(2),109-130.https://doi.org/10.1080/00049180802056807.
Blanco,C.H.,Gantzer,C.J.,Anderson,S.H.,Alberts,E.E.,Thompson,A.L.,2004.Grass barrier and vegetativefilter strip effectiveness in reducing runoff,sediment,nitrogen,and phosphorus loss.Soil Sci.Soc.Am.J.68(5),1670-1678.https://doi.org/10.2136/sssaj2004.1670.
Cerdˋa,A.,2001.Effects of rock fragment cover on soil infiltration,interrill runoff and erosion.Eur.J.Soil Sci.52(1),59-68.https://doi.org/10.1046/j.1365-2389.2001.00354.x.
Cerdˋa,A.,Keesstra,S.,Burguet,M.,Pereira,P.,Lucasborja,M.E.,Martinezmurillo,J.F.,2016.Seasonal changes of the infiltration rates in urban parks of Valencia City,Eastern Spain.In:Geophysical Research Abstracts.EGU General Assembly Conference,p.18110.
Cuo,L.,Lettenmaier,D.P.,Mattheussen,B.V.,Storck,P.,Wiley,M.,2010.Hydrologic prediction forurban watersheds with the distributed hydrology-soil-vegetation model.Hydrol.Process.22(21),4205-4213.https://doi.org/10.1002/hyp.7023.
Dobbs,C.,Nitschke,C.R.,Kendal,D.,2014.Global drivers and tradeoffs of three urban vegetation ecosystem services.PLos One 9(11),e113000.https://doi.org/10.1371/journal.pone.0113000.
Dunne,T.,Zhang,W.,Aubry,B.F.,1991.Effects of rainfall,vegetation,and microtopography on infiltration and runoff.Water Resour.Res.27(9),2271-2285.https://doi.org/10.1029/91WR01585.
Dwivedi,R.S.,Sreenivas,K.,2002.Thevegetationandwaterloggingdynamicsas derived from spaceborne multispectral and multitemporal data.Int.J.Rem.Sens.23(14),2729-2740.https://doi.org/10.1080/01431160110076234.
Ellis,J.B.,Revitt,D.M.,Lundy,L.,2012.An impactassessment methodologyfor urban surface runoff quality following best practice treatment.Sci.Total Environ.416,172-181.https://doi.org/10.1016/j.scitotenv.2011.12.003.
Fletcher,T.D.,Andrieu,H.,Hamel,P.,2013.Understanding,management and modelling of urban hydrology and its consequences for receiving waters:A state of the art.Adv.Water Resour.51(1),261-279.https://doi.org/10.1016/j.advwatres.2012.09.001.
Han,W.S.,Burian,S.J.,2009.Determining effective impervious area for urban hydrologic modeling.J.Hydrol.Eng.14(2),111-120.https://doi.org/10.1061/(ASCE)1084-0699(2009)14:2(111).
Jacobson,C.R.,2011.Identification and quantification of the hydrological impacts of imperviousness in urban catchments:A review.J.Environ.Manag.92(6),1438-1448.https://doi.org/10.1016/j.jenvman.2011.01.018.Juncosa,M.N.,Matlin,K.S.,Holdcraft,R.W.,Nirmalanandhan,V.S.,Butler,D.L.,2007.Mechanical stimulation increases collagen type I and collagen type III gene expression of stem cell-collagen sponge constructs for patellar tendon repair.Tissue Eng.13(6),1219-1226.https://doi.org/10.1089/ten.2006.0339.
Li,C.,2012.Ecohydrology and good urban design for urban storm waterlogging in Beijing,China.Ecohydrol.Hydrobiol.12(4),287-300.https://doi.org/10.2478/v10104-012-0029-8.
Liu,C.M.,Zhang,Y.Y.,Wang,Z.G.,Wang,Y.L.,Bai,P.,2016.The LID pattern for maintaining virtuous water cycle in urbanized area:A preliminary study of planning and techniques for sponge city.J.Nat.Resour.31(5),719-731.https://doi.org/10.11849/zrzyxb.20151294(in Chinese).
Marques,M.J.,Bienes,R.,Jim′enez,L.,P′erez-Rodríguez,R.,2007.Effect of vegetal cover on runoff and soil erosion under light intensity events:Rainfall simulation over USLE plots.Sci.Total Environ.378(1-2),161-165.https://doi.org/10.1016/j.scitotenv.2007.01.043.
Mason,D.C.,Speck,R.,Devereux,B.,Schumann,J.P.,Neal,J.C.,Bates,P.D.,2010.Flood detection in urban areas using TerraSAR-X.IEEE Trans.Geosci.Rem.Sens.48(2),882-894.https://doi.org/10.1109/TGRS.2009.2029236.
Melville,N.,Morgan,R.P.C.,2006.The influence of grass density on effectiveness of contour grass strips for control of soil erosion on low angle slopes.Soil Use Manag.17(4),278-281.https://doi.org/10.1111/j.1475-2743.2001.tb00038.x.
Miller,J.D.,Kim,H.,Kjeldsen,T.R.,Packman,J.,Grebby,S.,Dearden,R.,2014.Assessing the impact of urbanization on storm runoff in a peri-urban catchment using historical change in impervious cover.J.Hydrol.515,59-70.https://doi.org/10.1016/j.jhydrol.2014.04.011.
Mitchell,M.G.E.,Wu,D.,Johansen,K.,Maron,M.,McAlpine,C.,Rhodes,J.R.,2016.Landscape structure influences urban vegetation vertical structure.J.Appl.Ecol.53(5),1477-1488.https://doi.org/10.1111/1365-2664.12741.
Morse,C.C.,Huryn,A.D.,Cronan,C.,2003.Impervious surface area as a predictor of the effects of urbanization on stream insect communities in Maine,USA.Environ.Monit.Assess.89(1),95-127.https://doi.org/10.1023/A:1025821622411.
Pan,C.Z.,Shangguan,Z.P.,2006.Runoff hydraulic characteristics and sediment generation insloped grassplots under simulated rainfall conditions.J.Hydrol.331(1-2),178-185.https://doi.org/10.1016/j.jhydrol.2006.05.011.
Piekarczyk,J.,Kazmierowski,C.,Krolewicz,S.,2012.Relationships between soil properties of the abandonedfields and spectral data derived from the advanced spaceborne thermal emission and reflection radiometer(ASTER).Adv.SpaceRes.49(2),280-291.https://doi.org/10.1016/j.asr.2011.09.010.
Pitt,R.,Chen,S.-E.,Clark,S.E.,Swenson,J.,Ong,C.K.,2008.Compaction's impacts on urban storm-water infiltration.J.Irrigat.Drain.Eng.134(5),652-658.https://doi.org/10.1061/(ASCE)0733-9437(2008)134:5(652).
Robinson,S.L.,Lundholm,J.T.,2012.Ecosystem services provided by urban spontaneous vegetation.Urban Ecosyst.15(3),545-557.https://doi.org/10.1007/s11252-012-0225-8.
Savva,Y.,Szlavecz,K.,Pouyat,R.V.,Groffman,P.M.,Heisler,G.,2010.Effects of land use and vegetation cover on soil temperature in an urban ecosystem.Soil Sci.Soc.Am.J.74(2),469-480.https://doi.org/10.2136/sssaj2009.0107.
Scholz,M.,Yazdi,S.K.,2009.Treatment of road runoff by a combined storm water treatment,detention and infiltration system.Water Air Soil Pollut.198(1-4),55-64.https://doi.org/10.1007/s11270-008-9825-6.
Sheets,V.L.,Manzer,C.D.,1991.Affect,cognition,and urban vegetation:Some effects of adding trees along city streets.Environ.Behav.23(3),285-304.https://doi.org/10.1177/0013916591233002.
Susca,T.,Gaffin,S.R.,Dell'Osso,G.R.,2011.Positive effects of vegetation,urban heat island and green roofs.Environ.Pollut.159(8),2119-2126.https://doi.org/10.1016/j.envpol.2011.03.007.
Wang,L.Z.,Lyons,J.,Kanehl,P.,Bannerman,R.,2001.Impacts of urbanization on stream habitat andfish across multiple spatial scales.Environ.Manag.28(2),255-266.https://doi.org/10.1007/s0026702409.
Yang,J.C.,Wang,Z.H.,2014.Physical parameterization and sensitivity of urban hydrological models:Application to green roof systems.Build.Environ.75,250-263.https://doi.org/10.1016/j.buildenv.2014.02.006.
Yu,D.,Lane,S.N.,2006.Urban fluvial flood modelling using a twodimensional diffusion-wave treatment,Part 1:Mesh resolution effects.Hydrol.Process.20(7),1541-1565.https://doi.org/10.1002/hyp.5935.
Zhao,X.G.,Wu,X.M.,Chen,X.H.,2004.Urban vegetation investigation in Xi’an City.J.Arid Land Resour.Environ.18(2),86-91.https://doi.org/1003-7578(2004)02-086-06(in Chinese).
Zoppou,C.,2001.Review of urban storm water models.Environ.Model.Software16(3),195-231.https://doi.org/10.1016/S1364-8152(00)00084-0.
登錄APP查看全文
猜你喜歡
甘肅教育(2020年14期)2020-09-11 07:57:42
中學生數理化(高中版.高考數學)(2020年5期)2020-06-02 09:19:08
遼金歷史與考古(2019年0期)2020-01-06 07:44:44
商周刊(2017年9期)2017-08-22 02:57:49
中國衛生(2016年7期)2016-11-13 01:06:26
中國衛生(2016年11期)2016-11-12 13:29:18
中國衛生(2016年9期)2016-11-12 13:27:58
中財法律評論(2016年0期)2016-06-01 12:17:10
時代英語·高二(2015年1期)2015-03-16 00:08:11
中國衛生(2014年11期)2014-11-12 13:11:32
 Water Science and Engineering
2017年4期
Water Science and Engineering
2017年4期
- Water Science and Engineering的其它文章
- Preface for special section on flood modeling and resilience
- Fenton-like oxidation of azo dye in aqueous solution using magnetic Fe3O4-MnO2nanocomposites as catalysts
- Preparation of 2D square-like Bi2S3-BiOCl heterostructures withenhanced visible light-driven photocatalytic performance for dye pollutant degradation
- Effect of water-sediment regulation and its impact on coastline and suspended sediment concentration in Yellow River Estuary
- Flood management of Dongting Lake after operation of Three Gorges Dam
- A distributed eco-hydrological model and its application