Temperature field analysis of two rotating and squeezing steel-rubber rollers①
2017-12-19 00:45:27ChuHongyan初紅艷XuKangjianCaiLigang
High Technology Letters 2017年4期
Chu Hongyan (初紅艷), Xu Kangjian, Cai Ligang
(*Advanced Manufacturing Technology of Beijing Key Laboratory, College of Mechanical Engineering and Applied Electronics Technology, Beijing University of Technology, Beijing 100124, P.R.China) (**Wuhan Zhongyuan Electronics Group Co. Ltd, Wuhan 430205, P.R.China)
Temperature field analysis of two rotating and squeezing steel-rubber rollers①
Chu Hongyan (初紅艷)*, Xu Kangjian②, Cai Ligang*
(*Advanced Manufacturing Technology of Beijing Key Laboratory, College of Mechanical Engineering and Applied Electronics Technology, Beijing University of Technology, Beijing 100124, P.R.China) (**Wuhan Zhongyuan Electronics Group Co. Ltd, Wuhan 430205, P.R.China)
Rubber has strong nonlinear viscoelastic characteristic. Under effect of the periodically changing external force, it will show the phenomenon of lagging deformation and mechanical loss, which means deformation lags behind stress changes and the situation of loss of work is caused by the hysteresis. Loss of work will be transformed into thermal energy and makes the temperature of rubber and the object in contact with it rise, which will thereby affect the dynamic characteristics of the structure. Based on a pair of mutual rotating and squeezing steel-rubber rollers as the research object, the finite element simulation software Ansys is used in this paper to analyze the temperature field of the structure. As a result, temperature distribution characteristics of two directions are obtained. One is squeezing area along the direction of the wall, the other is along the direction of thickness of rubber. Then the influence of the rotating speed and the pressure between two rollers on temperature of rubber is analyzed. The temperature experiment of mutual squeezing contact steel-rubber roller is carried out on the experimental platform via using infrared thermal imager and infrared thermometer. The experiment data are in accordance with the simulation results on regulation of temperature distribution as well as high degree of similarity on value, which shows the effectiveness of simulation. Research results are of great significance for temperature characteristic analysis of rubber structure.
rubber, viscoelasticity, mechanical loss, squeezing contact, temperature field
0 Introduction
Rubber is widely used in automobile, aerospace, vessel, high building, household appliances and mechanical industry materials for sealing, impact energy and laminated aseismic composites, which has important social and economic value.
Rubber has strong nonlinear viscoelastic characteristics. Under effect of the periodically changing external force, it will show the phenomenon of lagging deformation and mechanical loss, which means deformation lags behind stress changes and the situation of loss of work is caused by the hysteresis. Loss of work will be transformed into thermal energy and makes the temperature of rubber and the object in contact with it rise. Performance of rubber is greatly influenced by temperature. Rise of temperature will make change on hardness of rubber, damping factor and so on, and then make the dynamic characteristics of structure change. So the temperature analysis of rubber structure is of great significance.
In the aspect of temperature analysis of rubber structure, current researches are more inclined to focus on the heat generation phenomenon of tire in the process of driving and its influence on tire driving characteristics. The main research methods are experimental method, analytic method and finite element method. In the application of finite element method, there are both the solution named “unidirectional decoupling” and the iterative solution called “bidirectional coupled”. “Unidirectional decoupling” solution only considers the effect of tire structure deformation on inner heat generation (which means temperature field)[1]. “Bidirectional coupled” solution, in turn, solves the boundary value problems independently, and calculates the influence between stress as well as strain field and temperature field via temperature iteration[2,3]. The most popular method used in current internal researches is “unidirectional decoupling”, which uses the relationship between stress and strain of tire deformation to gain heat production rate of node, then using the heat production rate as a heat source applied to finite element model to obtain the temperature field of tire[4,5]. For example, Han[6]used this method to carry out the temperature field simulation of the whole inking system of Beiren 300A, and the finite element analysis of rubber roller was carried out depending on the Mooney-Rivlin model.
This paper takes a pair of mutual squeezing contact steel-rubber rollers as the object for the research, using “unidirectional decoupling” method. Varied from the method of “heat production rate of node”, the method of “heat production during squeezing process” is adopted (i.e., set appropriate viscoelastic characterization parameters for rubber, and directly analyze the temperature field of the process of squeezing contact rotation.). Through simulating the temperature characteristic of steel-rubber structure, the experimental data verify the validity of simulation analysis. The findings have practical engineering sense for some temperature field analysis of contact pair made of steel-rubber structure in engineering practice such as the mutual squeezing contact steel-rubber roller of offset press.
1 Principle of rubber heat production
1.1 Mechanical model of rubber material
Rubber is a typical material which is neither elastomer nor viscous fluid, but it has the properties of both the elastomer material and the viscous fluid, and its characteristics combine the elasticity of solid and the viscosity of fluid, which is called viscoelasticity[7]. Fig.1 is a typical mechanical model of viscoelastic body[8]. The mechanics formula is
(1)
In the Eq. (1): σ represents stress; E stands for the elastic modulus of spring; η represents viscosity coefficient; ε stands for strain.
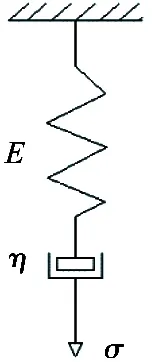
Fig.1 Typical mechanical model of viscoelastic body
1.2 Calculation of energy consumption of recycling squeezing of rubber
Rubber materials with viscoelasticity are composed of a large number of polymer organic units according to certain rules. When rubber is under external loading, molecular chain deformation will occur. At the same time, due to the internal molecular chain of rubber material is unstable, slippage occurs between them. The elastic properties of rubber materials is that after unloading the external load, the distortion of molecular chain will immediately restore and change the work of external load into elastic potential energy of rubber. But the slips between rubber molecular chains can’t recover completely. It takes time to rearrange the molecular chains which results in misalignment between unloading curve and loading curve. Fig.2 shows the misalignment.In theory, the area which is included by the loading curve a and the unloading curve b is the lost mechanical energy of the viscoelastic body. The lostmechanical energy changes into heat energy which makes the viscoelastic material temperature increased[9].
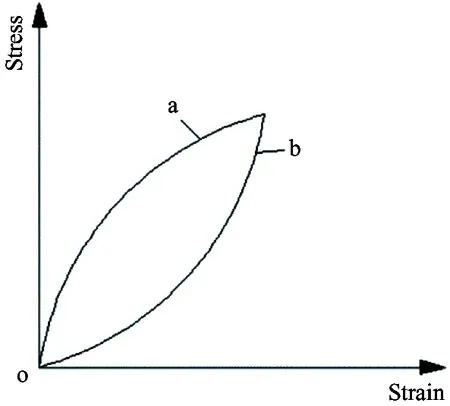
Fig.2 Schematic of the lag of viscoelastic body
Fig.3 is the phase difference of stress and strain when rubber material is under stress (strain) with the angular velocity of ω. The strain lags behind the stress a loss angle named δ. δ is loss angle of rubber, and tanδ is loss factor[10].

Fig.3 Phase difference diagram of rubber material’s stress-strain
When δ=0, all the force applied to rubber is used to counteract the elastic deformation of rubber molecules. When δ=π/2, the external force’s work on rubber is absorbed by viscoelastic hysteresis of rubber materials. Loss angle δ represents the loss extent of rubber material’s mechanical energy.
For the periodic deformation in the situation of angular velocity ω, its deformation cycle is T=2πω, and the mechanical energy loss in a whole deformation cycle can be expressed as
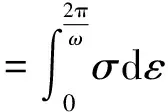
(2)
The loss of mechanical energy per unit time is
(3)
It can be seen from Eq. (3) that rubber’s loss of mechanical energy in operation is concerned with velocity ω, cyclic strain amplitude εm, the elastic storage modulus G1and loss factor tanδ of rubber material.
2 Temperature field analysis of rotating and squeezing steel-rubber structure
2.1 Building the geometric model
Using simulation software Ansys to carry on temperature field analysis of a pair of squeezing and rotating steel-rubber roller is shown in Fig.4. The radius of steel roller is 30mm, and rubber roller is a steel core roller covered with a layer of rubber. The layer thickness of rubber is 10mm and the external radius of it is 30mm. the material parameters are shown in Table 1.
Fig.4 squeezing contact steel-rubber structure Table 1 Material parameters

SteelRubberElasticmodulus206GPa0.008GPaDensity7800kg·m31300kg·m3Thermalconductivity66.6W/(m℃)0.25W/(m℃)Specificheatcapacity460J/(kg℃)1700J/(kg℃)Thermalexpansioncoefficient1.06×10-5/℃65×10-5/℃Poissonratio0.30.47
The shore hardness of rubber is 60HA, and its elastic characteristics can be expressed by Mooney-Rivilin model,the corresponding parameters C10is 0.7, C01is 0.035. The viscosity properties of rubber are represented by damping coefficient, namely loss factor, whose value is 1 in this paper[11]. The 3-dimensional model is shown in Fig.5 in which the above is rubber roller and the below is steel roller.

Fig.5 Three-dimensional model of steel-rubber roller
The Brick 20 node 226 thermal-structural coupling module is applied to carry on the automatic meshing. The speed of two rollers is set to be 200r/min and the pressure between rollers is set to be 0.3MPa. The heat transfer coefficient is 280W/(m2℃) between rubber and air, 2000W/(m2℃) between rubber and steel roller core, 420W/(m2℃) between steel and air, and 2000W/(m2℃) between two rollers[12,13]. The environment temperature is 20℃.
2.2 Simulation results analysis
Fig.6 is the nephogram of steady temperature field of rotating and squeezing steel-rubber rollers. The maximum deformation of rubber is 0.643mm, and the temperature of squeezing area is higher and gradually reduces along the radial direction of rubber layer from outside to inside, and the temperature of steel roller basically keep in the same value (32℃). This is due to the difference of two rollers’ materials.The coefficient of thermal conductivity of steel is 66.6W/(m℃) and that of rubber is 0.25W/(m℃). There is 260 times of difference between parameters of the two materials,so the internal heat transfer of steel is significantly faster than rubber, and the temperature difference of internal steel roller is very small.
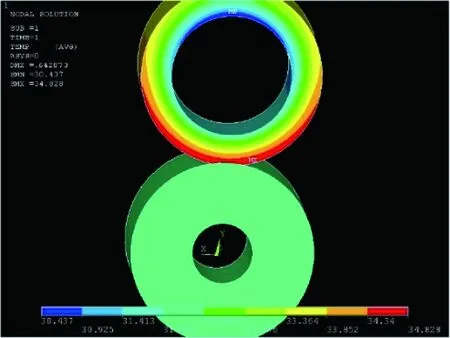
Fig.6 The nephogramof roller in 0.3MPa, 200r/min
Fig.7 shows the temperature data of the rubber wall along rotation direction. In the cyclic squeezing process, the hysteretic energy causes the rise of temperature that the temperature increases from initial environment value of 20℃ to more than 34℃. The temperature near squeezing area is higher than that far away from that area, but the temperature of the part in contact with the squeezing steel roller is declined slightly because the heat exchange occurs between that part and steel. After rotating through the middle squeezing area, the loss of mechanical energy in the process of restoring deformation of rubber will be transformedinto heat which makes the temperature of rubber increased, and after the temperature rising into maximum, it will gradually decline.

Fig.7 Temperature data of the rubber wall
As shown in Fig.8, the temperature data of rubber layer in squeezing area from external to inner surface along radial direction is extracted. Because of the heat exchange between rubber material and steel roller core (temperature is 20℃), the rubber layer temperature decreases from 34.811℃ in squeezing area to 31.737℃ in inner wall along the radial direction, and the closer the position is to the inside, the faster the temperature drops.
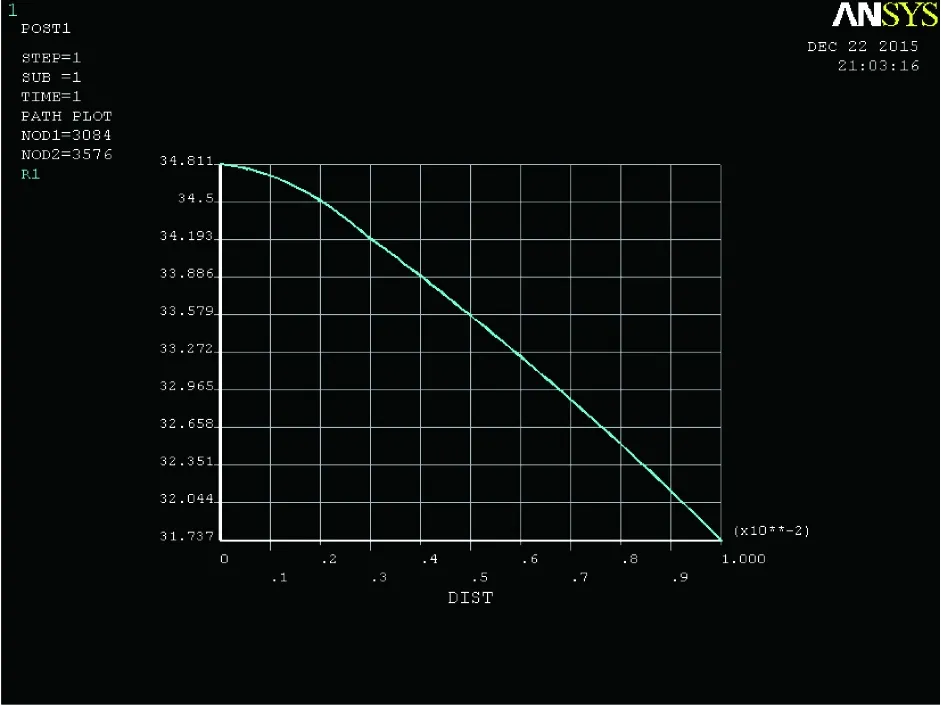
Fig.8 Radial temperature data
2.3 Influence of rotating pressure and velocity on temperature field
Under the condition of the same model, changing the velocity and pressure, the temperature nephogram is similar to that of Fig.6, the wall temperature curves is similar to that of Fig.7, and the temperature curve along the radial direction of rubber layer is similar to that of Fig.8. Table 2 shows the simulation results under different pressure and velocity.
(1) Influence of pressure on temperature
Comparing the data of sequence number 1 with number 2 in Table 2, under the condition of same velocity, it can be concluded that with the pressure rising, the maximum deformation of rubber roller increases, and the maximum temperature of rubber and steel increases. It can be concluded from Eq. (3) that the loss of mechanical energy in the operation process of rubber, namely the transformation of heat energy, is related to the strain amplitude. Under the situation of other conditions being equal, if the pressure increases from 0.3MPa to 0.5MPa, and the maximum deformation rises from 0.643mm to 0.921mm, and the strain will correspondingly increase. The loss of mechanical energy in the operation process of rubber, namely the transformation of heat energy, leads to the increase of the maximum temperature of rubber from 34.829℃ in the condition of 0.3MPa to 36.675℃ in the condition of 0.5MPa. At the same time, the heat transformed from rubber to steel increases to make the temperature of steel rise from 32℃ in 0.3MPa to 34℃ in 0.5MPa.
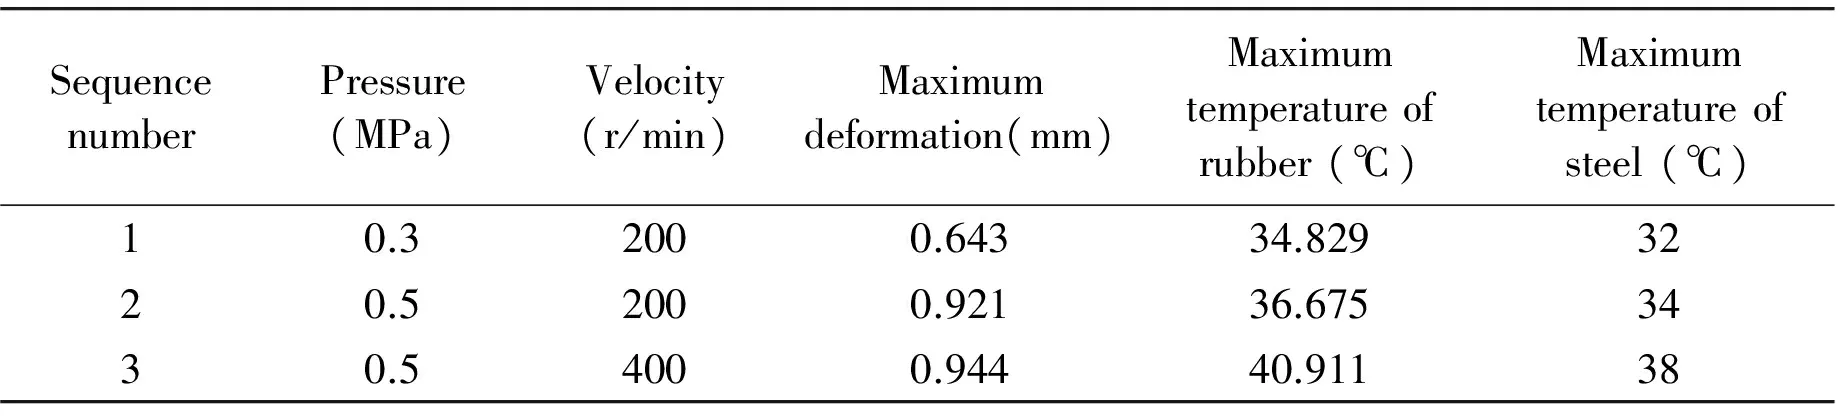
Table 2 The simulation results under different pressure and velocity
(2) Influence of velocity on temperature
Comparing the data of sequence number 2 with number 3 in Table 2, under the condition of same pressure, with the velocity rising, the maximum deformation of rubber roller slightly increases, and the maximum temperature of rubber and steel increases. It can be concluded from Eq. (3) that the loss of mechanical energy in the operation process of rubber, namely the transformation of heat energy, is related to the angular velocity. Under the situation of other conditions being equal, if the velocity increases from 200r/min to 400r/min, the loss of mechanical energy in the operation process of rubber, namely the transformation of heat energy, leads to the increase of maximum temperature of rubber from 36.675℃ in the condition of 200r/min to 40.911℃ in the condition of 400r/min. At the same time, the heat transformed from rubber to steel increases, which makes the temperature of steel rise from 34℃ in 200r/min to 38℃ in 400r/min.
3 Experimental analysis and verification
3.1 The experiment scheme
The experiment is carried on the device shown in Fig.4. The velocity (which has two speed, high and low) and pressure (which ranges from 0 to 1.0MPa) are adjusted according to the need. There are 6 groups of experiments which are shown in Table 3.
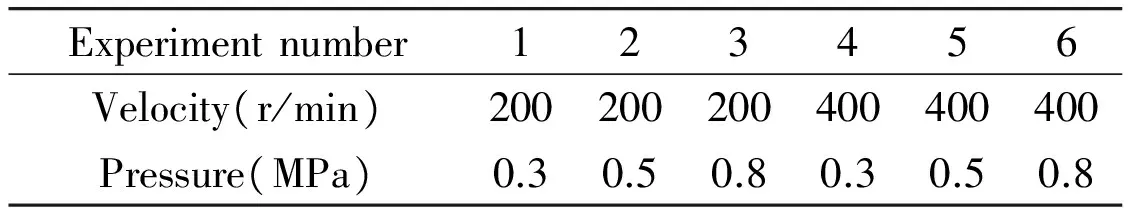
Table 3 The experiment scheme
The initial environmental temperature is recorded. Temperature of end face in squeezing area of rubber roller is measured by infrared thermometer in every 10 minutes. Simultaneously the temperature nephogram of rubber is obtained by infrared thermal imager.
When the temperature in squeezing area tends to be stable or close to 50℃, the experiment will be finished.
3.2 Analysis of experimental data
Due to the different initial temperature in each experiment, to remove the influence of the initial experiment temperature, the temperature rise value is set as the analysis object in this paper.
(1) Experiment analysis of pressure
As shown in Figs 9 and 10, the rise of rubber’s temperature in squeezing area changes quickly at the beginning of the experiment and gradually tends to be stable with the increase of time. What’s more, it canbe seen that with the increase of pressure, the rise of temperature of rubber at the end moment correspondingly increases, and the rules are consistent with the simulation results.
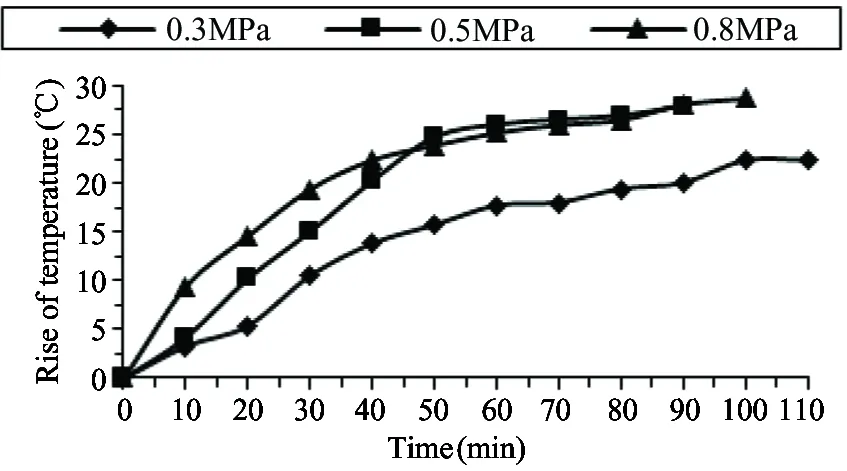
Fig.9 Effect diagram of pressure in low velocity
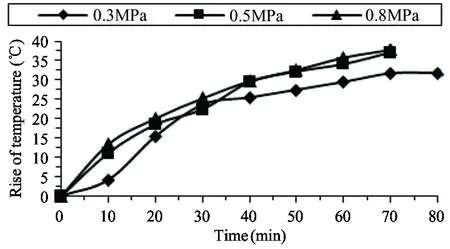
Fig.10 Effect diagram of pressure in high velocity
(2) Experiment analysis of velocity
As shown in Figs11, 12 and 13, under the condition of same pressure, the rise of temperature of rubber will increase with the rise of velocity which is consistent with the conclusion of simulation analysis.
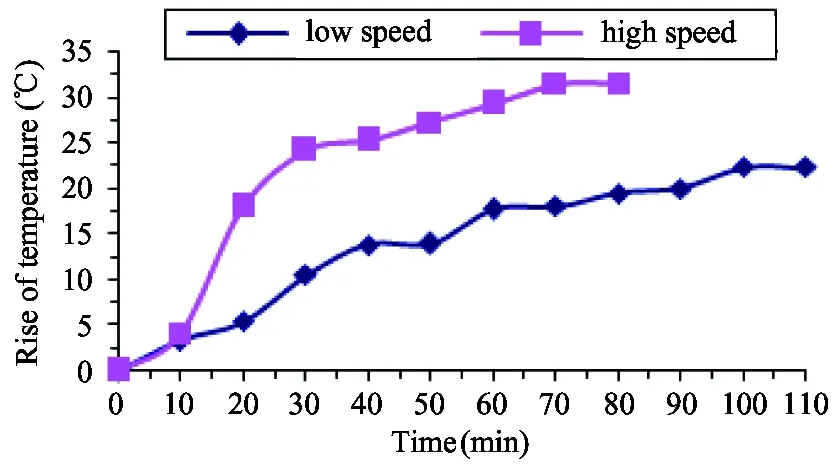
Fig.11 Effect diagram of velocity in 0.3MPa
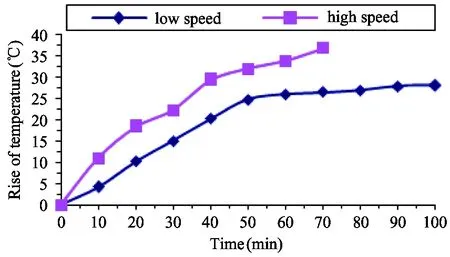
Fig.12 Effect diagram of velocity in 0.5MPa
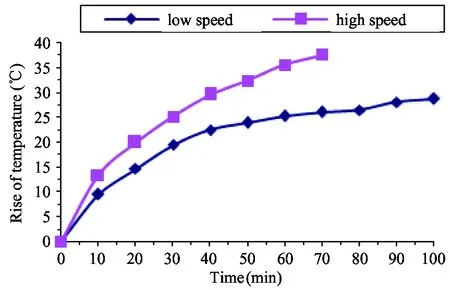
Fig.13 Effect diagram of velocity in 0.8MPa
(3) Temperature field nephogram of steel-rubber structure
Fig.14 is the temperature nephogram when the experiment carried on for 60 min under the condition of 0.3MPa and low speed. Extract the vertical lines top-down in the figure which can be divided into 15 points. The temperature data is used to get the temperature data of rubber wall which is shown in Fig.15.
Due to the different ways of the infrared thermometer and infrared thermal imager on obtaining temperature data, there exists certain difference on value of temperature obtained by two instruments. However, it does not affect the analysis of the experiment rules. It can be seen from Fig.15 that, the temperature of rubber wall rises slowly from outside to squeezing area, which is identical with the result of temperature field simulation analysis.
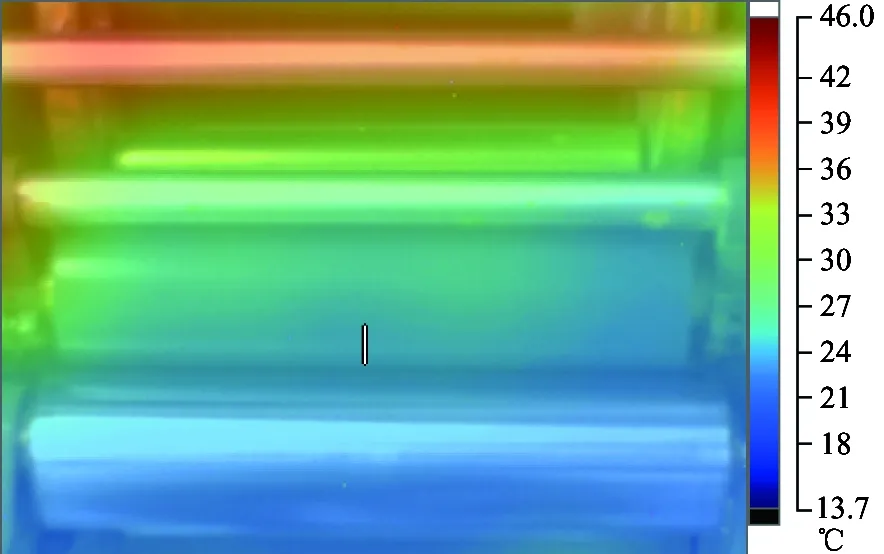
Fig.14 Infrared thermal image figure

Fig.15 Diagram of temperature data of rubber wall
The temperature nephogram of squeezing area extracted along the axial is shown in Fig. 16. The horizontal line in the figure can be divided into 50 points from left to right. Fig.17 is the data diagram of temperature close to squeezing area along axial direction, and the temperature in squeezing area along axial direction is almost consistent.
(4) Comparative analysis between simulation and experiment data
In the experiment, the temperature data in end face of squeezing area measured by the infrared thermometer is higher than that of infrared thermal imager and the simulation data. This is because the temperature data in end face is influenced by the heat generated by rotating friction of supporting part of two rollers, and measuring errors between the two instruments are unignorable.
However, the simulation data are close to the data measured by the infrared thermal imager. For example, in Table 2 the highest temperature corresponding to number 1 is 34.829℃. The environment temperature is 20℃, so the rise of temperature is 14.829℃. what’s more, in Figs 14 and 15, the environment temperature is 13.7℃, and the temperature near squeezing area is 24.9℃, so the rise of temperature is 11.2℃. The actual rise of temperature in squeezing area will be higher and close to the simulation data, which verifies the validity of simulation model and method.
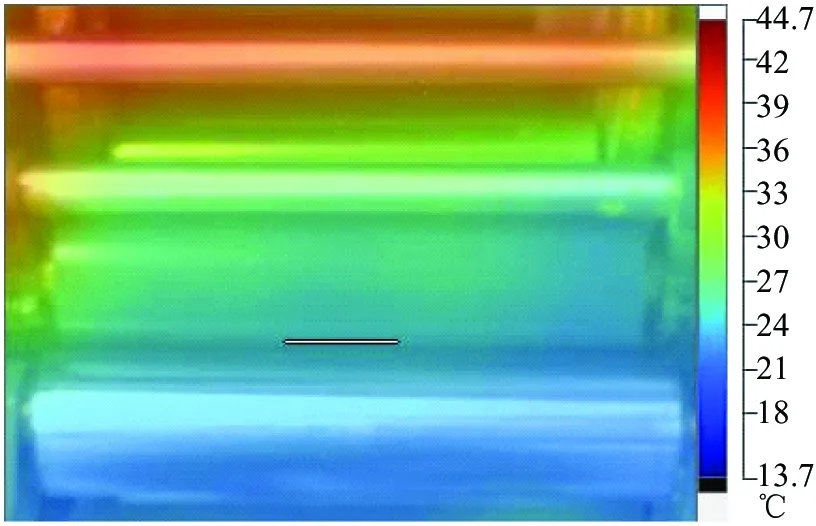
Fig.16 Infrared thermal image figure

Fig.17 Data diagram of axial temperature
It should be noted that, in the squeezing contact and rotating process of steel-rubber roller, there exists a small amount of relative sliding in contact area, which means there exists frictional heat caused by sliding. Both in simulation and experimental analysis, the temperature data obtained both conclude that the rise of temperature is caused by frictional heat. However, because the relative sliding is small here[14], the frictional heat is lower compared with the heat generated by rubber viscous hysteresis, so the rise of temperature is mainly caused by latter, which can also be verified by the phenomenon that, in the situation that there contains a layer of fluid between two rollers, that is, the two rollers are not in direct contact, and the temperature is still increasing.
4 Conclusions
By the temperature field simulation of the process of squeezing and rotating steel-rubber roller and experimental analysis, it can be concluded that:
(1) In the process of rotating and squeezing, due to the viscoelasticity of rubber layer causing deformation hysteresis, loss of mechanical energy is transformed into heat energy which causes the increasing of temperature of steel-rubber roller in the rotating process.
(2) The simulation analysis shows that, due to the thermal conductivity of material, the temperature field of rubber roller presents a certain gradient distribution while the whole steel roller is maintained at a certain temperature.The temperature of rubber roller gradually reduces from outside to inner along the radial direction, the closer the position is to inner wall face, the temperature drops faster. Along the direction of rotating wall, the temperature near squeezing area is higher than that far away from there. The experimental data obtained by the infrared thermal imager have the same regulation.
(3) It can be concluded from simulation and experimental analysis that, with the increase of pressure between two rollers, the rise of temperature of steel-rubber structure will also increase. Similarly, with the increase of rolling velocity, the rise of temperature of steel-rubber structure will also increase.
(4) In this paper, the simulation and experimental analysis come to the same temperature distribution rule, and the numerical values of them are similar, which proves the validity of simulation model and method.
[ 1] Lin Y J, Hwang S J. Temperature prediction of rolling Tires by computer simulation. Mathematics and Computers in Simulation, 2004, 67(3): 235-249
[ 2] Narasimha Rao K V, Krishna K R, Bohara P C, et al. A finite element algorithm for the prediction of steady-state temperatures of rolling tires. Tire Science and Technology, 2006,34 (3): 195-214
[ 3] Futamura S, Goldstein A. A simple method of handling thermomechanical coupling for temperature computation in a rolling tire. Tire Science and Technology, 2004, 32(2): 56-68
[ 4] He Y. Research on Unsteady Temperature Field of Tire: [Ph.D dissertation]. Wuhan: Mechanical and Electrical Engineering Institute, Huazhong University of Science and Technology, 2005.10-12 (In Chinese)
[ 5] Hao S W. Research of Rolling Resistance and Steady State rolling Temperature Field in Truck Tires: [Master degree dissertation]. Guangzhou: Institute of Mechanical and Automotive Engineering South China University of Technology, 2012. 11-14
[ 6] Han Z X. Simulation Analysis of Temperature Field of the Offset Inking System: [Master degree dissertation]. Xi’an: College of Printing and Packaging Engineering,Xi’an University of Technology, 2014. 17-27
[ 7] Liu G J, Sun H F. Study on occurring mechanism of viscous elasticity delayed energy consumption of engineering plastics. China Plastics Industry, 2003,2(31):39-41
[ 8] Chen P. Structure and Properties of Polymer. Beijing: Chemical Industry Press, 1983. 231
[ 9] Liu X P. Finite Element Analysis of Temperature Rise in Rubber Composites Under Cyclic Loading: [Master degree dissertation]. Shenyang: College of Science, Northeastern University, 2014. 27-28
[ 10] Song X G. Modeling and Simulation of Finite Element Analysis of Tire Steady Temperature Field: [Master degree dissertation]. Harbin: School of Traffic, Northeast Forestry University, 2012. 25-30
[11] Xu C C, Zhou W Y. Progress in damping rubber materials. China Synthetic Rubber Industry, 2006, (29)5:388-391
[12] Lu N Y. Analysis of Temperature Field Bidirectional Coupling Characteristics for Stress of a Spaced-damping Layer Bogie Wheel: [Master degree dissertation]. Taiyuan: College of Mechanical Engineering, Taiyuan University of Science and Technology, 2011. 55
[13] Zhang L K. Research on Temperature Field of High Elastic Plastic Alloy Coupling. Chongqing: College of Mechanical Engineering, Chongqing University, 2014. 29
[14] Chu H Y, Zhao J T, Cai L A. Motion mechanism analysis of two contacting rollers. High Technology Letters, 2015, 21(4):388-398
10.3772/j.issn.1006-6748.2017.04.010
①Supported by the National Natural Science Foundation of China (No. 51675010) and Science Technology Project of Beijing Municipal Education Commission (KM201710005015).
②To whom correspondence should be addressed. E-mail: 15501270522@163.com
on Dec. 29, 2016*, Huang Wei**
her Ph.D degree in Beijing University of Technology in 2003. She also received her B.S. and M.S. degrees from Jilin University of Technology in 1994 and 1997 respectively. Her research interests include sheet metal forming, production planning and scheduling, and printing colour quality control.
 High Technology Letters2017年4期
- High Technology Letters的其它文章
- A novel conditional diagnosability algorithm under the PMC model①
- Novel differential evolution algorithm with spatial evolution rules①
- First order sensitivity analysis of magnetorheological fluid damper based on the output damping force①
- Studies on China graphene research based on the analysis of National Science and Technology Reports①
- Operation of the main steam inlet and outlet interface pipe of a nuclear power station①
- Research on a toolpath generation method of NC milling based on space-filling curve①