2018.08
2018-12-10 19:04:26byCottonIncorporated
China Textile 2018年9期
by Cotton Incorporated
Recent price movement
In contrast to recent months, when cotton prices have been volatile, several benchmarks were stable over the past month. Indian and Pakistani prices, however, increased.
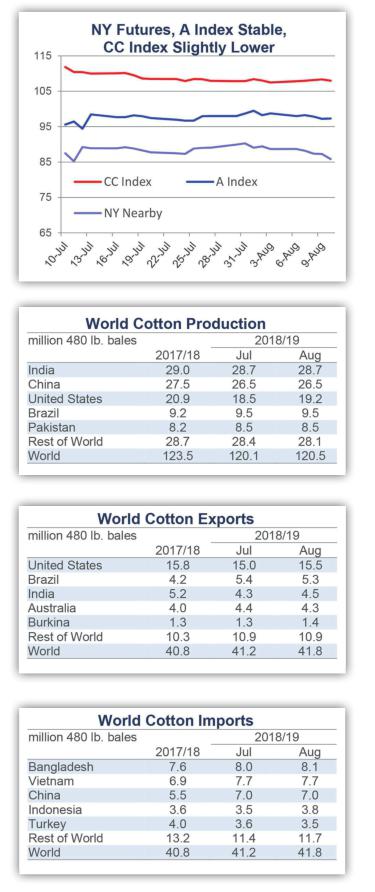
Prices for the December NY Futures contract were generally contained between 85 and 90 cents/lb between midJuly and early August.
The A Index also moved sideways over the past month, with values ranging between 94 and 100 cents/lb since midJuly.
The China Cotton Index (CC Index Grade 3128B) decreased in dollar terms last month, dropping from 112 to 108 cents/lb. This was primarily a result of the RMB weakening against the dollar(RMB fell 3% between mid-July through and early August, and has declined 7% against the USD since April). In domestic terms, the CC Index has held to values near 16,200 RMB/ton since mid-July.
Indian cotton prices, represented by the Shankar-6 quality, increased in slightly international and domestic terms, rising from 88 to 90 cents/lb and 47,000 to 48,000 INR/candy.
Pakistan cotton prices also increased in international and domestic terms, rising from 82 to 88 cents/lb and from 8,200 to 9,000 PKR/maund.
Supply, demand, & trade
This months USDA report featured increases to 2018/19 production and milluse forecasts. The global crop number increased from 120.1 to 120.5 million bales. The global consumption number increased from 127.0 to 127.6 million bales. The estimate for global mill-use in the recently concluded 2017/18 crop year was lifted 500,000 bales (from 122.2 to 122.7 million). With world production in 2017/18 lower (-180,000 bales, to 123.5 million), an effect of greater mill-use last crop year was to lower the estimate for 2018/19 beginning stocks (from 85.0 to 84.5 million bales). This decrease in beginning stocks, along with the larger upward revision for 2018/19 mill-use than for the 2018/19 harvest, pushed the projection for 2018/19 global ending stocks lower, from 77.8 to 77.1 million bales.
At the country-level, the largest changes to 2018/19 production figures include those for the U.S. (+735,000, to 19.2 million), Argentina (+210,000, to 825,000 to 1.0 million), Turkey(+200,000, to 4.5 million), Australia(-100,000, to 3.6 million), Turkmenistan(-100,000, to 1.3 million), and Uzbekistan(-450,000, to 3.3 million).
Between July and August of each year, there is a shift in the office within the USDA that is responsible for generating the U.S. production forecast. The change in office implies a change in methodology, and this can result in important adjustments to the U.S. production estimate this time of year. This months increase to the U.S. production forecast is notable because of the severe drought in Texas and Oklahoma, a region with a high concentration of cotton acre- age and little irrigation. The severity of the drought was reflected in the increase of the proportion of U.S. planted acres expected to be abandoned (from 15% in July to 25% in August). Outside of Texas and Oklahoma, however, growing conditions have generally been good. This months upward revision to the U.S. production forecast was driven by upward revisions to yield forecasts outside of drought-stricken areas. The USDA is currently predicting a new national record for yield per harvested acre in 2018/19(yield per harvested acre calculation excludes abandoned acreage).
The largest country-level changes to 2018/19 mill-use figures include those for Pakistan (+300,000, to 11.0 million), Indonesia (+150,000, to 3.7 million), and Turkey (+100,000, to 7.5 million).
The global trade estimate for 2018/19 was increased 500,000 bales to 41.8 million bales. The largest changes to import forecasts included those for Indonesia (+250,000, to 3.8 million), Pakistan (+200,000, to 2.5 million), Bangladesh (+100,000 bales, to 8.1 million), and Turkey (-100,000, to 3.5 million). The largest changes to export forecasts included those for the U.S. (+500,000 bales, to 15.5 million), India (+200,000, to 4.5 million), Burkina Faso (+100,000, to 1.4 million), Australia (-100,000, to 4.3 million), and Brazil (-100,000, to 5.3 million).
Price outlook
Issues related to trade remain central to the price outlook, with the dominant question continuing to be how much China might increase imports. Significant differences of opinion persist in forecasts for Chinese imports in 2018/19 (USDA forecast of 7.0 million bales, Cotlook forecast of 11.4 million bales is more than 60% higher). A point of contention among forecast- ers is whether or not the Chinese government might decide to import cotton into its reserve system.
As expected, Chinese officials announced that sales from its reserve system would be extended through the end of September (initially scheduled to conclude with the end of August, 8.5 million bales have been sold in auctions since March). News of the extension suggests the possibility for more cotton to move out of Chinas reserves. In turn, this may nudge forward a possible need to bring more supply into the reserve system through imports.
Relative to Chinas 2018/19 import volume, the continual escalation in the trade dispute between the U.S. and China is a complicating factor, particularly if China were to increase imports on a scale suggested by Cotlook (+5.7 million bales versus the 5.6 million imported in 2017/18). A natural source of supply to meet rising Chinese import demand would be the U.S. This is simply because the U.S. has much more exportable supply than other countries. In 2017/18, the U.S. shipped more than three times as much as the second largest exporter(U.S. 15.8 million bales, India 5.2 million). Including India, it would take the sum of shipments from the next five largest shippers to equal the volume sent from U.S. ports last crop year.
Given the exportable volume available from the U.S. and comparatively limited supplies from other sources, if China were to increase imports by several million bales, it is not clear where that cotton would come from if it did not somehow involve a meaningful increase in U.S. export demand. To a certain extent, it is possible to expect that trade could be redistributed, with more non-U.S. cotton flowing to China and more U.S. cotton going to other importing countries. This market adaptation, along with the fact that certain categories of Chinese imports from the U.S. are exempt from the increase in tariffs (e.g., processing trade quota that requires downstream textile goods to be exported and imports into free trade zones with China), suggest that the global cotton trade could accommodate both an increase in Chinese imports and restraints on the direct flow of cotton from the U.S. to China. However, if the Chinese government does decide to import for its reserve system, the potential size of the increase in global import demand could test the markets ability to cope, especially if weather conditions in exporting countries pull production and exportable supplies lower.

- China Textile的其它文章
- Tekboy Textile & Dyeing Inc.reflects the difference of Goller Machines in their production
- The importance of social influencers
- ITMA returns to Milan again
- GONG Hangyu:An international cultural ambassador using Cheongsams to keep pace with the world
- New development of the industry with sustainable Chinese textile culture
- Milan fashion comes to Keqiao