鋰離子電池負(fù)極硅-熱解碳-石墨復(fù)合材料的制備及性能
2019-03-13 03:08:20楊學(xué)兵張林偉
無(wú)機(jī)化學(xué)學(xué)報(bào) 2019年3期
關(guān)鍵詞:復(fù)合材料
楊學(xué)兵 張林偉
(江西省科學(xué)院應(yīng)用物理研究所,南昌 330029)
Development of portable electronic devices and electrical vehicles requires high energy density of batteries.The use of electrode materials with high specific capacity can increase the energy density of lithium-ion batteries.Graphite is the most common anode material in commercial lithium-ion batteries.Theoretical specific capacity of graphite is 372 mAh·g-1[1].Silicon is another kind of anode material for lithium-ion batteries with theoretical specific capacity of 4 200 mAh·g-1when the reaction product between silicon and lithium is Li22Si4[2].In comparison with graphite,theoretical specific capacity of silicon is higher and the operating potential of silicon is lower.Thus,silicon is a promising anode material for lithium-ion batteries[3-5].
However,cycle discharge stability of silicon electrodes is low.The main reason for the problem is the volume change of silicon during discharge and charge.During discharge,the volume expansion of silicon is about 300%[6].The volume change of silicon destroys the inter-particle electric contact.Besides,the volume change breaks the solid-electrolyte interface film and exposes the fresh interface[7].The fresh interface consumes electrolyte and new solidelectrolyte interface film forms. Breakage and formation of solid-electrolyte interface film makes the film thick. Thick interface film lowers the electrochemical activity of silicon and reduces the discharge capacity.
Strategies have been developed to improve the electrochemical performance of silicon anodes.One strategy is the fabrication of silicon material with nano-structure such ashollow nano-spheresand nanotubes[8].Hollow silicon nano-spheres and silicon nanotubes have large void space which accommodates the volume change of silicon in processes of discharge and charge.Another strategy is preparation of electrically conductive coatings[9-13].Carbon coating and electrically conductive polymer coatings increase the electric conductivity of silicon and buffer the volume change of silicon.
The reports indicate that it is important to increase the electric conductivity of silicon and buffer the volume change of silicon.In this paper,pyrolytic carbon from pitch has been used to increase the electric conductivity ofsilicon and improve the adhesion between silicon and graphite.Siliconpyrolytic carbon-graphite composite with different content of pyrolytic carbon has been synthesized through pyrolysis.
1 Experimental
1.1 Preparation and characterization of siliconpyrolytic carbon-graphite composite
Silicon-pyrolytic carbon-graphite composite was synthesized by heating the mixture of silicon,pitch and graphite.Pitch was the carbon precursor used to fabricate pyrolytic carbon.Silicon(Shuitian ST-NANO Science&Technology Co.,Ltd.,Shanghai,China),pitch and graphite(10 μm,Tianhe Graphite Co.,Ltd.,Qingdao,China)were mixed by milling in mass ratios of 1 ∶0.5 ∶7 and 1 ∶1 ∶7 respectively.After the mixture was dried at 70℃for 2 h,the mixture was heated at 900℃for 2 h in the atmosphere of nitrogen gas.The product was silicon-pyrolytic carbon-graphite composite.Silicon-pyrolytic carbon-graphite composite-1 and silicon-pyrolytic carbon-graphite composite-2 correspond to the mass ratios of 1 ∶0.5 ∶7 and 1 ∶1 ∶7 respectively.Silicon-graphite composite was synthesized by milling mixture of silicon and graphite in mass ratio of 1∶7.
Morphology and element composition of materials were tested by scanning electron microscopy(SEM)with operation voltage of 15 kV.Crystal structure of materials was analyzed by X-ray diffraction(XRD,Cu Kα radiation(λ=0.154 06 nm,U=40 kV,I=30 mA))in the 2θ range of 10°~90°.Chemical bonds of materials were analyzed through infrared spectra and Raman spectra.Thermo-gravimetric(TG)analysis was carried out by TG instrument in the atmosphere of nitrogen.
1.2 Fabrication of silicon-pyrolytic carbongraphite electrodes and assembly of coin cells
The electrodes were fabricated by mixing active materials,electrically conductive substance and binder in mass ratio of 8 ∶1 ∶1.The binder was LA133(15%(w/w),Chengdu Indigo powersourcesCo.,Ltd.,Chengdu,China).LA133 was dissolved in water at first.Then silicon-pyrolytic carbon-graphite composite and conductive carbon were added to the solution.After stirring,the slurry was spread over the surface of copper foil.Subsequently,the copper foil was dried under vacuum at 80℃for 12 h.Finally,the copper foil was punched to obtain circular electrodes with diameter of 12 mm.Silicon-graphite composite electrodes were fabricated according to the above method.
Coin cells(CR2016)were assembled in glove box(MIKROUNA)filled with purified argon gas.Lithium metal foils were used as counter electrodes to silicon-pyrolytic carbon-graphite electrodes.Separator between the two kinds of electrodes was polypropylene microporous film (Celgard 2400).Cyclic voltammetry tests were carried out through electrochemical work station(Ivium Technologies).Discharge and charge capacity of coin cells were obtained through battery test system(Neware,Shenzhen,China).The rate of discharge and charge was 0.1C and the potential range was from 0.005 to 1.2 V.Theoretical capacity of composite was based on the content of components.Calculated theoretical capacity of silicon,graphite and pyrolytic carbon were 3 500,350 and 300 mAh·g-1respectively.
2 Results and discussion
The SEM images of graphite and silicon are presented in Fig.1.Graphite was composed of particles with irregular shape(Fig.1(a)).Particle size of graphite was about 10 μm.Silicon was composed of tiny particles with the diameter below 500 nm,and the particle size was close in Fig.1(b).
SEM images of silicon-graphite composite,siliconpyrolytic carbon-graphite composite-1 and siliconpyrolytic carbon-graphite composite-2 are presented in Fig.2.Silicon particles were dispersed although few silicon particles was on the surface of graphite flakes in Fig.2(a).Silicon particles of silicon-pyrolytic carbongraphite composite-1 were dispersed on the surface of graphite in Fig.2(b).Pyrolytic carbon from pitch was not obvious in the figure as it was amorphous.In Fig.2(c),morphology of silicon particles was similar to that in Fig.2(b).The increase of the content of pyrolytic carbon from pitch has not obviously changed the morphology of silicon particles.

Fig.1 SEM images of graphite(a)and silicon(b)

Fig.2 SEM images of silicon-graphite composite(a),silicon-pyrolytic carbon-graphite composite-1(b)and silicon-pyrolytic carbon-graphite composite-2(c)
Fig.3 presents the XRD patterns of graphite,silicon,pitch,pyrolytic carbon,silicon-graphite composite,silicon-pyrolytic carbon-graphite composite-1 and silicon-pyrolytic carbon-graphite composite-2.In the XRD pattern of graphite,the diffraction peak at about 26.6°corresponded to(002)crystal plane(PDF No.65-6212).This sharp diffraction peak indicated that the crystallization degree of graphite was high.The other diffraction peaks at 44.2°and 54.5°were ascribed to (101)and (004)crystal planes respectively.In the XRD pattern of silicon,there were several sharp diffraction peaks which demonstrated that the high crystallization degree of silicon.The highest diffraction peak was at about 28.4°corresponding to the (111)crystal plane (PDF No.27-1402)[14].The broad diffraction peak of pitch at about 24.4°is ascribed to the low crystallization degree of pitch.The intensity of diffraction peaks of pyrolytic carbon at about 25.3°was stronger than that of pitch,which demonstrated the highercrystallization degree of pyrolytic carbon.The diffraction peaks of graphite and silicon existed in XRD pattern of silicon-graphite composite,and the intensity of diffraction peaks of silicon was lower than that of graphite.The low relative intensity showes the low content of silicon in silicon-graphite composite.The diffraction peaks of pyrolytic carbon were not obvious in the XRD patterns of silicon-pyrolytic carbon-graphite composite-1 and silicon-pyrolytic carbon-graphite composite-2.
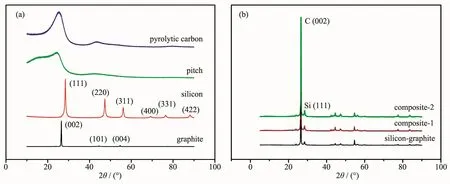
Fig.3 XRD patterns of graphite,silicon,pitch,pyrolytic carbon,silicon-graphite composite,silicon-pyrolytic carbon-graphite composite-1 and silicon-pyrolytic carbon-graphite composite-2
Fig.4 shows the Raman spectra of the materials.In the Raman spectrum of graphite,the D-band was at about 1 346 cm-1and the G-band was at about 1 573 cm-1[15-16].The D-band was linked with disorder in carbon structure and the G-band was ascribed to vibration of carbon atoms with sp2bonds[17-18].The high relative intensity of G-band demonstrated the high graphitization degree of graphite.The peak at about 514 cm-1was belonged to silicon in the Raman spectrum of silicon.The Raman bands of pitch were not obvious.The D-band and G-band of pyrolytic carbon were at about 1 329 and 1 599 cm-1respectively.In comparison with pitch,Raman bands of pyrolytic carbon were apparent,which results from the carbonization ofpitch through pyrolysisprocess.Relative intensity for G-band of pyrolytic carbon was lower than that of graphite.The result indicated that graphitization degree of pyrolytic carbon is lower than that of graphite.The D-band and G-band existed in the Raman spectra of silicon-graphite composite.The relative intensity for G-band was relatively high.The Raman band of silicon,D-band and G-band were appared in the Raman spectra of silicon-pyrolytic carbon-graphite composite-1 and silicon-pyrolytic carbon-graphite composite-2.The D-band and G-band are produced by pyrolytic carbon and graphite.
Fig.5 shows the FT-IR spectra of the materials.In the FT-IR spectrum of graphite,there were two absorption bands at about 1 637 and 3 445 cm-1respectively.The two absorption bands correspond to the vibration ofhydrogen-oxygen bonds in adsorbed water[19].FT-IR spectrum of silicon was similar to that of graphite.There was an absorption band at about 742 cm-1in the FT-IR spectrum of pitch which was linked with vibration of carbon-hydrogen bonds[20].The result demonstrated the existence of hydrogen element in pitch.The absorption band of carbon-hydrogen bonds disappeared in the FT-IR spectrum of pyrolytic carbon.The disappearance of absorption band results from the removalofhydrogen through pyrolysis process.FT-IR spectrum of silicon-graphite composite was similar to that of silicon.There was not obvious difference between the FT-IR spectrum of siliconpyrolytic carbon-graphite composite-1 and that of silicon-pyrolytic carbon-graphite composite-2.The increase in content of pyrolytic carbon does not obviously change the FT-IR spectrum.
Thermo-gravimetric curve of pitch is presented in Fig.6.When the temperature was below 320℃,the mass ofpitch was nearly unchanged.As the temperature increased from 320 to 560℃,the mass of pitch decreased rapidly.The decrease of mass results from removal of hydrogen in pitch.With the increase of temperature,the mass of pitch keeps relatively stable.The mass maintained stable after the complete decomposition of pitch.The stable mass rate was about 65%through the pyrolysis process.
Fig.7 presents SEM image,EDS mappings and TEM image of silicon-pyrolytic carbon composite-1.The element distribution of those silicon particles in Fig.7a are showed in the EDS mappings(Fig.7(b,c)).It can be seen that the distribution of carbon was similar to that of silicon which indicated that pyrolytic carbon exists on the surface of silicon particles.In Fig.7(d),it can be seen that silicon particles were wrapped by pyrolytic carbon.
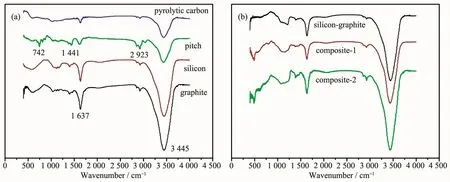
Fig.5 FT-IR spectra of graphite,silicon pitch,pyrolytic carbon,silicon-graphite composite,silicon-pyrolytic carbon-graphite composite-1 and silicon-pyrolytic carbon-graphite composite-2
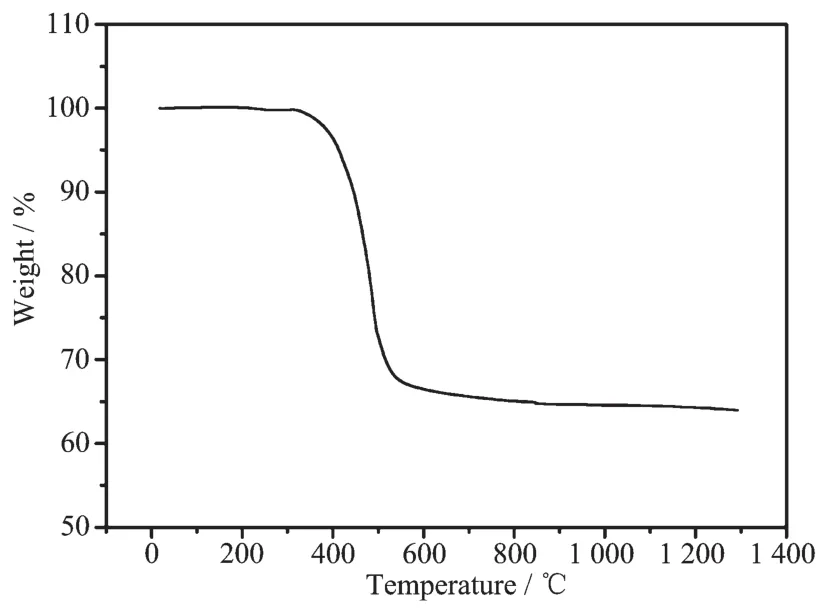
Fig.6 Thermo-gravimetric curve of pitch
Fig.8 shows the discharge and charge curves of silicon-graphite composite,silicon-pyrolytic carbongraphite composite-1 and silicon-pyrolytic carbongraphite composite-2 electrode.In the first cycle of silicon-graphite composite electrode,the discharge capacity, the charge capacity and the initial coulombic efficiency was about 660,527 mAh·g-1and 79.8%,respectively.In the second cycle of silicongraphite composite,discharge and charge capacity were lower than those of the first cycle.The reason is that a part of lithium ions existed in the solid interface film on silicon-graphite electrode.The discharge voltage in the second cycle was higher than that in the first cycle because of the activation of silicon-graphite composite electrode.The discharge and charge capacity decreased with the increase of cycle number,whereas the potential of discharge and charge was close.Fig.8(b)presents the discharge and charge curvesofsilicon-pyrolytic carbon-graphite composite-1 electrode.In the first cycle,discharge capacity and charge capacity were 706 and 570 mAh·g-1respectively.The discharge capacity and charge capacity were higher than those of silicon-graphite composite electrode,which results from higher electric conductivity for silicon particles in silicon-pyrolytic carbon-graphitecomposite-1 electrode.The initial coulombic efficiency was 80.7%.When the cycle number increased,the potential of discharge and charge was close.Fig.8(c)shows the discharge and charge curvesofsilicon-pyrolytic carbon-graphite composite-2 electrode.In the first cycle,discharge and charge capacity are 685 and 541 mAh·g-1,respectively.The discharge and charge capacity were lower than those of silicon-pyrolytic carbon-graphite composite-1 electrode.The increase of the content of pyrolytic carbon results in the decrease of discharge and charge capacity.Excessive pyrolytic carbon does not obviously increase the electric conductivity of silicon particles.
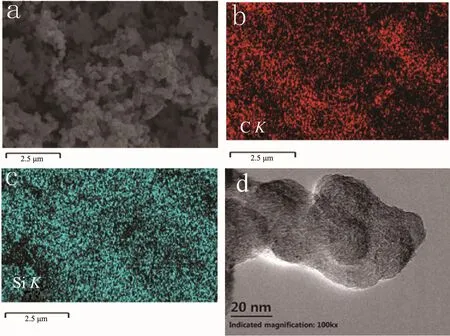
Fig.7 SEM image(a),EDS mappings(b,c)and TEM image(d)of silicon-pyrolytic carbon-graphite composite-1

Fig.8 Discharge and charge curves of silicon-graphite composite(a),silicon-pyrolytic carbon-graphite composite-1(b)and silicon-pyrolytic carbon-graphite composite-2(c)electrode
Cyclic voltammetry curves of the three kinds of composite electrode are shown in Fig.9.In Fig.9(a),the reduction peak at~0 V corresponds to lithiation of silicon and graphite.The intensity of reduction peak above 0 V increased with the increase of the cycle number,which results from activation of silicongraphite composite electrode[21-22].The activation of electrode is also verified in Fig.8.The reduction peaks above 0 V in Fig.9(b)were linked with lithiation of amorphous silicon[23].The reduction peaks were more obvious than those of silicon-graphite composite because the pyrolytic carbon covering on silicon particles enhances the electric conductivity of silicon particles.In Fig.9(c), reduction peaks of siliconpyrolytic carbon-graphite composite-2 electrode were similar to those of silicon-pyrolytic carbon-graphite composite-1 in Fig.9(b).
Fig.10 showsthe cycle performance ofthe electrodes.The initial discharge and the second discharge capacity of silicon-graphite composite electrode were 660 and 500 mAh·g-1respectively.The discharge capacity decreases rapidly with the increase of the cycle number because of the big volume change of silicon particles.The big volume change leads to breakage of solid electrolyte interface film and formation of new solid electrolyte interface film which consumed the lithium ions.The discharge capacity of silicon-pyrolytic carbon-graphite composite-1 electrode was higher than that of silicon-graphite composite electrode.Pyrolytic carbon increases the electric conductivity of silicon particles and enhances the electrochemicalactivity.Besides,the cycle stability of silicon-pyrolytic carbon-graphite composite-1 electrode is better than that of silicon-graphite composite electrode in Fig.10.The improvement of cycle stability is ascribed to the strong interface adhesion between silicon particles and graphite through pyrolytic carbon[4].Volume change of silicon particles was effectively relieved by graphite through the strong interface adhesion.The discharge capacity of silicon-pyrolytic carbon-graphite composite-2 composite electrode was lower than that of silicon-pyrolytic carbon-graphite composite-1 electrode.As the content of pyrolytic carbon increased,the electric conductivity of silicon particles could not be further enhanced.At the same time,the discharge capacity of pyrolytic carbon was relatively low.
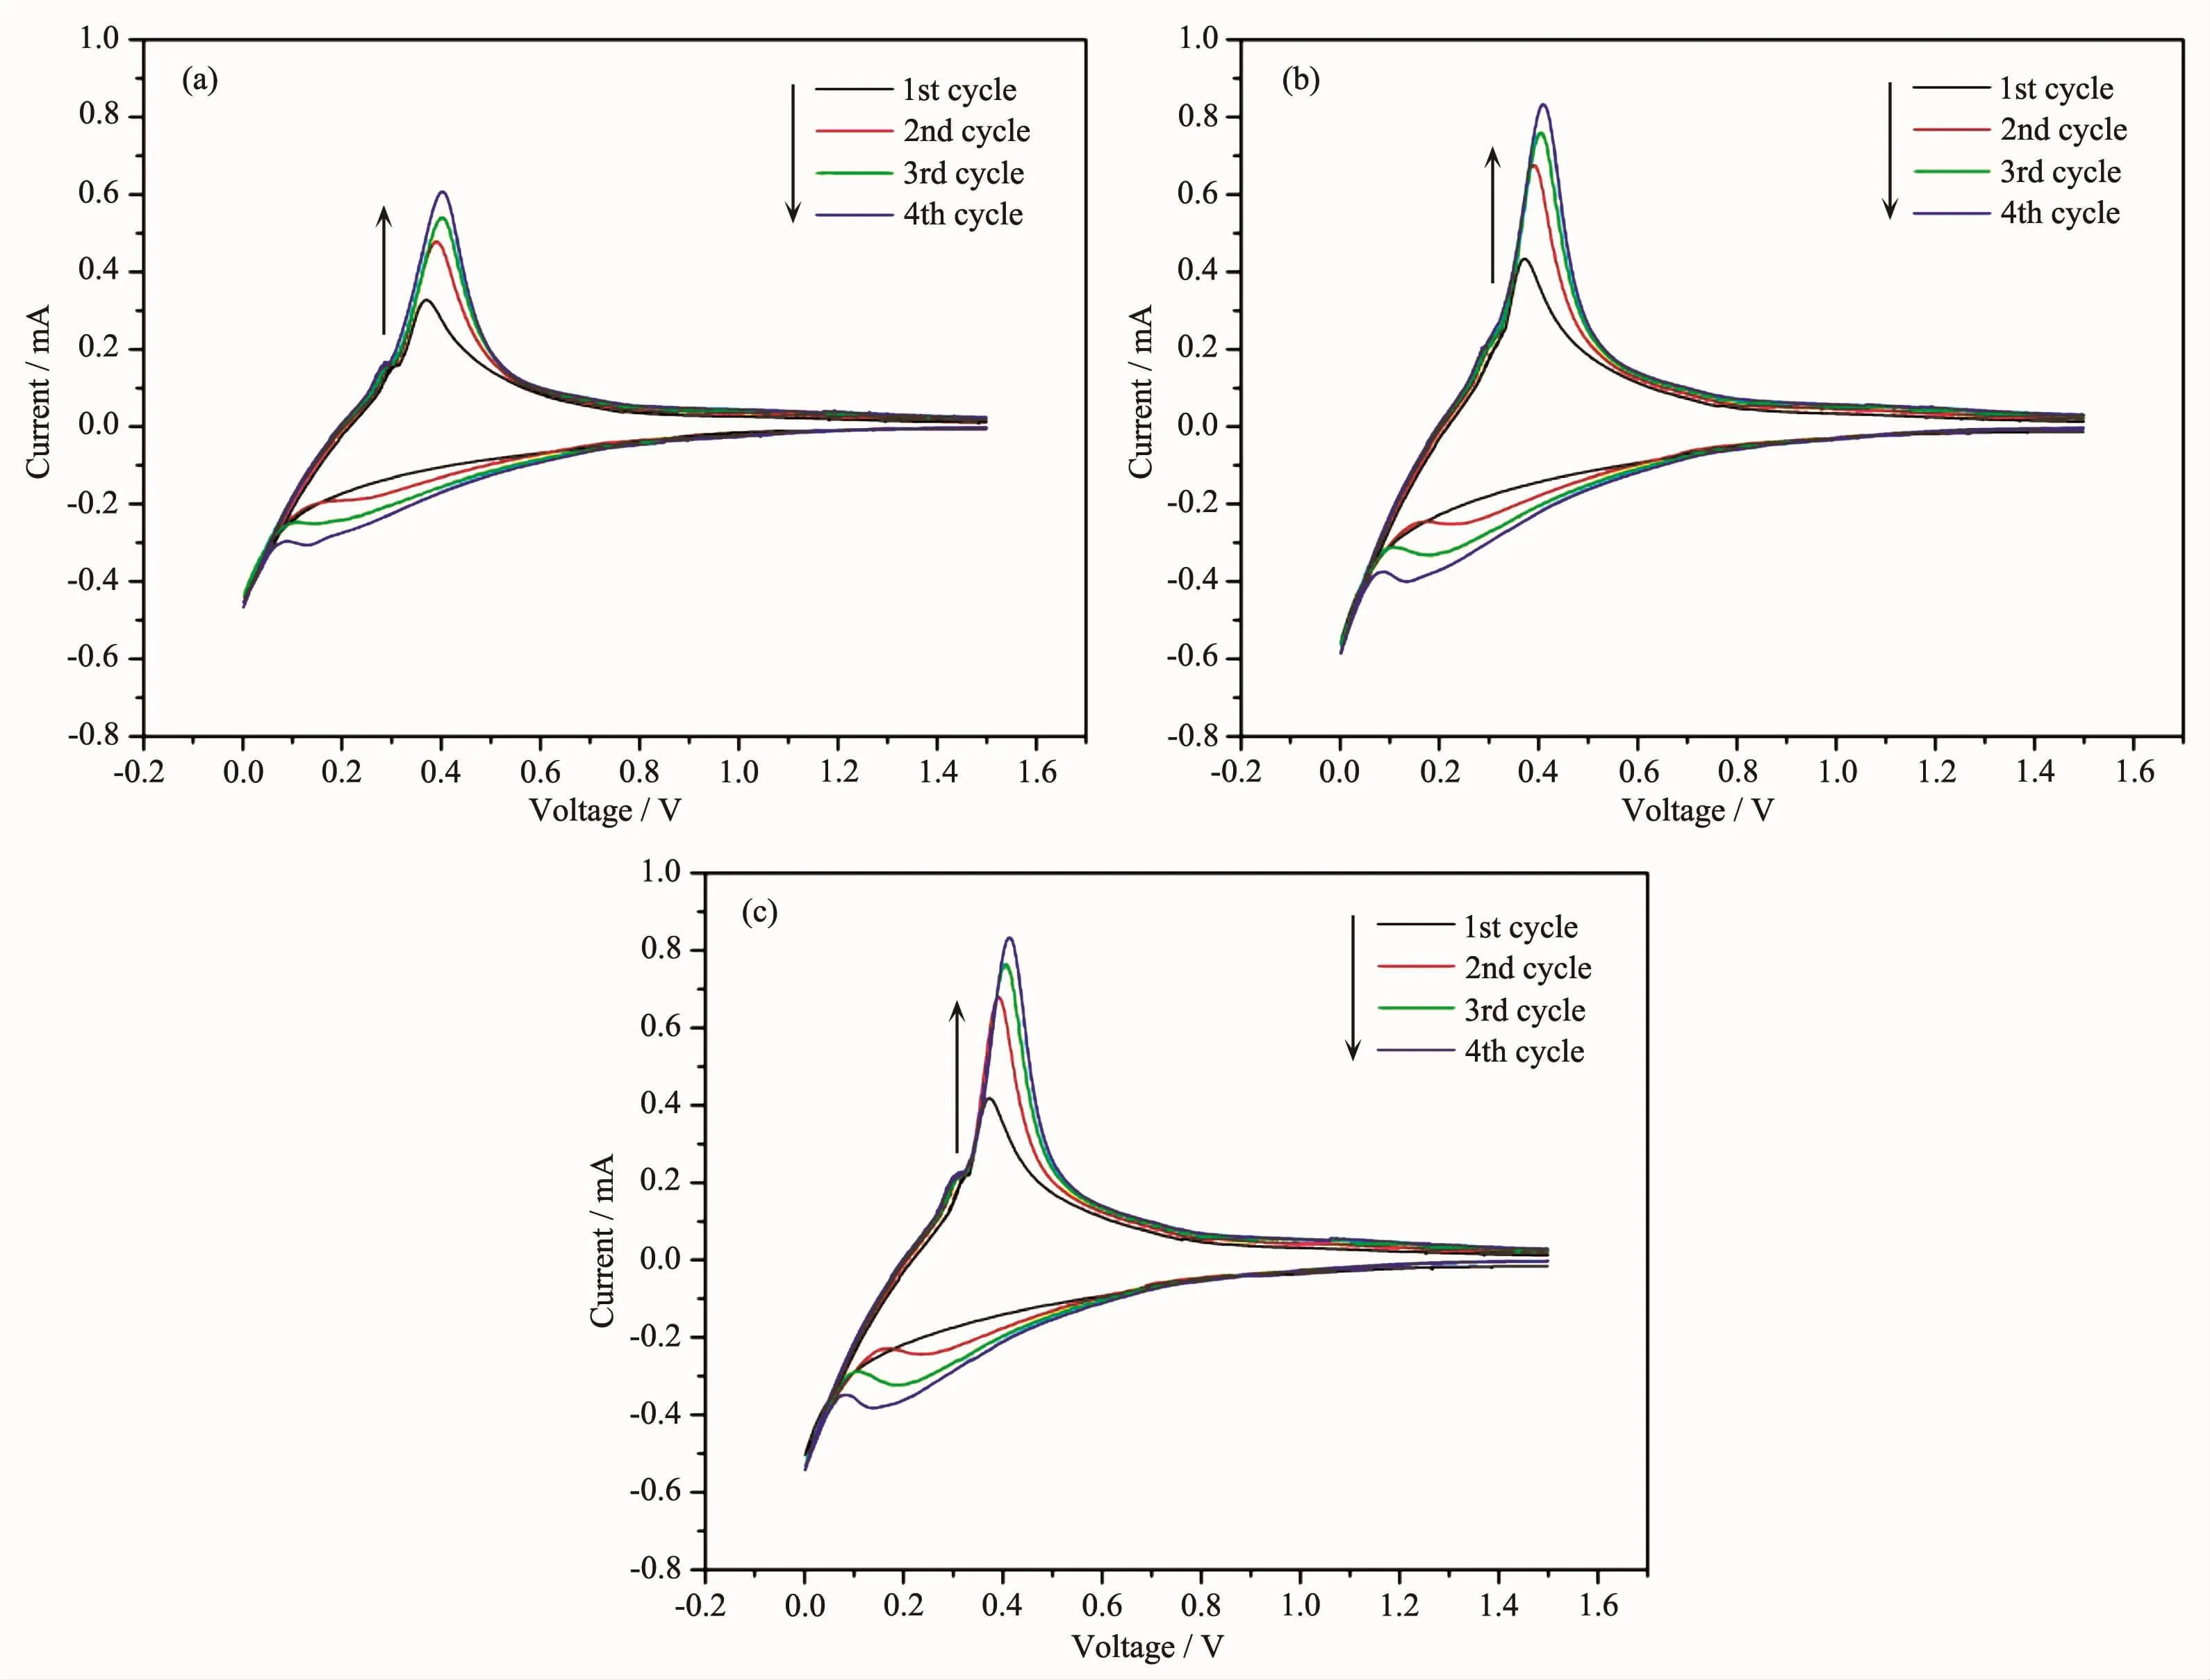
Fig.9 Cyclic voltammetry curves of silicon-graphite composite(a),silicon-pyrolytic carbon-graphite composite-1(b)and silicon-pyrolytic carbon-graphite composite-2(c)electrode
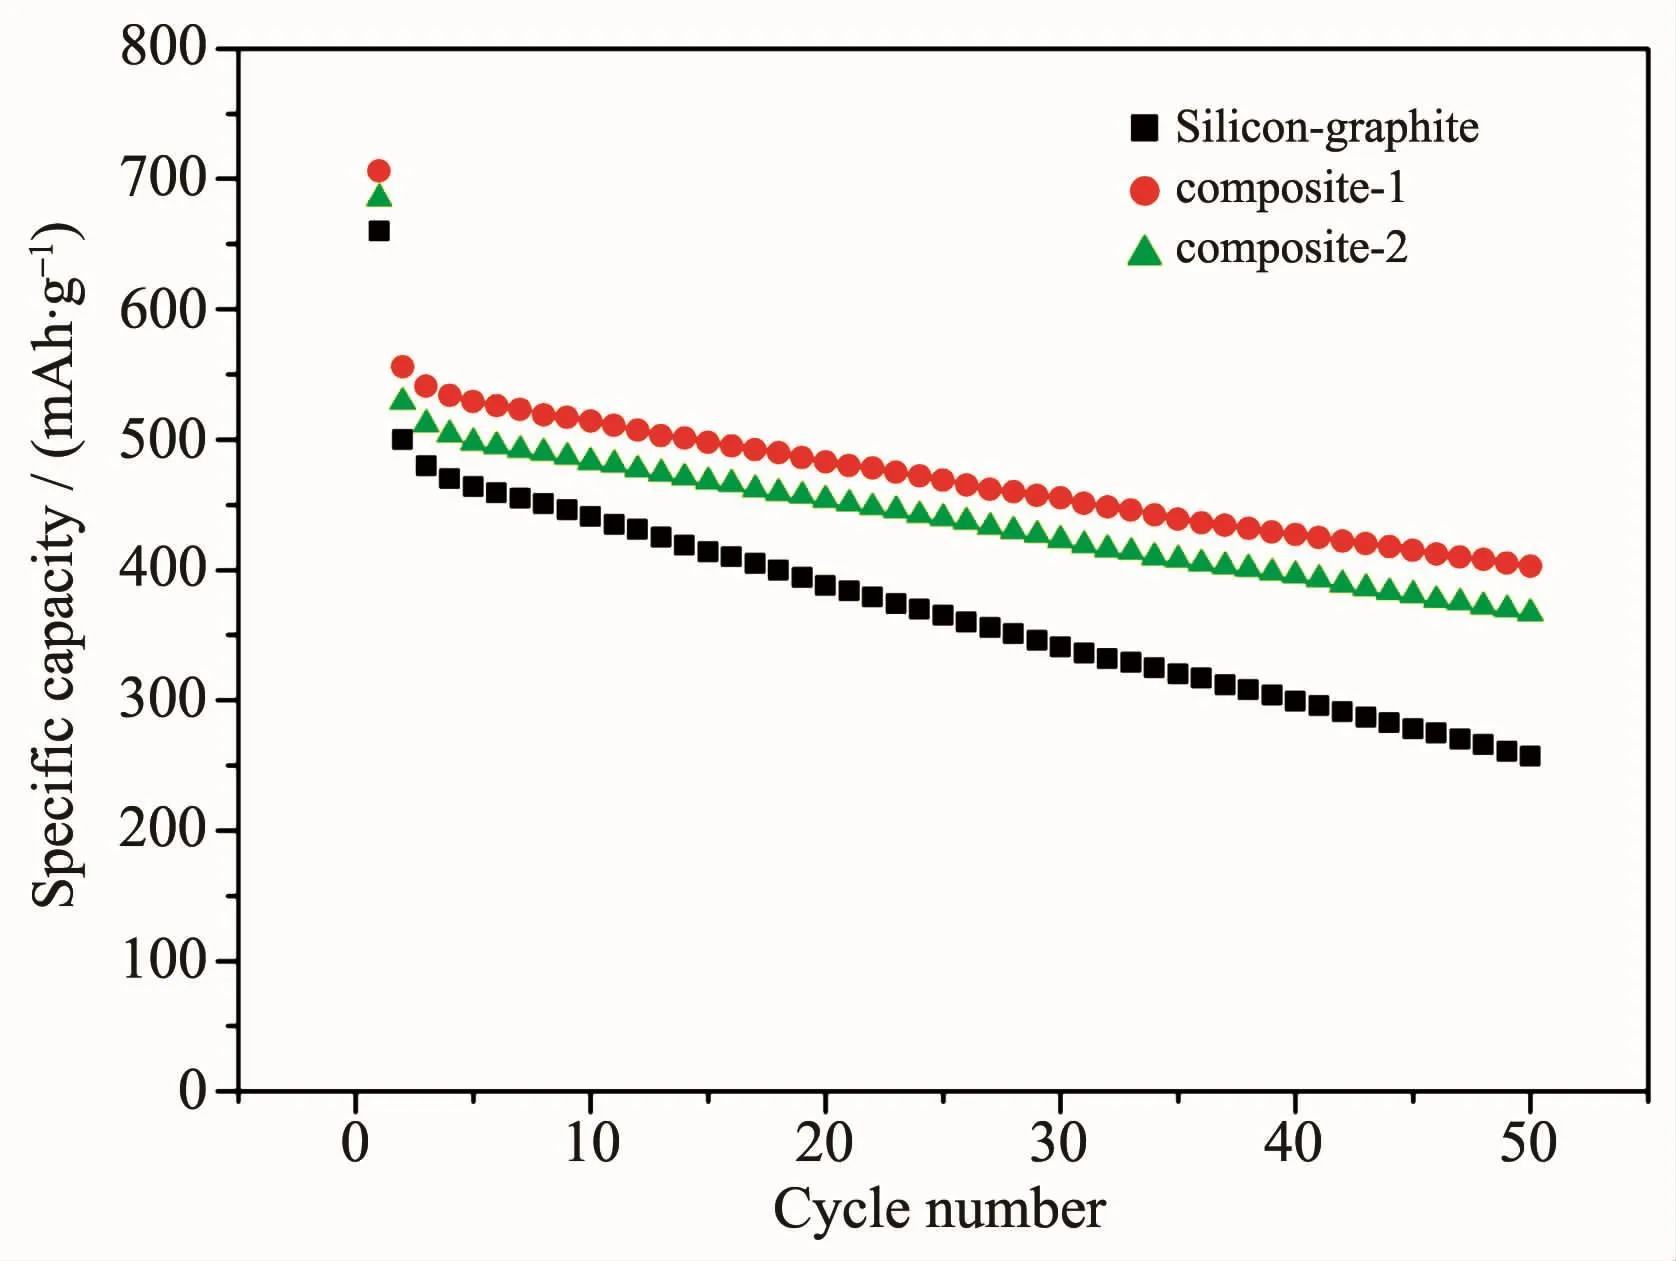
Fig.10 Cycle performance of silicon-graphite composite,silicon-pyrolytic carbon-graphite composite-1 and silicon-pyrolytic carbon-graphite composite-2 electrode
3 Conclusions
In pyrolytic process,the mass of pitch decreased rapidly in temperature range from 320 to 560℃.The decrease of mass results from removal of hydrogen in pitch.The mass ratio between pyrolytic carbon and pitch was about 65%.The silicon particles were dispersed on the surface of graphite.Pyrolytic carbon covered the silicon particles in silicon-pyrolytic carbongraphite composite that increases the electric conductivity of silicon particles and enhances the interface adhesion between silicon particlesand graphite.The appropriate content of pyrolytic carbon increases the discharge capacity and improves cycle stability of composite and the excessive content of pyrolytic carbon does not further enhance discharge capacity.The improvementofcycle stability is ascribed to the strong interface adhesion between silicon particles and graphite.The volume change of silicon particles is effectively relieved by graphite through the strong interface adhesion.
猜你喜歡
建材發(fā)展導(dǎo)向(2022年2期)2022-03-08 01:44:04
建材發(fā)展導(dǎo)向(2021年14期)2021-08-23 00:56:16
中國(guó)材料進(jìn)展(2019年10期)2019-12-07 05:32:14
纖維復(fù)合材料(2018年3期)2018-04-25 07:22:58
電子測(cè)試(2017年11期)2017-12-15 08:57:13
山東工業(yè)技術(shù)(2016年15期)2016-12-01 05:31:34
中國(guó)塑料(2015年6期)2015-11-13 03:02:54
中國(guó)塑料(2015年11期)2015-10-14 01:14:14
中國(guó)塑料(2015年8期)2015-10-14 01:10:41
應(yīng)用化工(2014年10期)2014-08-16 13:11:29
 無(wú)機(jī)化學(xué)學(xué)報(bào)2019年3期
- 無(wú)機(jī)化學(xué)學(xué)報(bào)的其它文章
- 吡嗪酰腙配體CuⅡ/NiⅡ配合物的合成、晶體結(jié)構(gòu)及DNA結(jié)合性質(zhì)
- 低負(fù)載量的雙金屬Au@Pt核殼催化劑催化氧化甲苯
- 兩個(gè)三維鋅Ⅱ配位聚合物的晶體結(jié)構(gòu)及熒光性質(zhì)
- 銅Ⅱ和鎳ⅡSalamo型配合物的合成、晶體結(jié)構(gòu)、Hirshfeld 表面分析、熱穩(wěn)定和熒光性質(zhì)
- 具有同質(zhì)多晶現(xiàn)象的一維和二維鋅Ⅱ配合物的水熱合成及對(duì)苦味酸的可循環(huán)熒光檢測(cè)性能
- 基于5-氯煙酸的鎳Ⅱ和鋅Ⅱ配位聚合物的合成、晶體結(jié)構(gòu)、熒光和磁性質(zhì)