December 2019
2020-02-10 04:11:05byCottonIncorporated
China Textile 2020年1期
by Cotton Incorporated
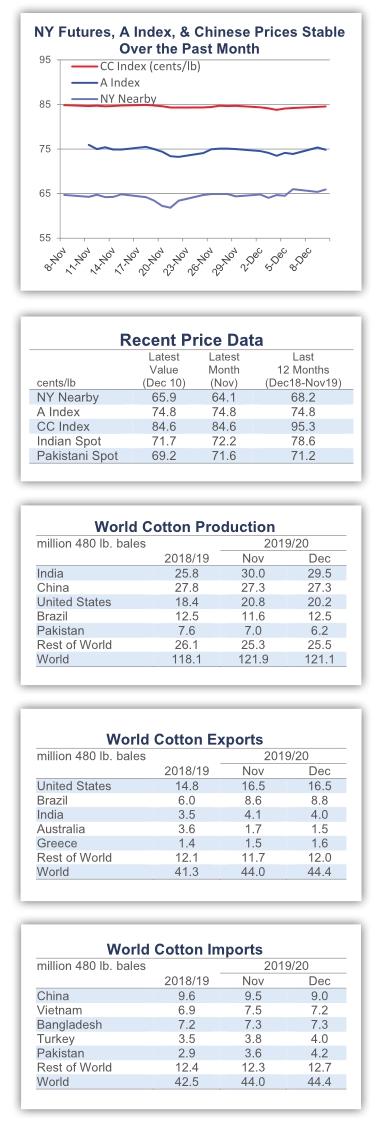
Recent price movement
Most benchmark prices were stable over the past month. Pakistani prices decreased slightly.
The March NY futures contract held to values near 65 cents/lb.
The A Index was steady around 75 cents/lb.
In international terms, the China Cotton Index (CC Index 3128B) consistently traded near 84 cents/lb. In domestic terms, the CC Index traded near 13,050 RMB/ton. The RMB was stable against the dollar over the past month, holding to levels near 7.0 RMB/USD.
Indian cotton prices (Shankar-6 quality) were stable around 71 cents/lb. In domestic terms, values hovered around 40,000 INR/candy. The Indian rupee traded close to 71 INR/USD.
Pakistani prices decreased from 73 to 69 cents/lb in international terms. In domestic terms, values eased from 9,300 to 8,800 PKR/maund. The Pakistani rupee was stable near 155 PKR/USD between mid-November and early December.
Supply, demand, & trade
The latest USDA report featured decreases to both world production(-831,000 to 121.1 million) and milluse (-1.2 million bales to 120.3 million). A series of historical revisions to Indian and Uzbek figures lowered the estimate for global beginning stocks in 2019/20(-864,000 bales to 79.7 million). For 2019/20 ending stocks, this offset the ef- fect of a greater decrease in consumption relative to production, and the estimate for global stocks fell (479,000 bales to 80.3 million).
At the country-level, there were widespread changes to production forecasts. The largest increases were for Brazil (+900,000 bales to 12.5 million), Uzbekistan (+500,000 to 3.6 million), and Greece (+100,000 to 1.7 million). The largest decreases were for Pakistan(-800,000 bales to 6.2 million), the U.S.(-611,000 to 20.2 million), India (-500,000 to 29.5 million), Australia (-350,000 to 0.9 million), Turkey (-200,000 to 3.6 million), and Chad (-110,000 to 90,000).
For mill-use, country-level changes were dominated by China (-1.0 million bales to 38.5 million), but there were also notable revisions for Vietnam (-200,000 to 7.2 million), Pakistan (-100,000 to 10.6 million), and Uzbekistan (+100,000 to 3.1 million).
The global trade forecast increased 400,000 bales to 44.4 million and predicts that global trade in 2019/20 will be 7% (3.1 million bales) higher than it was in 2018/19. In terms of imports, the largest changes included those for Pakistan (+600,000 to 4.2 million), China(-500,000 to 9.0 million), India (+400,000 to 2.2 million), Vietnam (-300,000 to 7.2 million), and Turkey (+200,000 to 4.0 million). In terms of exports, the biggest changes were for Uzbekistan (+250,000 to 3.5 million), Australia (-200,000 to 4.0 million), Brazil (+200,000 to 8.8 million), Greece (+100,000 to 1.6 million), and India (-100,000 to 4.0 million).
The U.S. export forecast was unchanged at 16.5 million bales. If realized, this would be the second-highest volume ever exported by the U.S. The USDA has maintained its prediction for U.S. exports over the past three months. During the same period, the USDA lowered its estimate of the U.S. crop by more than one million bales. A result is that the projection for U.S. ending stocks has fallen, with the expected percentage increase in warehoused supplies in 2019/20 falling from nearly 50% to 25%.
Price outlook
The U.S. China trade dispute remains a central source of uncertainty for the global cotton market. Statements from the U.S. suggesting that the dispute could linger on beyond the (November) 2020 elections, raise the possibility that this uncertainty could continue to dominate the market for some time into the future. Nonetheless, concessions have been made on both sides, and the possibility of a “phase one” agreement endures. China recently granted waivers against tariffs for certain commodities and tariff increases scheduled for implementation on December 15th may be postponed (if not, all U.S. imports of China-made apparel not covered by the September 1st implementation will face a 15 percentage point increases in duty rates and tariffs on Chinese imports of U.S. cotton will rise from 25 to 30 percentage points).
In the latest U.S. apparel import data (for October), shipments from China were down 30% year-over-year in volume terms (square meter equivalence). This followed a 13% decrease last month (first month of heightened tariffs) and signals a reduction in business from China. It is also important that the reduction was accompanied by strong decreases in U.S. imports from all sources (-4% in September,-16% in October in volume terms). The declines in overall volumes indicate that tariffs are not causing a compensating reallocation of orders to alternate sourcing locations. Instead, an apparent effect has been a pullback in overall apparel demand. Over the longer-term, if tariffs remain in place, reallocation may be possible. But in the shortterm, higher sourcing costs from higher tariffs appear to be weakening demand for apparel.
Chinese imports of cotton fiber have also declined in recent months. In each of the last three months of available trade data (August-October), Chinese imports were 32% - 43% lower than one year ago. This is a remarkable shift relative to last crop years large increase in imports. In 2018/19, China imported 70% more cotton than in 2017/18 (+3.9 million bales to 9.5 million). Several factors likely contributed to the reversal. One is the slowdown in the domestic economy and weaker domestic downstream demand. Another is the slowdown in external downstream demand due to tariffs and a slower global economy. A third contributor is that domestic cotton prices have been more attractive relative to imports than they generally are.
Sluggish Chinese mill demand may make it difficult for China to absorb a large increase in imports even if a trade deal is reached. Chinese mill-use in 2019/20 (38.5 million bales) is currently estimated to be one million bales lower than last crop year and two and half million bales lower than it was in 2017/18. It may be possible that the Chinese government could purchase U.S. cotton to rebuild reserves as part of a goodwill gesture as part of a trade deal. However, the reserve system is already taking up cotton from the Chinese harvest and has been reported to have already made significant purchases of Brazilian fiber. Correspondingly, the window for such an opportunity for U.S. cotton may have already narrowed.

- China Textile的其它文章
- Swedish Textile Machinery Association TMAS welcomes two new companies—Coloreel and imogo
- Tech tools for enchanting holiday numbers
- Facilitating trade&cementing friendships at India ITME Society’s 40th Year Celebration
- Advantages of developing textile and apparel industry in Luoshan County
- S&S Intelligent Science and Technology overfulfilled the target for 2019
- Top young talent for a technologically strong industry