AUGUST 2020
2020-11-28 07:31:28byCottonIncorporated
China Textile 2020年6期
by Cotton Incorporated
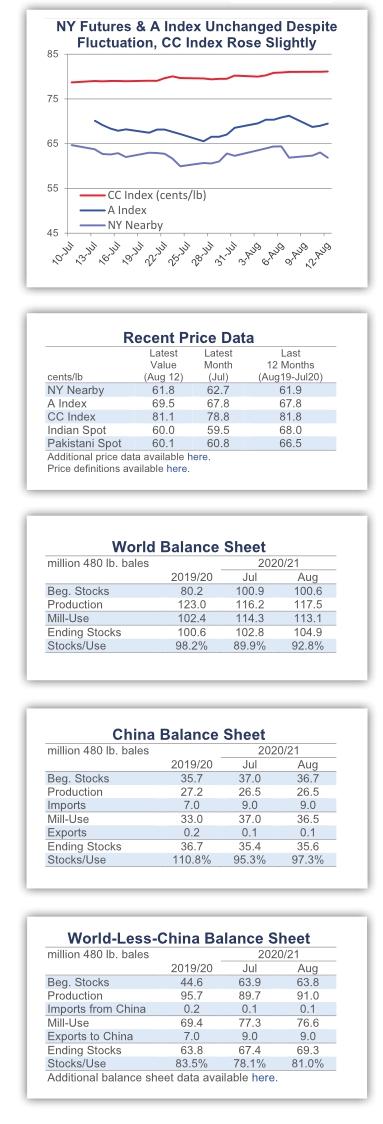
Recent price movement
Movement in benchmark prices was mixed over the past month.
The NY December futures contract moved lower (to below 60 cents/lb in late July) and then higher (near 65 cents/lb in early August) over the past month. Current values (63 cents/lb) are nearly even with those from one month ago.
Cotlooks A Index is also near values from one month ago (69 cents/lb).
The China Cotton Index (CC Index 3128B) rose slightly in international terms, from 79 to 81 cents/lb. In domestic terms, values increased from 12,100 to 12,400 RMB/ton. The RMB strengthened against the dollar over the past month, from 7.00 to 6.95 RMB/USD.
Indian cotton prices (Shankar-6 quality) were stable in international terms, holding near 60 cents/lb. In domestic terms, values were steady near 35,000 INR/ candy. The Indian rupee consistently traded near 75 INR/USD over the past month.
Pakistani prices decreased from 62 to 59 cents/lb. In domestic terms, prices eased from 8,500 to 8,250 PKR/maund. The Pakistani rupee weakened slightly against the dollar, from 166 to 168 PKR/ USD.
Supply, demand, & trade
The latest USDA report featured an increase to global production (+1.3 million bales to 117.5 million) and a decrease to global mill-use (-1.2 million bales to 113.1 million) forecasts for 2020/21. In combination, these revisions contributed to the 2.1 million bale addition to the projection for 2020/21 ending stocks (to 104.9 million).
At the country-level, the largest increases to production estimates were for India (+1.2 million bales, to 29.7 million), the U.S. (+580,000 bales, to 18.1 million), and Australia (+200,000 bales, to 1.9 million). The largest decreases were for Mali(-400,000 bales, to 1.0 million) and Greece(-175,000 bales, to 1.5 million).
For mill-use, the biggest country-level additions included those for Bangladesh(+300,000 bales, to 7.3 million) and Turkey(+100,000 bales, to 7.0 million). The biggest decreases were for China (-500,000 bales, to 36.5 million), India (-500,000 bales, to 22.5 million), Pakistan (-300,000 bales, to 10.0 million), Brazil (-100,000 bales, to 3.1 million), Indonesia (-100,000 bales, to 2.9 million), and the U.S. (-100,000 bales, to 2.7 million).
Global trade forecasts were lowered 267,000 bales, to 41.6 million. In terms of imports, the largest changes were for Bangladesh (+200,000 bales, to 7.3 million), Malaysia (+100,000 bales, to 850,000), Turkey (+100,000 bales, to 4.2 million), India (-100,000 bales, to 1.0 million), Indonesia (-150,000 bales to 2.9 million), and Pakistan (-400,000 bales, to 10.0 million). In terms of exports, the largest changes were for India (+400,000 bales, to 4.9 million), Malaysia (-100,000 bales, to 300,000), Greece (-125,000 bales, to 1.4 million), and Mali (-300,000 bales, to 1.0 million).
Price outlook
COVID-19 remains a central source of uncertainty for the global economy and the global cotton market. The resurgence of the outbreak in the U.S., along with the rise in daily case rates in several other countries, emphasizes how the world has yet to bring the pandemic under full control.
The general shutdowns, which were an initial tactic to slow the spread, appear to have been abandoned. This has allowed for some improvement in economic activity. Year-over-year contractions in consumer spending on apparel have gotten smaller in major import markets, but the latest figures remain lower than year-ago levels. U.S. consumer spending on clothing was -26%,-44%, -23%, and -2% year-over-year March-June. European Union retail trade for textiles, clothing, and footwear was -55%,-78%, -35%, and -26% year-over-year March-June. Japanese household clothing expenditures were -30%, -58%, -42%, and-7% year-over-year March-June.
These are significant declines in spending, and they have led to significant pullbacks in imports. Apparel import weight volume for the U.S. was -15%, -43%,-57%, and -34% year-over-year March-June. For the European Union, apparel import weight volume was -11%,-38%, and -50% year-over-year March-May. For Japan, apparel import weight volume was -39%, -2%, -1%, -29%, and -16% year-over-year February-June.
Despite the reduction in imports, the sudden pullback in consumer demand caused sharp increases in retailer inventory. In the example of the U.S., the inventory-to-sales ratio for clothing stores climbed to its highest level on record (in April, the ratio was more than seven times the average in 2019). Improvement in sales has helped to bring it lower, but it remains elevated relative to levels before the outbreak (the latest value, for May, was about 2.5 times the average in 2019).
Further upstream, in the manufacturing sector, figures for global inventories are not readily available. Nonetheless, it can be assumed that reductions in consumer demand and retailer orders led to a significant accumulation of fabric and yarn supply. At the fiber stage, this certainly has been the case. In 2019/20, the USDA estimates that the world will experience the second-largest increase in ending stocks on record (+20.3 million bales year-over-year, only behind the +22.8 million bale increase in 2011/12, the crop year that followed the price spike).
Cotton stocks are expected to increase by a much smaller volume in 2020/21 (+1.9 million bales). The crop year just began, however, and there is plenty of time for rapidly evolving COVID and macroeconomic conditions to alter the outlook. Even in an optimistic scenario, where the virus is put under control and economies rebound, demand growth at the spinning level may lag downstream demand growth due to accumulated inventory.
Meanwhile, there are other sources of uncertainty. Tensions between the U.S. and China, the worlds two largest economies and the worlds largest exporter and importer of cotton, continue to escalate. China was responsible for nearly 70% of U.S. export sales of cotton since April. Whether or not those sales turn into shipments, whether or not the Phase One agreement is fulfilled, and what the potential consequences of an unfulfilled deal could be are other variables that can be expected to shape the supply and demand outlook and price direction.
- China Textile的其它文章
- PEACEBIRD Fashion Headquarter—a new China fashion landmark
- 2020 Ningbo fashion festival kicked off on October 22nd
- 31st edition of Milano Unica:A bold signal of a comeback
- “Nothing New, Everything New”:Heimtextil presents the 2021/2022 trends
- Why is Bangladesh overtaken by Vietnam in global garment exports?
- The cotton import sliding-scale duty quotas have shrunk by half this year,and the changes worthy of attention are more than this!