SEPTEMBER 2020
2020-11-28 07:31:28byCottonIncorporated
China Textile 2020年6期
by Cotton Incorporated
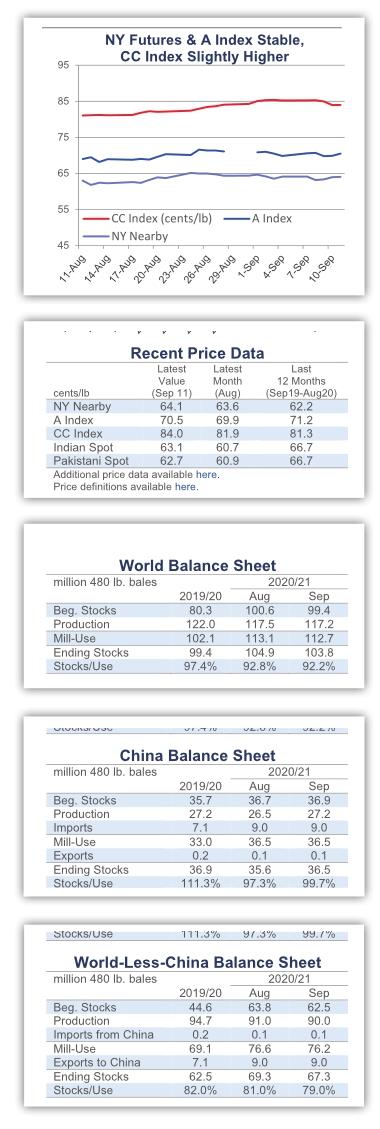
Recent price movement
The NY Nearby and the A Index were stable over the past month. Asian benchmarks increased.
The NY December futures contract held to levels near 64 cents/lb.
Cotlooks A Index was steady near 70 cents/lb.
The China Cotton Index (CC Index 3128B) increased in international terms, from 81 to 84 cents/lb. In domestic terms, values increased from 12,400 to 12,600 RMB/ton. The RMB strengthened against the dollar over the past month, from 6.95 to 6.84 RMB/USD.
Indian cotton prices (Shankar-6 quality) rose from 60 to 63 cents/lb in international terms. In domestic terms, values increased from 35,100 to 36,300 INR/ candy. The Indian rupee strengthened from 75 to 73 INR/USD over the past month.
In international terms, Pakistani prices increased from 59 to 63 cents/lb. In domestic terms, prices climbed from 8,300 to 8,700 PKR/maund. The Pakistani rupee strengthened slightly against the dollar, from 168 to 166 PKR/USD.
Supply, demand, & trade
The latest USDA report featured small decreases to global estimates for 2020/21 production (-326,000 bales to 117.2 million) and mill-use (-366,000 bales to 112.7 million).
There was a larger revision to global production in 2019/20 (-1.0 million bales to 122.0 million). This decrease was the result of a one million bale reduction to the figure for Indian harvest last crop year (from 30.5 to 29.5 million bales).
With 2019/20 global mill-use lowered only slightly (-269,000 bales to 102.1 million), an effect of the smaller 2019/20 crop number was to lower beginning stocks for 2020/21. Less warehoused cotton carried into the new crop year was the primary cause of the 1.1 million bale decrease to the projection for 2020/21 ending stocks (to 103.8 million bales). Despite the decline, the level of the current forecast calls for the second-highest volume of stocks on record(the largest volume was 106.7 million bales in 2014/15, when Chinese reserves set their peak).
At the country-level, the biggest changes to 2020/21 production figures included reductions for the U.S. (-1.0 million bales to 17.1 million), Pakistan (-300,000 bales to 6.2 million), Turkey (-200,000 bales to 2.8 million). These declines were nearly offset by additions to estimates for China (+750,000 bales to 27.3 million), India (+300,000 bales to 30.0 million), and Australia (+200,000 bales to 2.1 million).
For mill-use, the biggest changes were for the U.S. (-200,000 bales to 2.5 million), Brazil (-100,000 bales to 3.0 million), and Mexico (-100,000 bales to 1.6 million).
The global trade forecast increased 177,000 bales to 41.8 million. The larg- est changes to imports were for Vietnam(-200,000 bales to 6.8 million), Turkey(+100,000 bales to 4.3 million), and Pakistan (+300,000 bales to 3.8 million). For exports, the largest changes were for the U.S. (-400,000 bales to 14.6 million), Brazil (+200,000 bales to 9.2 million), India(+100,000 bales to 5.0 million), and Australia (+300,000 bales to 1.3 million).
Price outlook
After the U.S. announced actions against the Xinjiang Production and Construction Corps (XPCC) at the end of July, reports surfaced in early September that the U.S. may be planning to ban imports of textiles containing cotton from Xinjiang province. In 2020/21, Xinjiang is forecast to produce 90% of all Chinese cotton (Beijing Cotton Outlook), and there are questions of what a ban implemented by the worlds largest apparel importer on cotton from Chinas dominant growing region might mean for the global market.
Since reports suggesting a ban were released, there have been declines in Chinese cotton futures (ZCE). The most actively traded Chinese futures contract(January) fell from 12,900 to 12,600 RMB/ ton (-2.3%) between September 7th and September 11th. NY futures were stable over the same period; cash prices in China(CC Index), India, and Pakistan were flat to slightly lower.
There were relatively sharp declines in other financial markets simultaneous to the losses in Chinese cotton futures. Oil prices, technology stocks, and several major stock indices all retreated over the same period. The absence of a reaction in NY futures and the coincidence of declines in outside financial markets, make it difficult to delineate a clear effect of a possible ban on cotton prices in any market.
In the absence of confirmed details, the potential implications for cotton supply and demand remain unclear. It can be expected to result in further shuffling of supply chains, but an offsetting factor can be Chinese cotton imports. China recently announced the release of 400,000 tons (1.8 million bales) of “processing trade” quota. Textile goods assembled using cotton fiber imported with processing trade licenses are destined for eventual export. To the extent that imported fiber is traceable through the manufacturing process, those textile exports may be able to prove non-Xinjiang content and may be able to avoid constraints associated with a U.S. ban.
Relative to apparel supply chains, it should not be forgotten that the U.S. has maintained supplemental tariffs on Chinese-made apparel since September 2019. In the months since those tariffs were implemented, there has been a shift away from China. Since those moves have already been made, there is less exposure for U.S. retailers and brands than there was a year ago. In the eleven months of trade data available since tariffs were implemented (September-July), Chinas share of U.S. cotton-dominant apparel dropped from 28% to 22% year-over-year (in terms of square meter equivalence). Over the same period, ASEAN countries overtook China in terms of cotton-dominant apparel volume, and increased market share from 24% to 29%.
However, there are dependencies in supply chains that extend deeper than garment assembly and labeled country of origin. Countries outside of China may be using Chinese yarn or fabric. A U.S. ban on Xinjiang cotton may require traceability for fiber-based inputs passing through China.
Many questions remain, including whether or not a ban will actually be implmenteted. However, sourcing cost increases associated with traceability, cost increases associated with movement of supply chains, as well as general uncertainty can be expected to weigh on order volumes and to have some effect on cotton consumption.
- China Textile的其它文章
- PEACEBIRD Fashion Headquarter—a new China fashion landmark
- 2020 Ningbo fashion festival kicked off on October 22nd
- 31st edition of Milano Unica:A bold signal of a comeback
- “Nothing New, Everything New”:Heimtextil presents the 2021/2022 trends
- Why is Bangladesh overtaken by Vietnam in global garment exports?
- The cotton import sliding-scale duty quotas have shrunk by half this year,and the changes worthy of attention are more than this!