Influence of uniform momentum zones on frictional drag within the turbulent boundary layer?
2021-03-19 03:21:58KangjunWang王康俊andNanJiang姜楠
Chinese Physics B 2021年3期
Kangjun Wang(王康俊) and Nan Jiang(姜楠),2,?
1Department of Mechanics,School of Mechanical Engineering,Tianjin University,Tianjin 300350,China
2Tianjin Key Laboratory of Modern Engineering Mechanics,Tianjin 300072,China
Keywords: turbulent boundary layers,uniform momentum zones,skin-friction drag
1. Introduction
Coherent structures in turbulent boundary layers (TBLs)have been the focus of research for five decades. In recent years,the discovery of uniform momentum zones(UMZs)further enhances the community’s understanding of the coherent structures within the TBL. UMZ is a large and irregular flow region, in which the fluid has relatively uniform streamwise momentum. The streamwise length of UMZs is approximately 3δ (δ denotes the thickness of the boundary layer),so the UMZs were thought of as a type of large-scale motions (LSMs).[1]In the velocity field obtained from particle image velocimetry(PIV),UMZs can lead the probability density function(PDF)of the streamwise velocity to appear local peaks. Adrian et al.[2]defined these local peaks as the modal velocities to characterize approximately identical streamwise velocity of UMZs.
In channel flow, Kwon et al.[3]found that the interior of UMZs contains low-level turbulence, while the thin layers demarcating the UMZs have relatively intense vorticity.Eisma et al.[4]investigated the internal shear layers in TBL.Their results show that the internal shear layers around UMZs share similar characteristics with the turbulent non-turbulent interface (TNTI), and the growth rate of the LSMs is connected to the entrainment velocity of these internal shear layers. Based on the experimental dataset of four different Reτ(Reτis the friction-velocity-based Reynolds number),de Silva et al.[5]detected the number of UMZs within the TBL. They found that the mean number of detected UMZs presents a log-liner law with Reτ, and the wall-normal thickness of the UMZs furthest away from the wall accounts for the variation of the instantaneous boundary layer height. They further revealed the evidence that the hairpin packets related to the generation of UMZs have hierarchical length-scale distributions within TBL.This discovery coincides with the attachededdy hypothesis.[6-9]An extension work of Laskari et al.[10]showed that the velocity fields with a low number of UMZ are usually linked with a large-scale sweep motion,and in the near-wall region, the small-scale turbulence activity is more intense compared with the fields with high UMZ numbers.This phenomenon is similar to the modulation effect of LSMs to small-scale motion.[11]
Traditionally, the skin-friction drag is thought to be associated with the turbulence activity in the near-wall region,hence the coherent structure in the near-wall region is always the focus of research on skin-friction drag reduction.[12-16]In recent years, the LSMs in the outer regions are also found to have an impact on the generation of skin-friction drag.Hutchins et al.[17]observed that a large-scale low skin-friction event within the TBL is associated with the low-speed regions of LSMs.Hwang and Sung[18]found that the high-speed LSMs can amplify the vortical motions in the near-wall region,and then the amplified vortical motions induce the increase of skin friction. The research of skin-friction drag reduction via flow control in wall-bounded turbulence illustrated that the action of hairpin vortices in the near-wall region is the primary cause of higher skin-friction drag within the TBL compared to the laminar boundary layer.[19-23]As the UMZs belong to the LSMs,the UMZs are also expected to influence the wall shear stress within the TBL.
As to the measurement of skin-friction drag,the measurement method mainly includes the direct and indirect method.The direct methods such as floating element balance, oil-film interferometry,and liquid crystal coatings are inconvenient to use. In addition, these methods are unable to perform measurements under the water. The indirect methods such as Clauser fit and Musker fit need the mean streamwise velocity profile to accord with the standard profile. Compared with the aforementioned methods, the single-pixel ensemble correlation (SPEC) is a newly developed method to acquire the skin-friction drag. The method of SPEC acquires the singlepixel resolution by extending the cross-correlation map of the interrogation window in time dimension. In short, the SPEC method uses temporal resolution to exchange for spatial resolution.[24,25]Own to the high spatial resolution,the SPEC can measure the mean velocity profile in the viscous sublayer,and get a reliable value of skin-friction drag by estimating the slope of the mean streamwise velocity profile in the viscous sublayer.[26,27]The more details of SPEC can be referred to Westerweel et al.[24]and K¨ahler et al.[25]
The objective of the present study is to explore the influence of UMZs on the skin-friction drag and to examine the statistic characteristics of UMZs within the TBL.The experimental dataset analyzed in this work was obtained from time-resolved particle image velocimetry(TRPIV).The velocity fields were acquired in the streamwise-wall-normal plane.The method of SPEC was used to measure the skin-friction drag. In Section 2,the experimental facility and measurement method are introduced.In Section 3,the relationships between UMZs and skin-friction drag, and statistic characteristics of UMZs are analyzed. In Section 4,the concluding remarks are given.
2. Experimental setup
The present experiments in TBL were carried out in a low-speed recirculating water channel located at Tianjin University. The test section of the water channel is 6.2 m ×0.29 m ×0.38 m (length × width × height). The turbulent boundary layers were developed on the bottom wall of the test section. A tripwire with a diameter of 2 mm was placed 200 mm downstream of the test section inlet to stimulate the turbulent development. The velocity fields were acquired in the streamwise-wall-normal plane via a 2D TRPIV.The measurements were carried out at the place 2.7 m downstream of the trip. The free-stream turbulence intensity is 1.5%at a typical free-stream velocity U∞=0.35 m/s. In present work, x,y,z denotes the streamwise,wall-normal,and spanwise directions, respectively; the corresponding instantaneous velocity and fluctuation velocity components are given by U,V,W and u,v,w;in addition, ˉU, ˉV, ˉW were defined as the mean velocity in the respective direction.
The flow was seeded by polyamide particle with an average diameter of 20 μm and a density of 1.03 g/mm3. The flow field was illuminated by Litron LDY 304 laser. The thickness of the laser sheet is approximately 2 mm. A Speed Sense 9072 12-bit charge-coupled device(CCD)camera with a 60 mm Nikkor lens was used to record images at a resolution of 800 pixels×800 pixels. The particle images were acquired with free-stream velocity U∞=0.359 m/s,corresponding to Reτ=612. Under the aforementioned flow condition,the dataset including 35214 images was acquired with sampling rates fs=750 Hz. The field of view(FOV)was approximately 1.45δ in x and y directions (57 mm × 57 mm). DynamicStudio software from Dantec was used to transform the particle images to the velocity fields. An adaptive correlation approach was used with interrogation windows of 32 pixels×32 pixels and an overlap factor of 75%. The spacial distance per vectors was 0.59 mm or 9.23 inner unit. The relative error of the velocity measurements was estimated to be about 1%.

Table 1. Flow parameters of boundary layers.
The CCD camera for SPEC was the same as TRPIV.The fitted lens was a Nikkor lens with a focal length of 200 mm.The corresponding spatial resolution is 0.0207 mm/pixel,which is enough to capture the seeds in the viscous sublayer.As the thickness of the viscous sublayer was very thin, the FOV of the SPEC camera was set as 200 pixels × 50 pixels(4.14 mm×1.04 mm in the x-direction and y-direction). The cameras for SPEC and TRPIV were synchronized by synchronizer when recording the particle images. The relative error of the skin-friction drag acquired by the SPEC method is related to the number of the ensemble size of image samples. When the ensemble size is above 1000,the relative error is about 1%,while the ensemble size of image samples exceeds 2000, the relative error will be below 0.1%.[27]
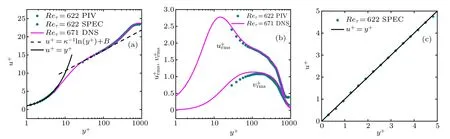
Fig.1. Profile of(a)mean streamwise velocity and(b)the streamwise and wall-normal turbulent fluctuation intensity. Scatter points represent the experimental result,the magenta line shows the DNS result. The black dashed line and solid line denote the logarithmic region and viscous sublayer. (c)The mean streamwise velocity in the viscous sublayer.
The flow parameters of the boundary layer are listed in Table 1. The log-law constants of mean velocity profile κ =0.41 and B=5.0. The friction velocity uτ=15.02 mm/s was measured by the SPEC method, and the corresponding goodness of fitting profile slope is greater than 0.9996. Using the Clauser chart method,[28]uτwas 15.03 mm/s. The uτcalculated by two different methods almost identical, in the following,we choose uτ=15.02 mm/s as the standard value.The boundary layer thickness δ is assessed based on 99% of U∞. The profiles of mean streamwise velocity and Reynolds normal stress are shown in Figs. 1(a) and 1(b). For comparison,the DNS data of zero-pressure gradient turbulent boundary layer at similar Reτby Schlatter and Orlu[29]are posted in the plots in Figs.1(a)and 1(b),in which the superscript+denotes the nondimensionalization based on inner units. Figure 1(c) exhibits the mean streamwise velocity profile in the viscous sublayer measured by SPEC.
3. Result and discussion
3.1. Influence of uniform momentum zones on frictional drag
In the present study, the methodology proposed by Laskari[10]is used to detect UMZs in the instantaneous velocity fields. This method mainly includes two stages: (1)removing the non-turbulent part of instantaneous velocity fields to exclude the influence of free stream; (2) constructing the PDF based on the turbulent part of instantaneous streamwise velocity. The location of the turbulent/non-turbulent interface(TNTI)in TBL is determined by the method of kinetic energy deficit.[30]In a PIV frame,the local kinetic deficit K is defined as


Fig.2. (a)The iso-contour of U under the TNTI in a randomly selected PIV frame. The TNTI is denoted by the blue dashed line. (b)The PDF corresponding to (a). The location of the peaks denoted by triangles represents the modal velocity Um of UMZs.


Fig.3. (a)The PDF of NUMZ.(b)The PDF of instantaneous streamwise velocity in groups C1 to C5,and G.
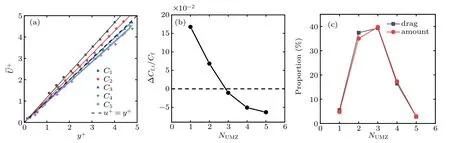
Fig.4. (a)The mean streamwise velocity profile in each group acquired by SPEC in the viscous sublayer. (b)The difference of skin-friction coefficient between each group and the ensemble. (c)The drag and amount proportion of different groups in the ensemble.
3.2. Statistical characteristics of uniform momentum zones
The spacial location is an important property of UMZs.In the previous literature of de Silva et al.[5]and Laskari et al.[10]the location of UMZs was defined as the midline of the upper and lower boundary. This definition only reflects the wall-normal distance of UMZs from the wall,so in this paper,the location of UMZs is defined as the centroid of the regions with U ∈[Um?0.25uτ,Um+0.25uτ](the 0.5uτcorresponding to the bin width of PDF construction). The new definition coincides with the criterion that the UMZs are mainly characterized by Um,and the new definition can reflect the streamwise and wall-normal position information of UMZs in FOV,rather than wall-normal position only. Based on the new definition of location, the UMZs in every single PIV frame are ranked.The symbol Rjpresents the jth UMZ form the wall. Because the NUMZof PIV frames in group Ciis i,so for a certain group,j belongs to[1, j].

Fig.5. (a) Mean location of UMZs and (b) modal velocity of UMZs varying with rank Rj and group Ci.
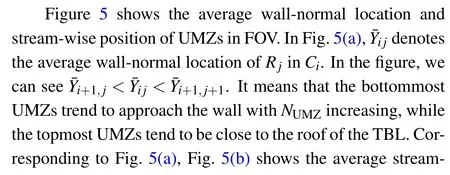


Fig.6. (a)Mean modal velocity ˉUm,ij. (b)The difference between the mean modal velocity ˉUm,ij and the mean streamwise velocity of global fields at the corresponding wall-normal position ˉU|ˉYij.


Fig.8. (a)Conditionally averaged large-scale Reynolds shear stress ?〈uLivLi〉and globally averaged large-scale Reynolds shear stress ?〈uLvL〉. (b)The difference between the ?〈uLivLi〉 and ?〈uLvL〉, ?Δ〈uLivLi〉=〈uLvL〉?〈uLivLi〉. (c) Conditionally averaged small-scale Reynolds shear stress?〈uSivSi〉 and globally averaged small-scale Reynolds shear stress ?〈uSvS〉. (d) The difference between the ?〈uSivSi〉 and ?〈uSvS〉, ?Δ〈uSivSi〉=〈uSvS〉?〈uSivSi〉.
4. Conclusion
A dataset of velocity fields is acquired in the streamwisewall-normal plane within the TBL, by a 2D TRPIV. The method of SPEC is used to measure the skin-friction drag of TBL. The influence of UMZs on the skin-friction drag and statistical characteristics of UMZs is investigated. The results show that the skin-friction drag is linked with the number of UMZs in velocity fields. When the number of UMZs is larger than the mean value, the velocity fields have a relatively low skin-friction drag. When the number of UMZs is less than the mean value,the velocity fields have a relatively high skinfriction drag. By defining the centroid of the regions with U ∈[Um?0.25uτ,Um+0.25uτ]as the location of UMZs,the information on the spatial distribution of the UMZs is exhibited.In spatial distribution, the UMZs with lower wall-normal locations tend to be more downstream compared with the upper UMZs. The UMZs under the 0.51δ are the low momentum zones, the UMZs above the 0.51δ are the high momentum zones. At 0.51δ, the speed of UMZs is close to the global mean. The conditionally averaged fluctuation velocity shows that,below the 0.51δ,the velocity fields with the low number of UMZs present a Q4 event, and with NUMZincreasing, the Q4 event is gradually transformed into a Q2 event. The velocity fields with a low number of UMZs intensify the small-scale Reynolds shear stress in the near-wall region to enhance the skin-friction drag by modulation effect. Increasing the proportion of velocity fields with high UMZs amount may be a direction to reduce the skin-friction drag within the TBL.

- Chinese Physics B的其它文章
- Nonlocal advantage of quantum coherence in a dephasing channel with memory?
- New DDSCR structure with high holding voltage for robust ESD applications?
- Nonlinear photoncurrent in transition metal dichalcogenide with warping term under illuminating of light?
- Modeling and analysis of car-following behavior considering backward-looking effect?
- DFT study of solvation of Li+/Na+in fluoroethylene carbonate/vinylene carbonate/ethylene sulfite solvents for lithium/sodium-based battery?
- Multi-layer structures including zigzag sculptured thin films for corrosion protection of AISI 304 stainless steel?