Multivariate optimization of high removal of lead(II)using an efficient synthesized Ni-based metal–organic framework adsorbent
2021-04-13 06:21:02SaeidehDermanakiFarahaniJavadZolgharnein
Saeideh Dermanaki Farahani,Javad Zolgharnein
Chemistry Department,Sciences Faculty,Arak University,Arak,Iran
Keywords:Adsorption Heavy metals Kinetics Lead(II)Metal–organic framework Optimization
ABSTRACT A new metal–organic framework(MOF)with the chemical formula of[Ni2 F2 (4,4′-Bipy)2 (H2O)2 ](VO3 )2 ·8H2O was introduced to adsorb Pb(II)with the highest capacity.The sorbent was characterized by thermogravimetric analysis(TGA),infrared spectroscopy(FT-IR),field-emission scanning electron microscopy(FESEM),energy-dispersive Xray(EDX),and elemental analysis.The optimum conditions were obtained by a face-centered central composite design(FCCD)as follows:adsorbent dosage(m)=1.2 mg,initial concentration of Pb(II)(C)=390 mg·L?1,and pH=5.According to the Langmuir model(R2=0.9999),the maximum monolayer uptake capacity of lead(II)is 2400.7 mg·g?1,which is the highest observed amount for lead(II)adsorption.Neither of the old adsorbents for lead(II)has the uptake capacity over 2000 mg·g?1.The model of pseudo-second-order describes well the process kinetics.The adsorption process of lead(II)is independent of temperature changes.This compound can adsorb lead(II)from tap water.In addition to introducing a new MOF with the highest uptake capacity for removal of Pb(II)that is the outright novelty of this study,the concurrent modeling of both the removal percent(R)and the uptake capacity(q)is another important advantage.Because it achieves the more economical and favorable optimum conditions in comparison with the single optimization of each response.
1.Introduction
The heavy metals include the harmful ions like cadmium(II),nickel(II),mercury(II),copper(II),arsenic(V),chromium(III),manganese(II),zinc(II),and lead(II)[1–6].Since large amount of these ions are released to the natural water sources by industries and mining activities annually,the clean and fresh water sources are decreasing[2,7].Lead is a toxic and carcinogenic heavy metal,which gets released to the environment via mining and industries activities such as batteries,steel,and explosive products.Since lead can cause severe damages to the health of humans and other livings,its removal from water is a critical environmental challenge [5,8,9].Among the decontamination methods of Pb(II),the adsorption method is a simple and low cost way which needs an economical and suitable adsorbent[2,10–13].According to the studies performed,some compounds can adsorb lead,such as MOF-800 [7],sodium carboxymethyl cellulose–based adsorbent (CMC-PAMA) [14],COF-TE[15],MOF-2(Cd)[16],mesoporous conjugated adsorbent(MpCA)[17],UiO-66-RSA [18],water-soluble Fe3O4nanoparticles [19],BAC@SiO2-EDTA[20],and Ni-Fe-CO3LDH-NGO[21].However,neither of them has the uptake capacity over 2000 mg·g?1.
MOFs,abbreviated of metal–organic frameworks,are a new group of crystalline porous compounds composed of metal ions and bridging organic ligands,which are excellent adsorbents to remove heavy metal ions,including lead[22–26].The sonochemical method,a fast and facial technique,employs ultrasonic waves for the synthesis of MOFs,which have a smaller size in comparison with the solvo/hydrothermal methods[27–30].MOFs are usually utilized for the adsorption-based separation and determination applications due to their valuable properties,such as diverse structures,tunable topologies,and porosity in the nanoscale [24,31].For the first time,synthesis of [Ni2F2(4,4′-Bipy)2(H2O)2](VO3)2·8H2O as a new MOF was reported [32].According to the proposed structure (Fig.1),each fluoride connects between two Ni ions.The coordinative positions of the Jahn–Teller active nickel(II)ions are occupied by two bridging fluorides and four 4,4′-Bipy ligands.Two anionicbalance the charge of the Ni2+ions.Furthermore,there are two coordinated H2O.So far,this MOF only was employed for the Congo red dye adsorption with a high capacity of 242.1 mg·g?1[32].In this study,it was used as an excellent adsorbent for the removal of lead(II)that is the outright novelty of this study.
Multivariate optimization is a statistical and economical approach for attaining optimum conditions for removal of lead[33].It finds the relationship between response and effective factors with consideration of the interactions among the variables[33–36].Therefore,the removal conditions were optimized using a face-centered central composite design(FCCD).Equilibrium and kinetic behavior of introduced sorbent with lead(II)were also taken into consideration in details.
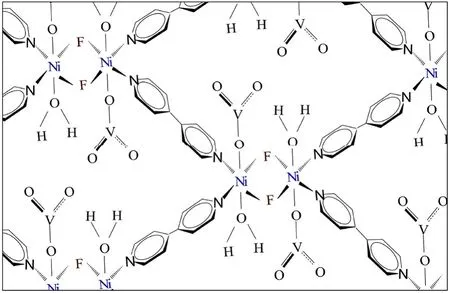
Fig.1.Propounded chemical structure for[Ni2 F2 (4,4′-Bipy)2 (H2O)2 ](VO3 )2 ·8H2O[32].
2.Materials and Methods
2.1.Materials
Merck company's nickel(II)acetate tetrahydratesodium fluoride (NaF),ammonium monovanadate (NH4VO3),4,4′-bipyridine(C10H8N2),sodium hydroxide(NaOH),nitric acid(HNO3),and lead(II)nitrate(Pb(NO3)2)were used without further purification(Merck group;Darmstadt,Germany).Double distilled water is employed as the solvent for the preparation of all solutions.Costech instrument ECS 4010 elemental analyzer,Alpha Bruker spectrometer,MIRA3 XM microscope,and Perkin Elmer instrument technology SII are employed for elemental analysis,FT-IR,FESEM and EDX,and TGA,respectively.
2.2.Synthesis and characterization
The MOF of[Ni2F2(4,4′-Bipy)2(H2O)2](VO3)2·8H2O was synthesized according to the previous experience(yield of 60%)[32].26 ml of the 4,4′-bipyridine (1 mmol) and NaF (1 mmol) aqueous solution was slowly added to 52.5 ml of the nickel(II) acetate (1 mmol) and NH4VO3(1 mmol)aqueous solution with adding speed of a drop per second in the ultrasonic bath (Metason HT200;frequency=50 Hz and output power=140 W).The pale green precipitate was produced,which was dried in ambient temperature after the washing with double distilled water.The synthesis procedure was repeated over 30 times,and the resulting precipitates were mixed for the adsorption applications.The FT-IR spectra were obtained using the KBr pellets.To calculate the free H2O molecules of the sample before TGA,a little MOF was heated in an oven at about 95°C for 1 h.The TGA was done from 30 to 900°C at a 15°C·min?1heating speed of under an atmosphere of N2.
2.3.Removal of lead
In a generic experiment(Fig.2),m(g)of the adsorbent was mixed with a V(L)volume of lead(II)solution,possessed of C(mg·L?1)concentration and a specific pH by a reciprocating shaker(OS 2 basic-Yellow line) at 300 min?1for 20 min.After separation of the adsorbent by a centrifuge,the Pb(II) concentration (Ce) was measured by flame atomic absorption spectrophotometer (PG990 Instruments) in the separated solution.The percent of removal(R)and Pb(II)equilibrium uptake capacity(q or qe(mg·g?1))were calculated using the equations of R=100×[(C ?Ce)/C]and q=(C ?Ce)V/m.The uptake capacity at a specific time(qt)are calculated using the second equation.
2.4.Optimization using FCCD
The preliminary experiments(Fig.S1)detected that sorbent dosage(m),initial concentration of Pb(II)(C),and pH are three effective factors to remove lead.The FCCD was performed using Minitab 17.0 and Design Expert 7 software.The FCCD is a type of central composite design(CCD),which its star points stay at center of the cubic faces(α=±1).This design considers low(?1),middle(0),and high(+1)levels for each factor[34].In this study,the number of experiment(N)needed to perform FCCD is 16.It is calculated from N=2k+2 k+Cpequation,where Cpand k are the replicate number at the center point and the efficient factors number,respectively[34].The k and Cpvalues are equal to three and two,respectively.
2.5.Adsorption process studies
Both isotherm and kinetics of the Pb(II)adsorption process were studied under the optimal conditions.The determination coefficient(R2),the nonlinear chi-square(χ2),and the normalized standard deviation (Δq) data showed the most compatible models (kinetics and isotherm)with experimental data[37–41]:
Their equation follows as:

where n,qe.meas,qe.calare the data number,the measured and calculated qe,respectively.Both χ2and Δq values close to zero and the R2value close to 1.0 are indicators to detect the more agreeable model.
3.Results and Discussion
In the current study,the novel[Ni2F2(4,4′-Bipy)2(H2O)2](VO3)2·8H2O metal–organic framework was synthesized via an organic solvent-free method.It was employed for Pb(II)adsorption.
3.1.Characterization analyses
As demonstrated in Fig.3,the following results confirm the adsorbent structure in a good agreement with reported results elsewhere[32].
The illustration of FESEM(Fig.3(a))shows the morphology of the adsorbent particles.The data of elemental analysis,N:6.60,C:29.14,and H:4.68%,are close to their theoretical amounts (N:6.62,C:28.40,and H:4.29%).The EDX analysis also confirms the elements of Ni,F,V,N,C,and O in the adsorbent structure (Fig.3(b)).As shown TGA curve (Fig.3(c)),three steps of weight loss were observed:First,5.11%within 201°C(loss of coordinated H2O molecules),second,16.62%within 201–439°C(elimination of C6H4and 2F?),and third,32.84% within 439–990 °C (removal of C14H12N4).The TGA data is consistent with the reported MOF [32].The FT-IR spectra of adsorbent and Pb(II)-loaded adsorbent are illustrated in Fig.4.The peaks assignment of the adsorbent FT-IR spectrum(Fig.4(a))are listed in Table 1[32,42–44].

Fig.2.Procedure of Pb(II)adsorption process.

Fig.3.FE-SEM image(a),EDX spectrum(b),and TGA plot of the as-prepared adsorbent(c).
The FT-IR spectrum of the adsorbent loaded with Pb(II)was used to determine the nature of interaction between functional groups of the adsorbent and Pb(II).In Fig.4(b),the peak of 581 cm?1is related to Pb-O stretching vibrations.Furthermore,the intensity of Ni-O peak has decreased.Therefore,it can result in an interaction between the electron pairs of oxygens of the ligand with unoccupied orbitals of Pb(II)ions.

Fig.4.The FT-IR spectra of the pristine adsorbent(a)and loaded Pb(II)onto adsorbent(b).

Table 1 Assignment of peaks in the adsorbent FT-IR spectrum①
3.2.Optimization of the removal conditions
According to previous performed experiences(Fig.S1),adsorbent dosage(m/0.5–2.5 mg or 0.0005–0.0025 g),initial concentration of Pb(II) (C/200–800 mg·L?1),and pH/3–5 were selected as factors that affect the R and q of Pb(II).Fig.S1(a)shows that lead adsorption process is independent of temperature changes.The pH and m factors have positive effect on R,while the C factor negatively affects R[40].These effects play inverse role for q.The Pb(II)ions precipitate when pH increases above 6[26].As shown in Fig.S1(c),both R and q values increase when the solution pH raises.This is due to the increase of negatively charged sites on the MOF surface,which leads to enhancement of Pb(II)adsorption caused by electrostatic attraction[45].
According to the FCCD design (Table 2),16 experiments were performed in a random order.Either R or q was fitted to a model with an appropriate regression analysis.
These models were obtained by optimal Box-Cox approach via natural log-transformation[39,40].According to Table 3,the m,C,and pH factorsand the m×m,m×C,and C×C(just for q)interactions significantly affected on the R (%) and q values because of the P-value falls lower than 0.05.After refusing insignificant interaction terms from each suggested models,the resulting models are given as following based on uncoded factors:

Table 2 The face-centered central composite design(FCCD)for R and q

Since the lacks of fit of both models are not significant(0.188 for ln R model and 0.179 for ln q model),the Analysis of Variance(ANOVA) confirms the validity of both models (Table 3).For each model,the coefficients of determination (R2) are close to 1 and also the normal distribution of residuals confirms the adequacy of the models[33,39,46].To be sure from the validation of the models,the actual and predicted responses were compared [35,36].It shows r=0.99 correlations coefficient between both values(Table S1).Furthermore,the t-test of pair data confirms the prediction ability of the models.Because the difference between experimental and model values of both responses is not statistically significant(critical t-value>calculated t-value).This test was performed by the Data Analysis section of Excel software.Therefore,both models can satisfactorily predict the R and q.Hence,the required adsorbent amount can be determined for a certain concentration of lead to reach the desired result.
The response surface graphs were displayed in Fig.5 for both responses of R and q versus m,C,and pH factors.They are obtained from varying two factors,while the third factor is kept constant at middle level[39,40,47].These plots clearly show the interaction between effective factors.
Simultaneous optimization of both adsorption responses(R and q)is an advantageous strategy from economical and environmental viewpoint[39,40].This can be done by using Derringer's desirability function (D).According to this,the geometric mean of the individual desirability value(di)which corresponds to each response should reach to 1.0000 and as a result the overall desirability (D) raises up to 1.0.This criterion is to optimize concurrent of R and q[35,36,48].Therefore,the optimum conditions obtained from simultaneous optimization ofboth adsorption responses(R and q)are m=1.2 mg,C=390 mg·L?1,and pH=5.
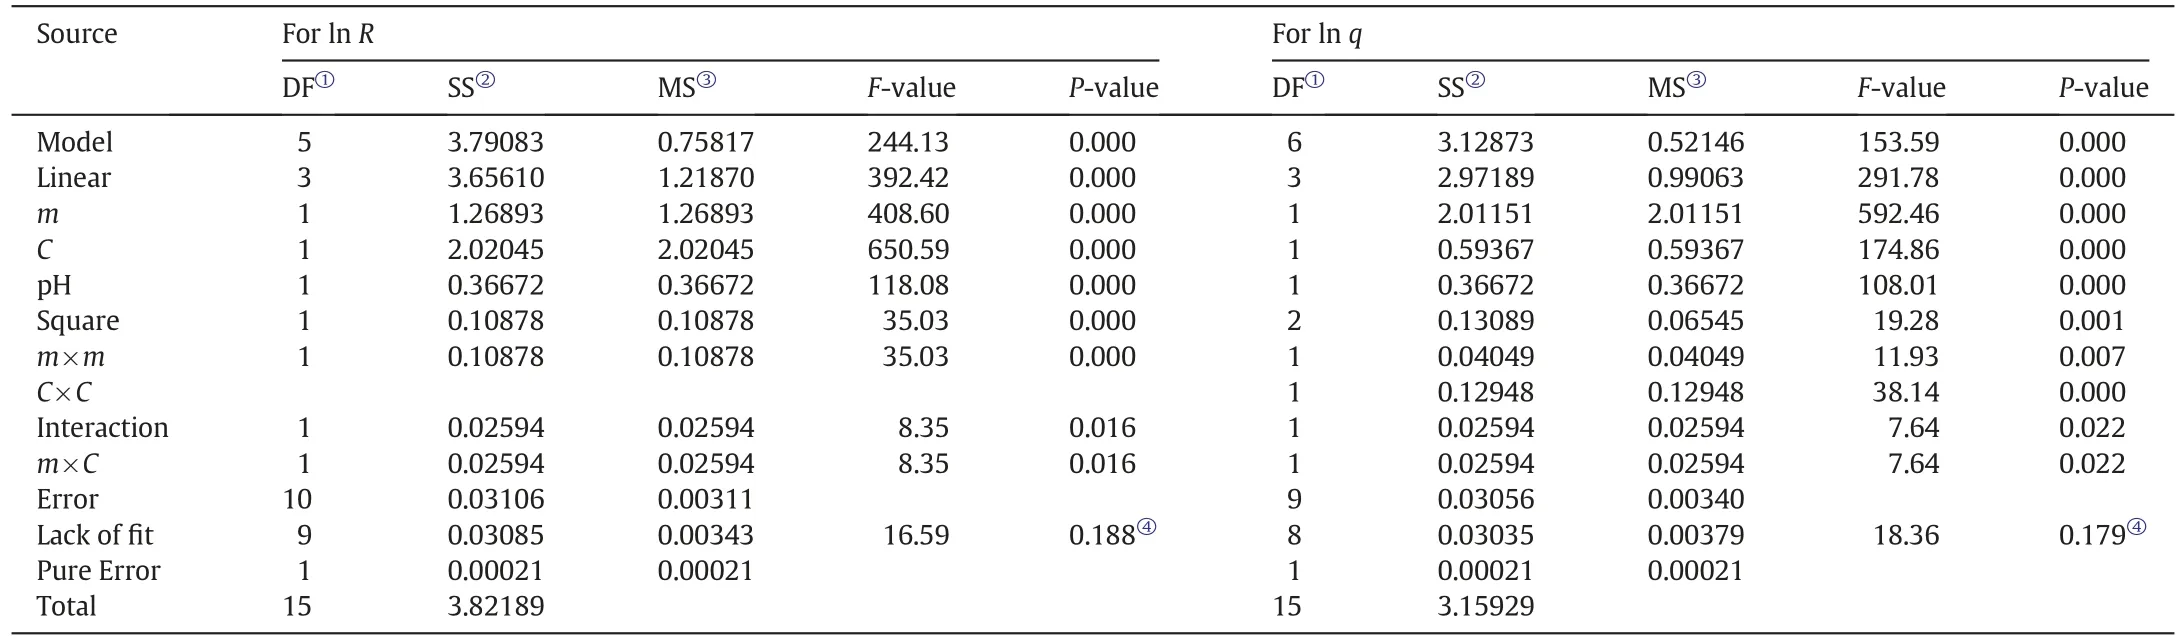
Table 3 ANOVA test for checking the adequacy of the models
3.3.Adsorption process study:kinetics and isotherm
According to Table 4,three adsorption kinetic models were studied for the rate-controlling step determination.kid,k1,and k2as the rate constants of the models were calculated from the slope of their relevant linear plots(Fig.S2(a–b))[38,49].In between first and second-order pseudo models,the experimental data obey the model that has the R2value close to one and qeclose to the experimental qe.The data of Table 4 demonstrate the adequacy of the pseudo-second order model to describe the experimental data.The chemisorption is probably the rate-controlling step if experimental data fit well with pseudosecond-order model[45,50].Therefore,the removal process of lead(II)is more likely to be chemisorption.The kinetic of adsorption process is composed of three following steps:
1.External diffusion:The lead ions diffusion takes place across the liquid film surrounding the MOF particles.
2.Diffusion of intra-particle or internal diffusion(the first section of the plot of qtagainst t1/2in Fig.S2(b)):Diffusion in the active sites or pores of the MOF.
3.The second section of the plot of qtagainst t1/2in Fig.S2(b):The MOF adsorbs Pb(II)by its active sites.

Fig.5.Response surface plots showing effective factors and their mutual effects on removal percent(R)and uptake capacity(q)of Pb(II)removal while the other variables are kept constant at middle level;(a,d)the effect of adsorbent amount(m)and initial concentration of Pb(II)(C);(b,e)the effect of pH and amount of adsorbent(m);the effect of pH and initial concentration of Pb(II)(C)(c,f).

Table 4 The equations and parameters of kinetic models of pseudo-first-order,pseudo-second-order,and intra-particle diffusion

Table 5 Parameters of models of Langmuir,Freundlich,and Dubinin-Raduskovich isotherms
According to the above observation,internal diffusion is not only rate-controlling step because neither of linear segments of the plot passes through the origin(Fig.S2(b))[39,51,52].
Three adsorption isotherms were investigated to determinate the adsorption equilibrium characteristics (Table 5).The linear and non-linear values of parameters were reported in Table 5[37,38,53].KL,KF,and β are the isotherms constant,qmaxand qsare the maximum uptake capacity(mg·g?1),and n and ? are the data number and Polanyi adsorption potential(J·mol?1),respectively[37,38].These parameters were calculated by their relevant linear plots(Fig.S3)and the Solver of Excel software [47],where qmaxand KLare found from the linear plot between Ce/qeand Ce(Fig.S3(a));n and KFfrom the linear plot between lnqeand lnCe(Fig.S3(b));and β and qsfrom the linear plot between lnqeand ?2(Fig.S3(b)).The non-linear plots of these isotherms are also shown in Fig.S3(a).
Freundlich isotherm represents a multilayer,reversible,and nondesired adsorption,while Langmuir isotherm is formulated for single layer chemisorption of lead(II)on equal positions of the MOF[37,54].Dubinin-Radushkevich(DR)isotherm is a useful model to recognize the type of adsorption mechanism [33,37].The average adsorption free energy (E/kJ·mol?1) less than eight calculated from the E=1/is representative of the physisorption.The free energy is found to be E=11.898 kJ·mol?1,therefore the mechanism is more likely to be chemisorption[33].
Consideration of R2,χ2,and Δq values(Fig.S3(a))illustrates that the Langmuir isotherm is more in agreement with the empirical data(Table 5).According to all obtained results from adsorption isotherms studies,the Pb(II)adsorption is a monolayer,favorable,and reversible chemisorption process with a qmaxof 2400.7 mg·g?1.
The uptake capacity(qmax)values of the reported adsorbents for Pb(II)are listed in Table 6.It shows that this compound has a very higher qmaxthan the others reported elsewhere[7,14–21,55–66]and the utilization of synthesized MOF for lead(II)removal is promising and economical.
3.4.Real sample
To investigate efficiency of adsorbent at real sample,a Pb(II)solution of 390 mg·L?1concentration at pH=5 was prepared by tap water.The solution was contacted by 1.2 mg of the adsorbent.The R for the lead(II)solution by tap water was obtained around 55%.It shows that this adsorbent has the good potential to remove lead from tap water as well.
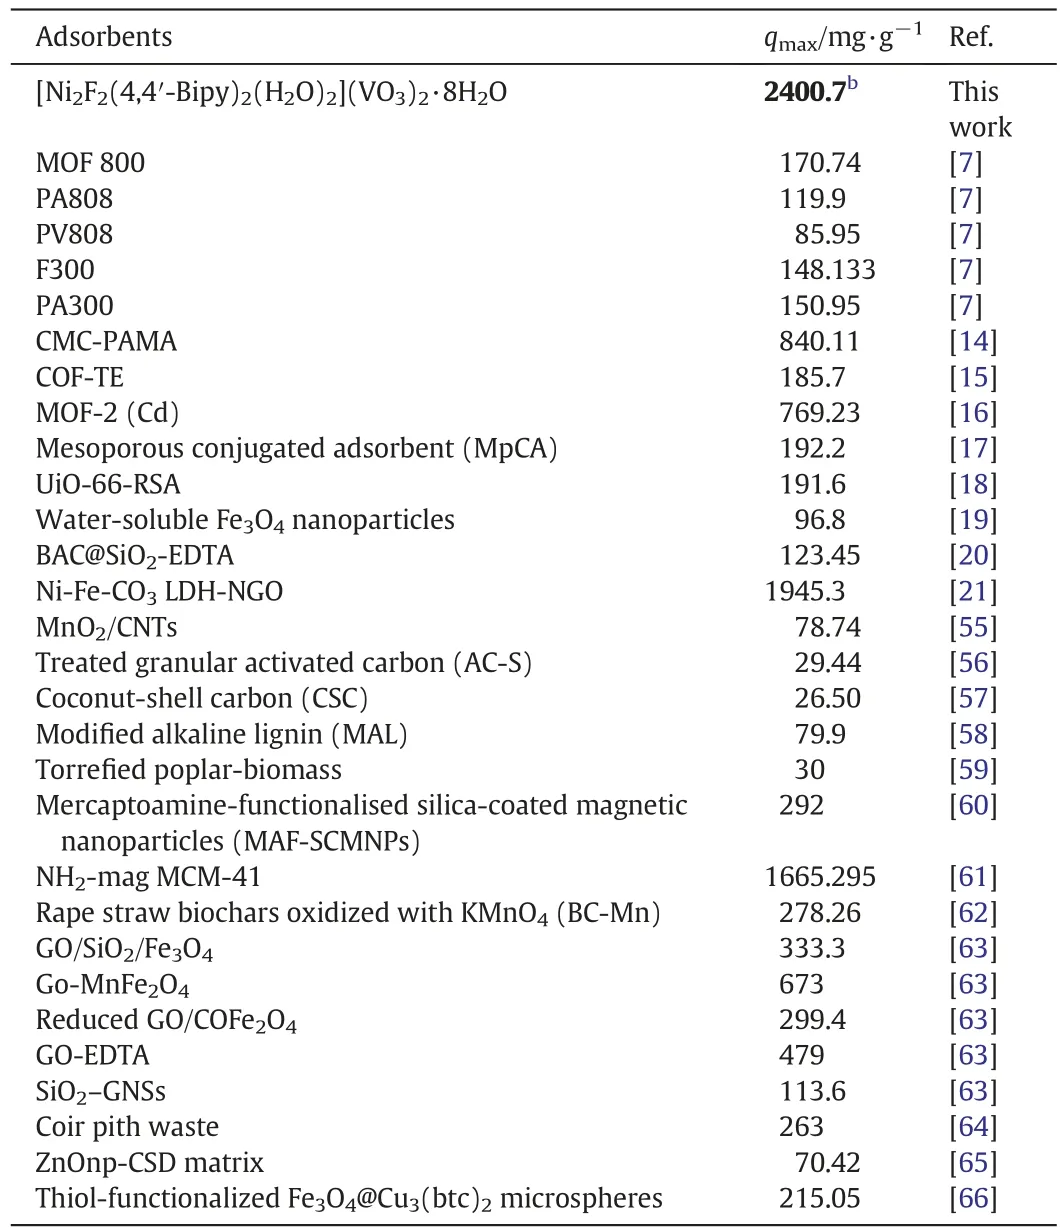
Table 6 Comparison of the maximum monolayer uptake capacity of lead (II) onto various adsorbents
4.Conclusions
The results showed that the new MOF of[Ni2F2(4,4′-Bipy)2(H2O)2](VO3)2·8H2O acts as a very suitable adsorbent for lead(II).The adsorbent amount,initial concentration of Pb(II),and pH as the significant variables on the Pb(II) removal were optimized using FCCD.Their optimum conditions are m=1.2 mg,C=390 mg·L?1,and pH=5.Based on all experimental evidences discussed in the current study,the introduced synthesized MOF has a great potential to be used as a sorbent to remove Pb(II)from water.
Acknowledgements
Authors gratefully appreciate Professor Saeid Amani for his valuable guides.
Supplementary Material
Supplementary data to this article can be found online at https://doi.org/10.1016/j.cjche.2020.08.011.
 Chinese Journal of Chemical Engineering2021年1期
- Chinese Journal of Chemical Engineering的其它文章
- Highly interconnected macroporous MBG/PLGA scaffolds with enhanced mechanical and biological properties via green foaming strategy
- Preparation and properties of a low-cost porous ceramic support from low-grade palygorskite clay and silicon-carbide with vanadium pentoxide additives
- An efficient preparation of porous polymeric microspheres by solvent evaporation in foam phase
- Engineering practice and economic analysis of ozone oxidation wet denitrification technology
- Application of an immobilized microbial consortium for the treatment of pharmaceutical wastewater:Batch-wise and continuous studies
- A polypropylene melt-blown strategy for the facile and efficient membrane separation of oil–water mixtures