No-reference blur assessment method based on gradient and saliency
2021-07-13 01:42:08JiaHuizhenLeiChucongWangTonghanLiTanWuJiasongLiGuangHeJianfengShuHuazhong
Jia Huizhen Lei Chucong Wang Tonghan Li Tan Wu Jiasong Li Guang He Jianfeng Shu Huazhong
(1Jiangxi Engineering Laboratory on Radioactive Geoscience and Big Data Technology,East China University of Technology, Nanchang 330013, China)(2Laboratory of Image Science and Technology, Southeast University, Nanjing 210096, China)
Abstract:To evaluate the quality of blurred images effectively, this study proposes a no-reference blur assessment method based on gradient distortion measurement and salient region maps. First, a Gaussian low-pass filter is used to construct a reference image by blurring a given image. Gradient similarity is included to obtain the gradient distortion measurement map, which can finely reflect the smallest possible changes in textures and details. Second, a saliency model is utilized to calculate image saliency. Specifically, an adaptive method is used to calculate the specific salient threshold of the blurred image, and the blurred image is binarized to yield the salient region map. Block-wise visual saliency serves as the weight to obtain the final image quality. Experimental results based on the image and video engineering database, categorial image quality database, and camera image database demonstrate that the proposed method correlates well with human judgment. Its computational complexity is also relatively low.
Key words:no-reference image quality assessment; reblurring effect; gradient similarity; saliency
During the process of image acquisition, camera shaking, defocusing, and rapid object movement cause blurred images. Blur distortion results in the loss of a large number of sharp details and local feature information in the whole or a part of a given image and thus seriously affects the subsequent interpretation and recognition of the image. Therefore, evaluating the quality of blurred images reasonably is of great theoretical significance. As the subjective judgment of the human eyes is time consuming, laborious, and unstable, researchers have focused on building an objective quality evaluation method in line with the judgment of the human eyes. At present, objective blurred image quality assessment (IQA) methods can be divided into three categories according to whether the original image is needed: full reference (FR)[1], partial reference (RR)[2], and no-reference (NR)[3]. The first two methods need the original image or the collection of some features of the original image. However, because most reference images are not easy to obtain or cannot be obtained at all in many practical applications, the development of NR-IQA has a wide range of practical significance, and a large number of researchers have aimed to study and explore this problem.
Mainstream NR blurred image evaluation algorithms are mainly divided into the following categories[4]: transform domain-based algorithms, reblur evaluation algorithms based on pixel statistical information, edge-based evaluation algorithms, and neural network-based algorithms. 1) Transform domain-based algorithms include the kurtosis method based on the DCT domain[5], Fourier transform algorithm[6], and global phase coherence and local phase coherence algorithm[7-8]. Using the properties of blurred images in the transform domain, this type of algorithm is characterized by definite physical meaning. However, the calculation of the model is relatively complex. 2) For reblur evaluation algorithms based on pixel statistical information, Crete et al.[9]proposed the measurement of the gray-level changes of neighboring pixels by using the reblur theory; the approaches include the adjacent gray-level difference variance method[10]and covariance matrix eigenvalue method[11]. This type of algorithm uses the statistical information of an image and yields good robustness. However, it ignores the location information of pixels, thereby greatly affecting estimation. 3) Edge-based evaluation algorithms include the just noticeable blur (JNB) algorithm[12]and cumulative probability of blur detection (CPBD) algorithm[13]. This type of algorithm is intuitive in terms of concept as it considers the characteristics of the human vision. However, such algorithm has a certain dependence on image content. The first two types of algorithms are mainly used to evaluate the quality of images according to the changes in the blur degree of the same images. They are mainly used in the field of automatic focusing of imaging systems, but they have limited usage in realistic scenarios. This type of algorithm can evaluate the blur degree of different images and achieve good performance. However, the calculation process is generally complex, and it cannot be widely used. 4) In terms of neural network-based algorithms, Yu et al.[14]proposed a measurement method on the basis of the shallow convolutional neural network (CNN). Hosseini et al.[15]proposed a measurement method called the human visual system (HVS) MaxPol. Yu et al.[16]used the general regression neural network (GRNN) instead of the multilayer perceptron in the original CNN architecture to generate the CNN-GRNN model. Although these algorithms have made valuable progress in sharpness measurement and they have high performance indicators, their high computing overhead may limit their application scope, e.g., running on low-cost mobile devices. In addition, these models based on neural networks need a large number of training samples, and existing image quality databases only contain hundreds of blurred images. This type of evaluation algorithm leads to overfitting.
The essence of blurred images is the loss of high-frequency information. Such characteristic is mainly manifested in the reduction of edge sharpness and the loss of texture details. Gradients are the constituent elements of edges, and they can reflect the changes in details and textures. The visual attention mechanism is the main factor of the HVS, which pays close attention to the regions of interest during subjective evaluation. These two visual characteristics have been widely used in IQA[17-19], and good evaluation performance has been achieved. With the above considerations, this study proposed a NR blur IQA algorithm on the basis of gradient features and saliency. The proposed algorithm uses reblur theory to construct a reference image to calculate the gradient distortion measure of blurred images. The experiments on natural image databases, namely, the image and video engineering (LIVE) database, categorial image quality (CSIQ) database, and camera image database (CID2013), show that the proposed algorithm achieves good subjective consistency and features low time complexity.
1 Algorithm
The input RGB blurred image is transformed into a gray image. Specifically, a Gaussian low-pass filter is used to blur the image and then construct the reference image. The reference image is then combined with the distorted one for evaluation. The gradient distortion measurement (GDM) can reflect tiny detail contrast, and the changes in texture features in an image are obtained by combining gradient similarities. At the same time, the saliency algorithm is introduced to detect the saliency of the input RGB blurred image. Moreover, an adaptive threshold is used to binarize the saliency map to obtain the saliency region map. The GDM map of the image and reblurred image is then weighted by the subblock saliency to form the final blur evaluation result. The principle block diagram is shown in Fig.1.

Fig.1 Flow chart of proposed algorithm
1.1 Image reblurring
In NR-IQA, the reference image cannot be obtained. Hence, these methods have certain limitations, and the accuracy of the algorithm is greatly reduced. In this work, the concept of reblur[9], which is based on the subjective perception of the human eyes, is introduced. Given the subjective perception of the human eyes, the differences between sharp images and blurred images are easier to be perceived than the differences between blurred images and reblurred images. The method in Ref.[20] is used to construct a reference image by using the variation of high-frequency components. The image blur measurement map is then obtained by fusing the similarity of the local standard deviation of the images before and after reblurring with the significance model of blurred images. The final evaluation result is obtained by weighting the measure map with the local standard deviation value map.
A distortion RGB image is the first input in our algorithm; it is transformed to grayscale version to obtain the corresponding reference image[9].
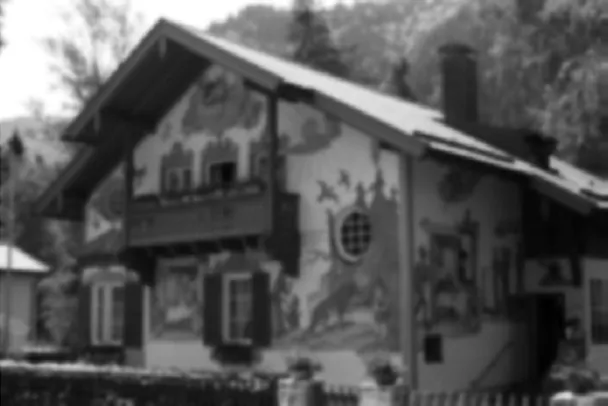
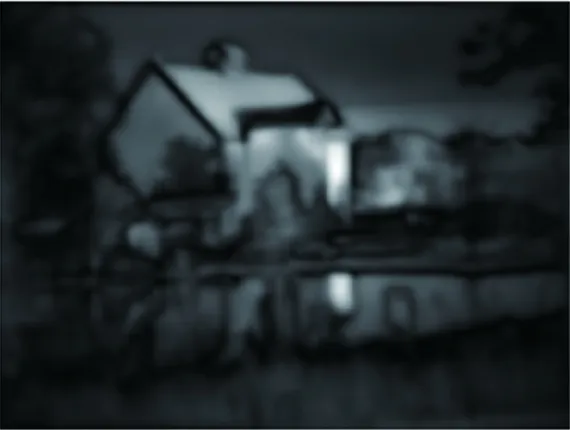
As shown in Fig.2, the difference between the first two images before and after blurring can be easily perceived, whereas the difference between the second image and the third image is not obvious.

(a)

(b)
(c)
As observed by the human eyes, a sharp image loses a considerable amount of image edge details in the process of image blurring. For an image that has been blurred, the details lost by the second blurring are more greatly reduced than those after the first blurring. This outcome is consistent with the fact that blurring affects the high-frequency components in images and that low-frequency components remain stable[21]; specifically, the blurring process mainly reduces the high-frequency components of the original image. After reblurring, the number of high-frequency components is reduced, and the image does not change greatly. Hence, the degree of change from a visual observation is minimal.
For the minimum standard deviation of effective reblurring[22], the standard deviation of the algorithm after experimental verification is set to 0.55, and the window size is 7×8.
1.2 Image gradient similarity and salient region
1.2.1 Image gradient similarity calculation
HVS research[23]has shown that the human eyes are suitable for extracting structural information in visual areas. Wang et al.[24]proposed an evaluation algorithm based on structural similarity (SSIM) that can effectively extract structural information in visual areas. Given the advantages of the SSIM algorithm, image quality can be evaluated accurately and reliably by constructing the reference image and then using the structural similarity between the reference image and the distorted image to measure sharpness. However, the SSIM algorithm’s evaluation results are not reasonable for degraded images with serious blur[25], which indicates that the evaluation value of blurred images is too high and does not conform to people’s subjective feelings. The experimental results show that the human eye is very sensitive to image edges[26-28]and that gradients can effectively reflect the changes in the details and textures of images. Such a result proves that edges are an important part of the structural information of images. For seriously degraded blurred images, extracting gradient features can help effectively evaluate the degree of image blur and align the evaluation results with the characteristics of human visual perception.
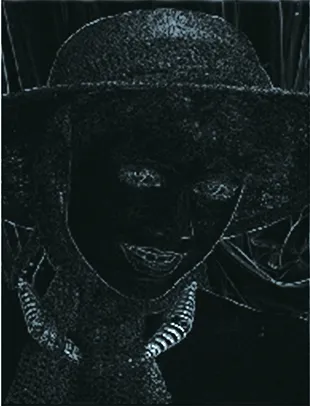
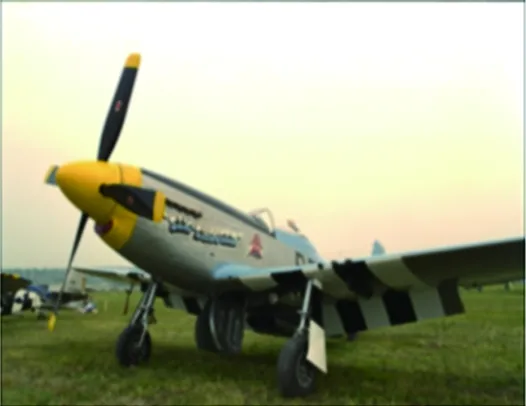
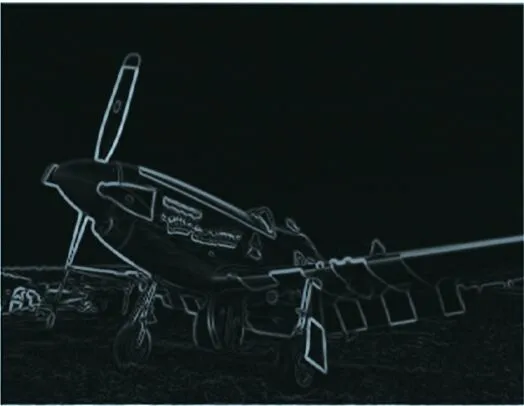
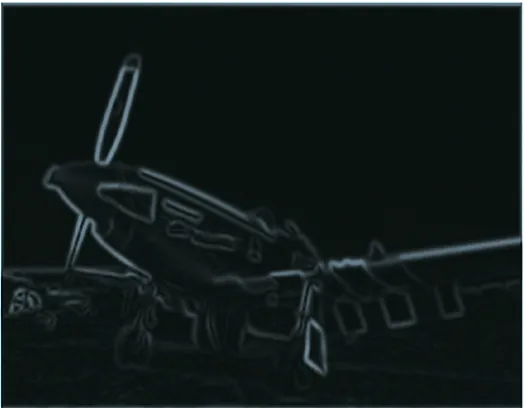
As described in Section 1.1, the blur degree of a blurred image can be determined by measuring the changes in the high-frequency components of the blurred image and its reblurred image. In extracting the gradient information of an image, most of the low-frequency components are removed. Hence, the high-frequency components become dominant, and the sensitivity to the changes in blur degree increases. As shown in Fig.3, the gradient information extracted from images with different blur degrees can effectively reflect the changes in image blur degree. In this work, the blurred image is reblurred to construct the reference image, and the blur degree of an image is calculated by combining the gradient similarities.

(a)
(b)
(c)
(c)

(e)

(f)

(g)
(h)
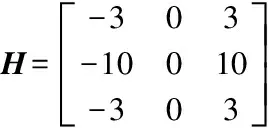
The gradient is usually calculated by linear filtering convolution. The typical filters include the Roberts, Sobel, Prewitt, and Scharr filters. This work uses the Scharr horizontal operator and Scharr vertical operator to calculate the horizontal and vertical gradients, respectively. These operators are defined as follows:

(1)
whereHandVrepresent the Scharr horizontal operator and vertical operator, respectively.
The calculation methods are as follows:
Gx=Ii?H
(2)
Gy=Ii?V
(3)
where the operation ? is the convolution operation of two matrices;Iiis the input blurred image in pixel spacei;GxandGyrespectively represent the gradient images in the horizontal and vertical directions through gradient filtering. Then,
(4)
The similarity between the blurred image (Gb) and the corresponding gradient amplitude image of the reference image (Gr) is used to measure the gradient feature changes of the image before and after reblurring. The calculation of the GDM map is defined as
(5)
whereC1is a positive constant matrix to avoid a zero denominator;Miis based on pixel-by-pixel calculation, and the gradient amplitude calculation is based on a small area block.
1.2.2 Salient region calculation
Region detection for images is a basic research topic in neuroscience and psychology.The human eyes employ a visual attention mechanism and can thus select specific regions of interest from a large amount of information, including important regions of an image. These regions of interest are called salient regions. With the deepening of the research on salient region extraction, many algorithms have been proposed[29-31]. The salient region extraction algorithm (SDSP) proposed by Zhang et al.[29]has been cited by a large number of scholars because of its simple structure and fast calculation speed. The attention mechanism of the human eyes based on some edge and local details outside location features is also an important factor affecting the visual quality of images. On the basis of the SDSP saliency model, this algorithm combines two prior features, namely, frequency saliency and color saliency.
(7)
whereSFandSCrespectively represent the frequency significance and color significance. They are defined as
(8)
wherefL,fb,fcare the three components of the color space;grepresents the log Gabor filters.
(9)
wherefArepresents the degree of green-red in the pixel;fBrepresents the degree of blue-yellow;σcis a constant parameter.
In this work, the frequency saliency feature and color saliency feature are fused on the basis of the SDSP saliency model. Relative to the classical SDSP saliency model, which fuses three features, the fused model can improve the accuracy of calculating the saliency regions of blurred images.
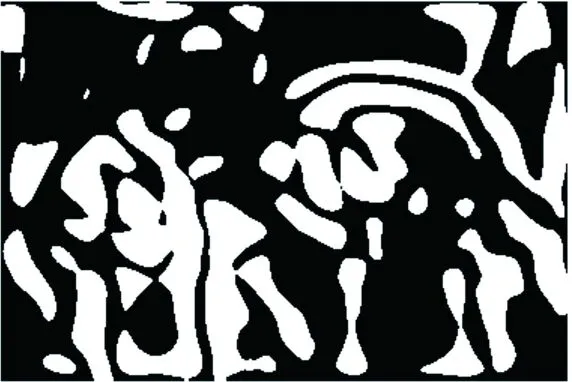
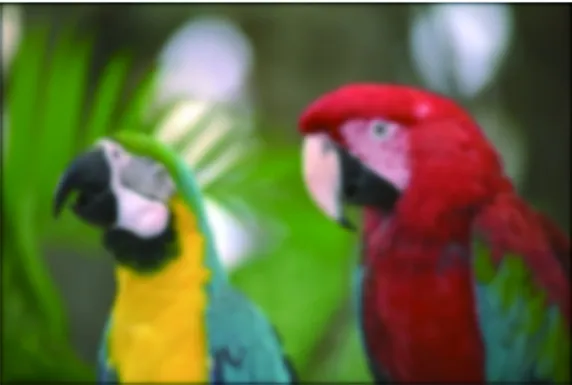
According to the adaptive threshold selection algorithm[32], the threshold in this work is obtained for blurred images with different contents and scenes. The final salient region map is obtained by binarization. This map can accurately reflect the changes in the GDM map of the original blurred image in the significant region. In the LIVE database, images of parrots with different blur degrees are selected and shown in Fig.4. Fig.4(b) is more blurred than Fig.4(a). Moreover, the image structure information of the sharper image is more degraded than that of the blurred image. In addition, the saliency map corresponding to the blurred image presents fewer changes than the saliency map of the sharp image. In this way, the saliency area of the GDM map of the blurred image can be accurately calculated. The algorithm ignores the influence of the background region and evaluates the quality of blurred images by only measuring the gradient structure distortion of the significant regions of blurred images.

(a)

(b)
(c)
(d)
(e)

(f)
1.3 Final evaluation algorithm
After calculating the GDM map of the test image and reblurred image as long as the salient region, the GDM map is weighted by the salient value of the salient region subblock to obtain the final evaluation result.
(10)
2 Experimental results and analysis
2.1 Image database and evaluation criteria
To verify the effectiveness of the algorithm, this study uses quality evaluation image databases, namely, LIVE[33], CSIQ[34], and CID2013[35]databases, in the simulation experiments. According to the Video Quality Experts Group[36], a certain nonlinear relationship exists between objective and subjective evaluation results. The performance of the proposed algorithm is objectively reflected using the nonlinear regression function of five parameters[37].
(11)
wheref(x) is the prediction score after nonlinear regression, representing the objective evaluation value;βi(i=1,2,3,4,5) denote the parameters of the model.
2.2 Gaussian filter window and standard deviation selection
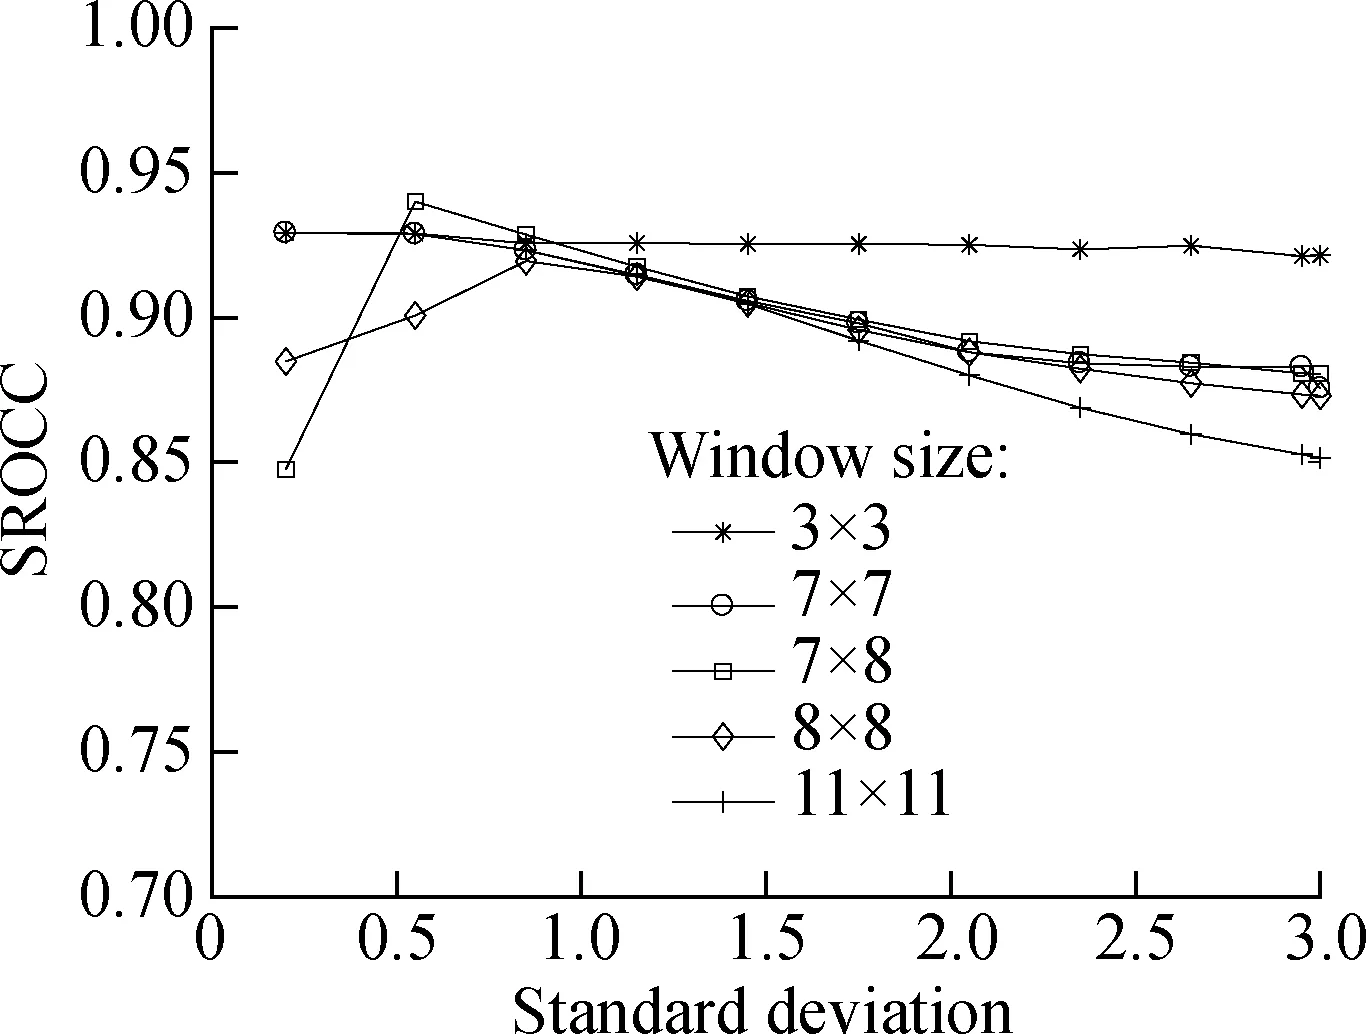
According to Section 2.1, the minimum standard deviation of effective reblurring is 0.25. Hence, the actual reblurring value in the proposed algorithmσ2should be greater than 0.25. On the basis of the effective minimum standard deviation, the index values of SROCC based on different windows and different standard deviations in two image databases are compared to select the appropriate Gaussian filter window and standard deviation. Fig.5 indicates that given the highest SROCC values in the LIVE and CSIQ databases, the window size in the algorithm is set to 7×8, and the blur standard deviation is 0.55.
(a)

(b)Fig.5 Comparison of SROCC under different windows and standard deviations. (a) Experiment in the LIVE database; (b) Experiment in the CSIQ database
2.3 Comparison experiment of significant value calculations
On the basis of the SDSP algorithm, this study proposes to fuse only two salient features, namely, frequency salient features and color salient features. A comparative experiment is performed to verify the superiority of the algorithm. Select images with varying degrees of blur in LIVE database. The results are shown in Fig.6.

(a)
(b)

(c)
(d)

(e)
(f)
The experiment results reveal that the branches in the blurred background in Fig.6(b) are not marked on the basis of the classical SDSP saliency model and that the branch area also includes edge information. Meanwhile, Fig.6(c) shows that the combination of two saliency feature models not only marks the visual saliency area but also includes some edge information outside the central area. As shown in Fig.6(d), this algorithm can mark the edges of the saliency area and some important edge information flowers. This capability differs from the saliency map based on the classical SDSP saliency model shown in Fig.6(e). Therefore, when extracting the saliency of blurred images, the saliency models of the proposed algorithm, which only fuses frequency saliency features and color saliency features, perform better than the classical SDSP saliency model.
2.4 Algorithm performance comparison
2.4.1 Natural blurred image database
In the experiment, we setC=115. Before calculating the gradient similarity, we need to filter the 3×3 image with a Gaussian weighted average and then perform downsampling. To show the evaluation effect of the algorithm intuitively, we compare it with five NR blur image quality evaluation algorithms that use the reblur[9]algorithm of the image reblurring effect, JNB model[12]of the just perceptible blur concept, CPBD[13], global phase consistency (GPC-SI)[7], and local phase consistency (LPC-SI)[8]. CPBD, LPC-SI, and the algorithm which uses reblur theory[20]are recognized as excellent evaluation algorithms in the research of NR blur image quality evaluation algorithms. The results of the proposed algorithm and five representative algorithms for the LIVE and CSIQ databases are shown in Tab.1.
As shown in Tab.1, the performance index values of the proposed algorithm are better than those of the other algorithms. In the CSIQ database, these performance index values are slightly lower than those of LPC-SI and the algorithm in Ref.[20], but they show improvement relative to the results of the other four evaluation algorithms. Given its performance in the LIVE and CSIQ databases, the proposed algorithm achieves significant improvement in its correlation and accuracy relative to the other algorithms. In general, the proposed algorithm achieves the best prediction performance in the LIVE and CSIQ databases.

Tab.1 Performance comparison of different evaluation algorithms in LIVE and CSIQ databases
2.4.2 Real blurred image database
In the real world, blur distortion is not regular and is more difficult to evaluate than blurred images in natural image databases. To verify the performance of the proposed algorithm in a real distorted blurred image database, the camera image database CID2013 is selected for the experiment. CID2013 contains 473 images and provides subjective scores for sharpness, graininess, brightness, and color saturation for each image. Only the sharpness score is used in the experiment (see Tab.2).

Tab.2 Performance comparison of real blur image databases
2.5 Time complexity comparison
To further verify the superiority of the proposed algorithm in terms of time complexity, we conduct a comparison test between the proposed algorithm and the other aforementioned evaluation algorithms (see Tab.3). The evaluation results are obtained by conducting 10 runs and adopting the mean for the image size of 512×512. The processor of the hardware platform is Intel?CoreTMi5@1.70 GHz with 4 GB memory and Windows 7 64-bit operating system. The software platform is MATLAB R2017a. Tab.3 shows that the algorithm has a relatively low time complexity. The algorithm achieves the best performance evaluation in the LIVE database (see Tab.2). Although its performance index for the CSIQ and CID2013 databases is slightly lower than that of LPC-SI, its operation time is greatly improved. Hence, the proposed algorithm is a good candidate for time-critical applications.
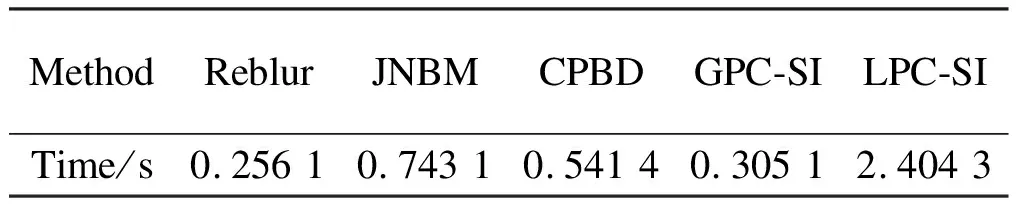
Tab.3 Running time comparison of different evaluation algorithms
3 Conclusion
1) Following the theory of reblurring, this study proposes a NR blur image quality evaluation algorithm that is based on GDM and salient region maps. The image to be evaluated is blurred by a Gaussian low-pass filter to construct a reference image. Then, the GDM map, which can reflect the contrast and texture changes of tiny image details, is obtained by combining the gradient similarities.
2) The saliency region map is calculated, and the final evaluation result of the blurred image is obtained by weighting the saliency value of the saliency region subblock.
3) The experimental results on the LIVE, CSIQ, and CID2013 databases show that the gradient and saliency features are integrated to make the evaluation results subjectively and objectively consistent with human visual characteristics.
 Journal of Southeast University(English Edition)2021年2期
- Journal of Southeast University(English Edition)的其它文章
- Investigating the factors affecting traffic violations based on electronic enforcement data: A case study in Shangyu, China
- Modeling and gender difference analysis of acceptance of autonomous driving technology
- Vulnerability analysis of multimodal transport networks based on complex network theory
- Prediction of a maximum pull-out load of anchor bolts using an optimal combination model
- Sensor fusion for heading angle estimation based on random forest algorithm
- Evolutionary selection on synonymous codons in RNA G-quadruplex structural region