Superconductivity at 44.4 K achieved by intercalating EMIM+into FeSe?
2021-10-28 07:02:32JinhuaWang王晉花QingLi李慶WeiXie謝威GuanyuChen陳冠宇XiyuZhu祝熙宇andHaiHuWen聞海虎
Chinese Physics B 2021年10期
Jinhua Wang(王晉花), Qing Li(李慶), Wei Xie(謝威), Guanyu Chen(陳冠宇),Xiyu Zhu(祝熙宇), and Hai-Hu Wen(聞海虎)
Center for Superconducting Physics and Materials,National Laboratory of Solid State Microstructures and Department of Physics,Collaborative Innovation Center of Advanced Microstructures,Nanjing University,Nanjing 210093,China
Keywords: FeSe,iron-based superconductor,electrochemical intercalation
1. Introduction
Iron-based superconductors have attracted vast interest in condensed matter physics and material science since it was discovered in 2008.[1]Among iron-based superconducting materials, the compound FeSe was reported to have the simplest structure with a critical transition temperature(Tc)of about 8 K at ambient pressure,[2]which is constituted by edgesharing FeSe4-tetrahedra layers stacking along thec-axis. By applying high pressures, a dome-shaped superconducting region with rich physics appears,and itsTcwas enhanced up to 36.7 K at 8.9 GPa.[3,4]Due to the lack of charge carrier reservoir layers, it is natural to dope carriers into the FeSe planes by intercalation in order to increase its transition temperature.Intercalating guest elements or composites into adjacent FeSe layers is the most common way to achieve that goal.
In the beginning, the alkali metals were intercalated into FeSe by solid state reactions,through whichAxFe2?ySe2(A=K,Rb,Cs,Tl,x<1,y<1)were synthesized withTcaround 32 K.[5–9]However, in order to satisfy the charge balance,phase separation occurs in the body of the material, leading to the coexistence of superconducting phaseAxFe2?ySe2and antiferromagnetic insulating phaseA2Fe4Se5.[10–13]This prohibits a thorough and systematic investigation of the physical properties in those materials. Thus, it is necessary to have a low-temperature technique to prepare intercalated FeSe-layer materials. Due to the special character of dissolving multiple metals, liquid ammonia could help to insert not only alkali metals (Li, Na, K, etc.), but also alkali-earth metals (Ca,Sr, Ba) and rare-earth metals (Eu, Yb) into the FeSe bulk samples.[14–17]These metals are co-inserted with liquid ammonia molecules,thus the inserted molecules are closer to be neutral in charge comparing with the alkali metal ion with valence state of+1,the former causes relatively complete FeSe planes with a significant increase of thec-axis lattice constant. And the highestTcof 46 K was reached among this series of superconductors.[14]Although a large increase ofTcwas realized, the chemical activity of intercalating composites between the adjacent FeSe layers made those materials extremely unstable in air. Using the hydrothermal technique and improved hydrothermal ion-exchange process,[18–20]a stable compound Li1?xFexOHFeSe with an ordered guest-layer Li1?xFexOH was prepared withTcup to 42 K.[20]Besides the inorganic molecules which are co-inserted with metals,organic molecules could also be intercalated into FeSe,[21–28]producing a series of superconductors with differentc-axis lattice parameters. Due to the varying size of organic molecules,such as C5H5N,(H2N)CnH2n(NH2),and CnH2n+3N(n=6,8,18),[21,24,28]the interlayer spacing could be largely stretched to a certain degree, and the largestc-axis lattice parameter of 55.7 °A was achieved in Lix(ODA)yFe1?zSe withTcof about 42 K.[28]
Besides plenty of researches about alkali metals coinserted with inorganic or organic molecules into FeSe,some new superconductors were also discovered simply by intercalating organic composites, forming for example(C2H8N2)xFeSe.[29]This may pave a new way to synthesize intercalated FeSe derivative superconductors. The intercalation of C2H8N2in FeSe madec-axis lattice parameter expanded up to 21.700(6) °A. Moreover, two other different organic ions,cetyltrimethyl ammonium(CTA+)and tetrabutyl ammonium (TBA+),[30,31]were successfully inserted into FeSe through electrochemical intercalation. It has been found that these two kinds of organic-ions intergrown with FeSe formed a bulk superconductivity showingTcof 45 K and 50 K,withc-axis lattice parameter expanded up to 14.5 °A and 15.5 °A,respectively. Through the similar method, a new derivative of FeSe, the so called protonated FeSe (Hy-FeSe),was discovered withTcof 41 K,[32]in which the existence of hydrogen was indicated by nuclear magnetic resonance(NMR) measurements. But it is unclear what is the real superconducting phase,and studies on the detailed structure and physical properties are lacking up to now.
In this work,we give detailed investigation on the above material, named as protonated FeSe, obtained through the same method and interactant, 1-ethyl-3-methylimidazolium tetrafluoroborate (EMIM-BF4), as reported by Cuiet al.[32]According to the x-ray diffraction (XRD) measurements, we show that the title compound has a highly expandedc-axis constant, thus we conclude that the relevant phase is not Hy-FeSe, but rather another organic-ion-intercalated FeSe[(EMIM)xFeSe]. TheTcof this new FeSe-based superconductor is 44.4 K, as evidenced by the results of temperature dependent magnetic susceptibility and resistivity measurements. Note that our intercalated (EMIM)xFeSe samples are also not very stable in atmosphere, very similar to the(TBA)0.3FeSe,[31]and after a few days it will degrade back to the pristine FeSe withTcof about 8 K.
2. Experimental details
The schematic experimental setup of the electrochemical intercalation experiment is illustrated in Fig. 1(a).[32]As shown in the illustration, the positive and negative electrodes made of platinum are placed in an ionic-liquid container.Then this device is put into a heating mantle to maintain a certain temperature during the electrochemical process.The FeSe single crystal grown by means of chemical vapor transport technique is attached on the negatively charged electrode by silver paste,[33,34]while positive electrode Pt wire is placed right opposite to it. After loading the FeSe single crystal on the electrode,we add ionic liquid into the container till the sample is completely immersed. During the electrochemical process, a constant voltage of 4 V is applied and the temperature of the heating mantle is set to 355 K.After about three days of electrochemical reaction,the intercalated FeSe crystal is removed from the electrode and various measurements are taken after cleaning the silver paste and some residual reactants on the sample surface.
The XRD is conducted on a Bruker D8 Advanced diffractometer with the CuKαradiation at room temperature. The temperature dependent resistivity is measured by a physical property measurement system(PPMS-16 T,Quantum Design)through the typical four-probe method in different magnetic fields. The temperature dependent magnetic susceptibility is measured by Quantum Design PPMS with vibrating sample magnetometer(VSM),while the magnetic field is applied parallel to thec-axis of the sample.
3. Results and discussion
Figure 1(b)shows the XRD patterns of pristine FeSe single crystal and intercalated FeSe after the electrochemical reaction. No matter before or after the experiment, the sample remains having good crystallinity. Hence, the XRD patterns show an obviousc-axis orientation and all peaks are indexed perfectly as (00l) on the basis of tetrahedral structure. The black solid line represents a series of(00l)peaks of FeSe single crystal, which indicates ac-axis lattice parameter of 5.52 °A.Meanwhile,the red solid line contains two sets of peaks. One set of them shows the same diffraction peaks as the black line, belonging to the residual FeSe of the sample. The other set represents a new phase, which has a largerc-axis lattice parameter. The Miller indices(00l)in Fig.1(b)are assigned on the basis of a primitive tetragonal structure with the space group ofP4/nmm, in which thec-axis lattice constant is 10.45 °A. While taking the space group of bodycentered tetragonalI4/mmm,only even values ofh+k+lcan appear in accordance with the extinction rule, and thec-axis lattice constant should be 20.88 °A.However,the precise symmetry needs more experiments to identify.Such an obvious increase of thec-axis lattice parameter suggests that some kind of molecules with big size has been inserted into the sample in the experiment and the spacing between adjacent FeSe layers is expanded. Considering the fact that the pristine FeSe is held on the negative electrode,we intend to conclude that the inserted molecules are most likely organic ions EMIM+from the ionic liquid. The schematic structure of this new phase is shown in Fig.1(c).Considering the finite size for three dimensions of the organic ions, they probably arrange themselves with a specific orientation between the adjacent FeSe layers as shown in Fig.1(c). However,this needs further verification by determining the internal structure.
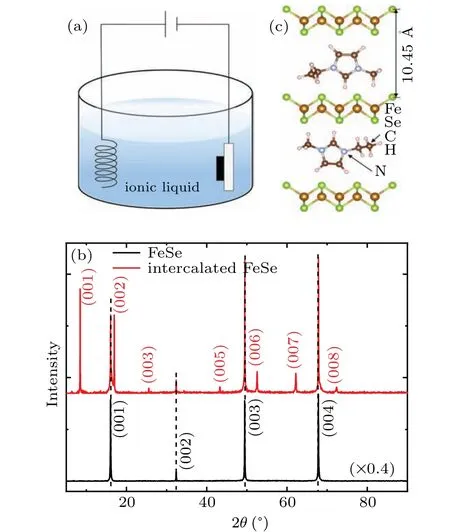
Fig.1. (a)An illustration of the device for the electrochemical reaction.(b) XRD patterns of FeSe single crystal and intercalated FeSe. The Miller indices of the intercalated phase are colored by red,and those of FeSe phase are colored by black. (c)The schematic crystal structure of(EMIM)xFeSe.
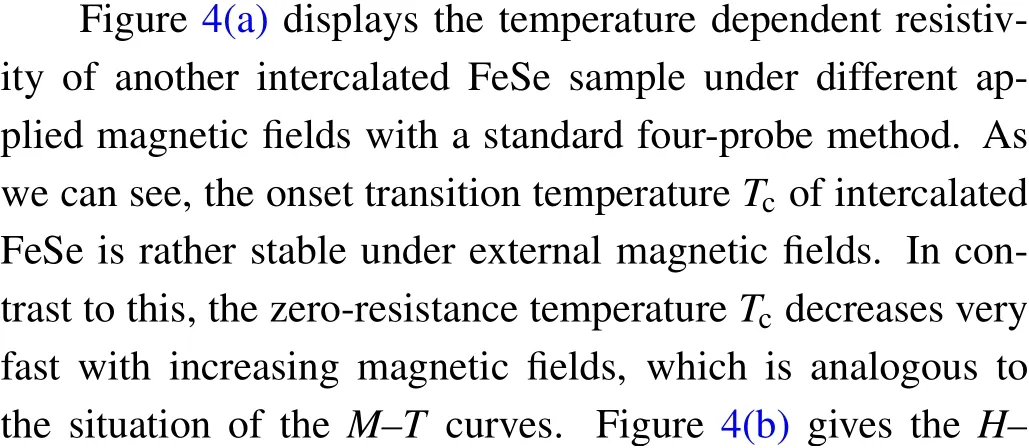
The temperature dependences of magnetic susceptibility and resistivity have been measured,and the results are shown in Fig. 2. It is worth mentioning that two samples from the same batch were used for the magnetic and transport measurements since the quality of the samples degraded quickly in the transfer process between two types of measurements. Figure 2(a)exhibits the temperature dependent magnetic susceptibility(χ–Tcurve)of intercalated FeSe,which is measured in zero-field-cooled(ZFC)and field-cooled(FC)modes with an applied magnetic field of 3 mT. The magnetic screening volume calculated from the ZFC data is about 437%comparable to the value reported previously in the similar systems,[30–32]which is larger than 100% as the demagnetization effect has not been taken into account. A sharp transition shows up at about 40 K in theχ–Tcurve,demonstrating the emergence of superconductivity. Note that theTcof FeSe is around 8 K,[2]but this superconducting transition is not visible in theχ–Tcurve. The contradiction between XRD patterns andχ–Tcurve may be explained in the following way. One possible reason for the appearance of two phases in the XRD patterns is that the freshly intercalated sample is extremely unstable and some part of the sample with highTchas degraded into the FeSe phase. It is found that, after exposing samples in air for some time, the content of the phase with highTcsuperconductivity reduces and finally disappears,as revealed by XRD patterns and magnetizations,at the meantime the component of the FeSe phase increases. The time needed for preparing the magnetization and XRD measurements is different. In measuring the magnetization, the sample is quickly put into the sample chamber and cooled down, thus more and even complete content of the highTcphase is sustained. However,the XRD measurements are conducted under ambient environment,usually for hours,during this process the sample which is supposed to be mainly composed by the highTcphase will degraded, and some part will become FeSe. Thus, it is easy to understand the absence of the magnetization drop at about 8 K for FeSe for the freshly intercalated sample,but there are always two phases showing up in the XRD patterns. In order to check this scenario,we have measured temperature dependence of magnetization for samples with different durations after exposing to air. The results are shown in Fig.5. Here we show the magnetization of a freshly intercalated sample with mainly the highTcphase,and that after a long time exposing in air. One can see a clear evolution of the highTcphase to FeSe.Thus for investigating the properties of the highTcphase,the magnetization measurement must be done quickly after the intercalated samples are obtained. Figure 2(b)presents the temperature dependent resistivity under zero magnetic field with a current of 100μA.There is a dramatic decrease of resistivity at 44.4 K,which is roughly consistent with theTcobtained from theχ–Tcurve. The resistivity reaches zero at 38.5 K.
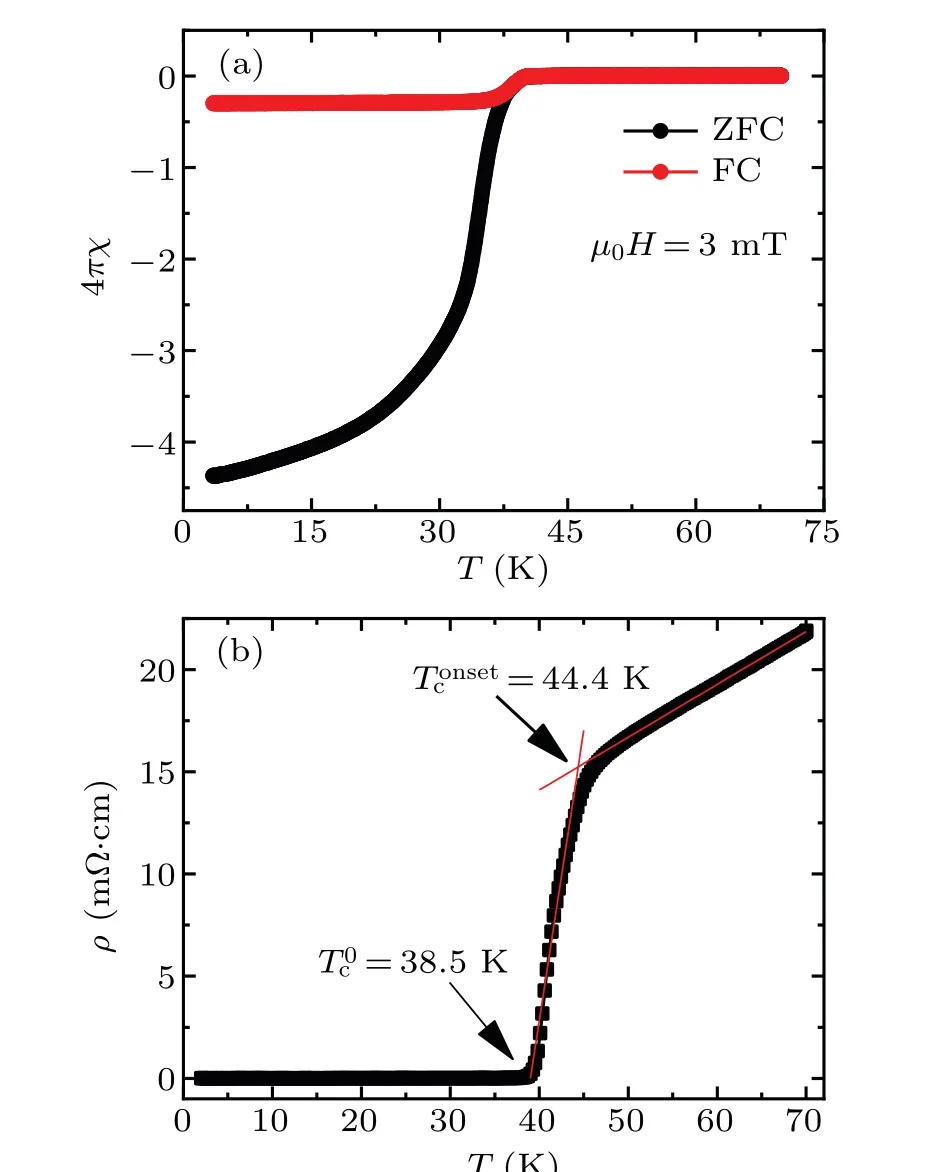
Fig. 2. (a) Temperature dependent magnetic susceptibility of intercalated FeSe single crystal measured in ZFC and FC modes under a magnetic feild of 3 mT. (b) Temperature dependent resistivity under zero magnetic feild.
In order to check the magnetic characteristics of the intercalated crystals,we have measured the temperature dependent magnetic susceptibility of intercalated FeSe in ZFC and FC modes at different fields(M–Tcurves),and the results are shown in Fig.3(a). At low fields,the ZFC curves show a trend of saturation. With increasing external magnetic fields, the magnetization value of the ZFC curve at low temperature is suppressed,which corresponds to the decrease of the magnetic screening volume. The inset of Fig. 3(a) shows the enlarged view ofM–Tcurves near the transition. The deviation point of the ZFC and FC curves can be defined as the irreversible temperatureTirrin the external fields, and theTirrdecreases quickly with increasing applied magnetic field. The temperature dependence of irreversibility fieldHirr(T)(M–T)of intercalated FeSe is shown in Fig.4(b).Figure 3(b)shows the magnetization hysteresis loops(MHLs)at 3.5 K and 10 K,respectively. The MHLs show a typical magnetic hysteresis behavior of type-II superconductors. The width of MHL measured at 3.5 K is much wider than that at 10 K,and the ?Mof MHLs at low temperatures are comparable to those of other iron-based superconductors,like(Li1?xFex)OHFeSe,[35]which indicates the good vortex pinning of our samples.
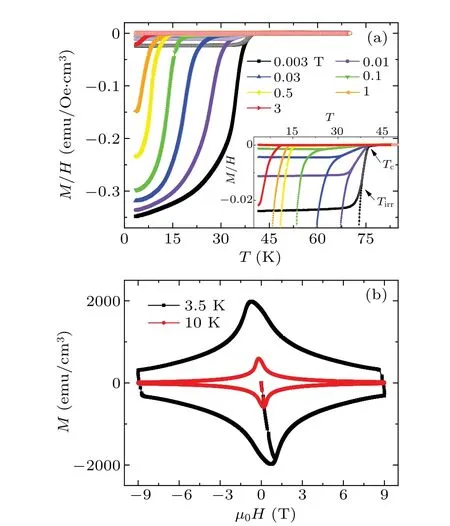
Fig. 3. (a) Temperature dependent magnetic susceptibility of intercalated FeSe single crystal measured at different magnetic fields. Inset shows the enlarged view of the M–T curves near the transition.(b)Magnetization hysteresis loops (MHLs) of intercalated FeSe single crystal at 3.5 K and 10 K.
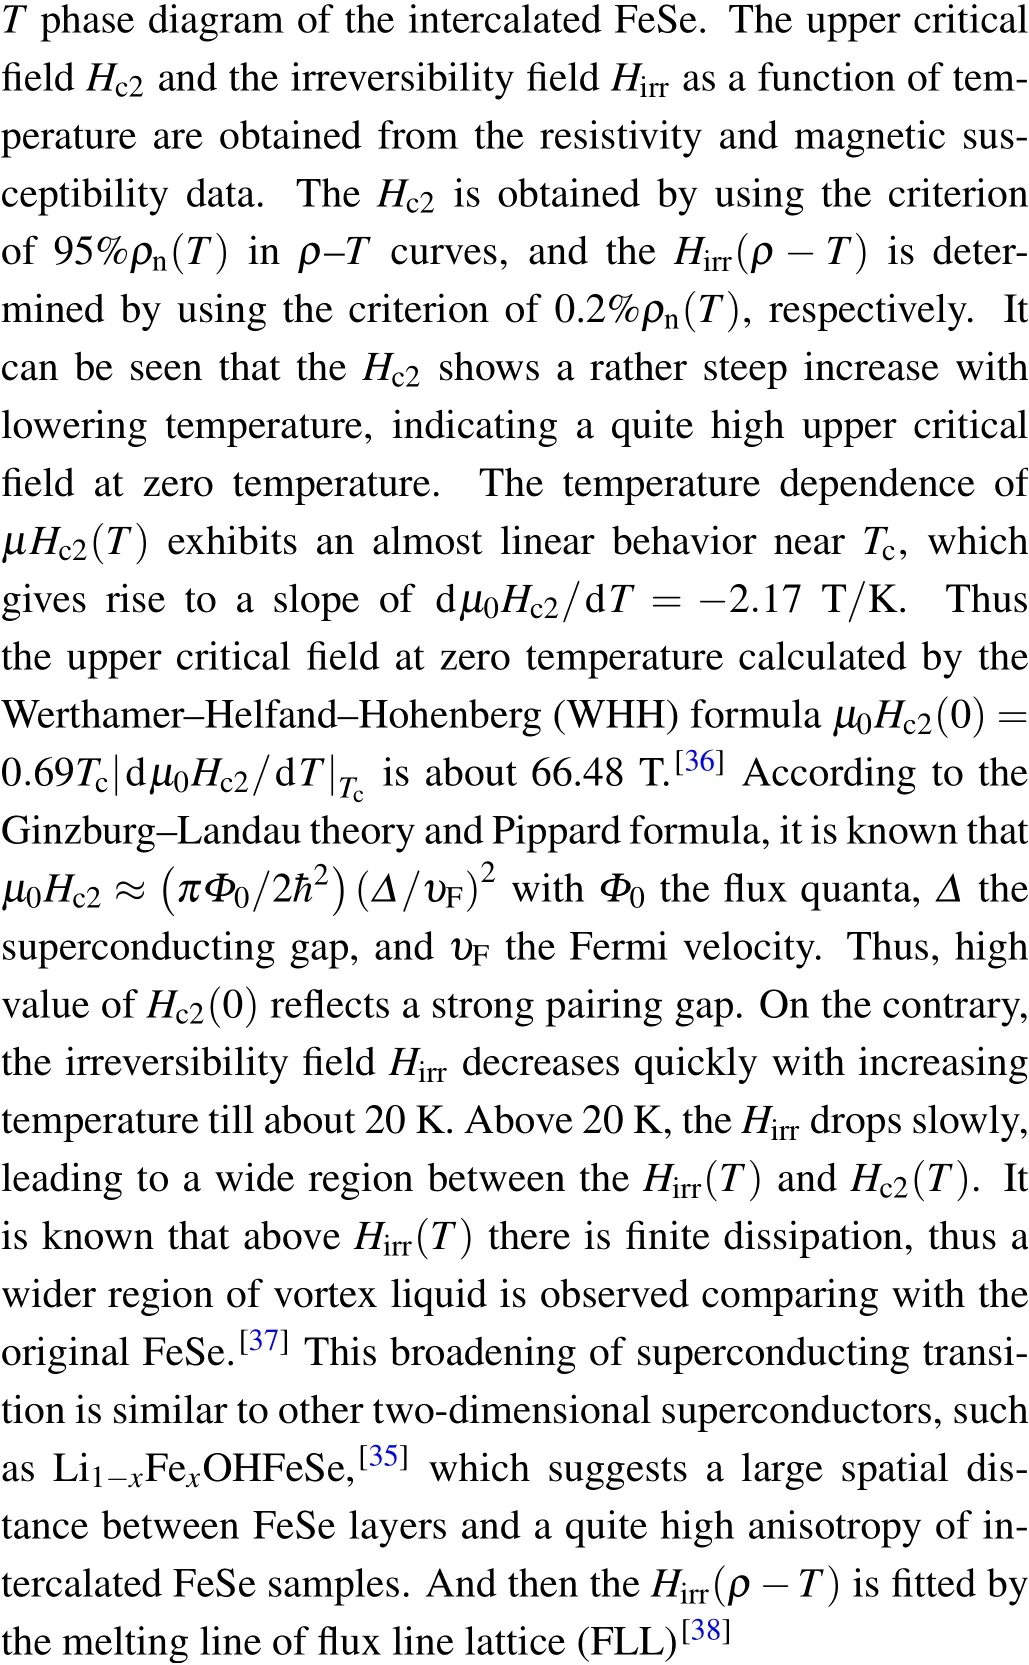
witht=T/Tc,b=H/Hc2, which is deduced from the Lindermann criterion.[39]The parameterαis given by the formulaα=2π(εMZ/M)?1/2c2, with the Lindermann numberc ≈0.15–0.25 andε=16π3κ4(kBTc)2/Φ30H0c2,in whichκis the Ginzburg–Landau parameter. The mass ratio (MZ/M)1/2becomes larger as the spacing distance between FeSe layers increases,whereMZis a quasiparticle effective mass along thecaxis andMdescribes the mass in the FeSe planes. The optimal result ofα=0.33 is obtained by fittingHirr(T) data.In the fitting process, the parameterκin high-Tcsuperconductors usually takes a large value likeκ= 100, such as when it equals to 95, theHirr(T) data of Bi2.2Sr2Ca0.8Cu2O8could be well fitted by the melting criterion.[38]Thus, we take a general value ofκ=100 as the intercalated FeSe is a high-Tcsuperconductor (Tc=44.4 K). By substituting theHc2(0),Tc, andc= 0.2 into the formula ofα, we get the mass ratio (MZ/M)1/2≈44.5, which is comparable with the value of a quasi-two-dimensional (quasi-2D) superconductor Bi2.2Sr2Ca0.8Cu2O8[(MZ/M)1/2=60],[38]and much larger than that of 1.82 in FeSe,[37]11 in (Li1?xFex)OHFeSe single crystal,[40]further proving the high spatial anisotropy of the sample.
Fig. 4. (a) Temperature dependent resistivity under different applied magnetic fields. (b)H–T phase diagram of the intercalated FeSe.Black squares represent the upper critical field Hc2(T) data. Blue (magenta)symbols represent the irreversibility field Hirr(T) obtained from the temperature dependent resistivity (magnetic susceptibility) data. The red and green solid lines show the fitting results of Hc2(T)and Hirr(T),respectively.
Figure 5 shows the degradation situation of the intercalated FeSe sample. The magnetization measurements are conducted at a freshly intercalated sample mainly composed by the highTcphase,and the same one after a long time exposing in air as shown in Fig. 5(a). The black squares show the results of magnetization measurement for the intercalated sample. One can clearly see a sharp superconducting transition at about 40 K, which is associated to the intercalated phase.At the meantime, the ZFC curve also drops a little at 8 K,which might be caused by the partial degradation of the sample. After exposing the sample in air for a long time, only the transition at 8 K is seen, which corresponds to the superconducting transition of FeSe,suggesting that the intercalated phase has degraded back to FeSe. Meanwhile, we also measure the XRD patterns after the magnetization measurements.As shown in Fig.5(b),the XRD patterns of the freshly intercalated sample indicate that there are two phases with differentc-axis lattice parameters. However only FeSe phase remains after a long time exposing the sample in air. The simultaneous disappearance of the high-Tcsuperconducting phase and the XRD patterns with larger lattice parameter further proves that the highTcof the freshly intercalated sample is attributed to the intercalation of organic cations.
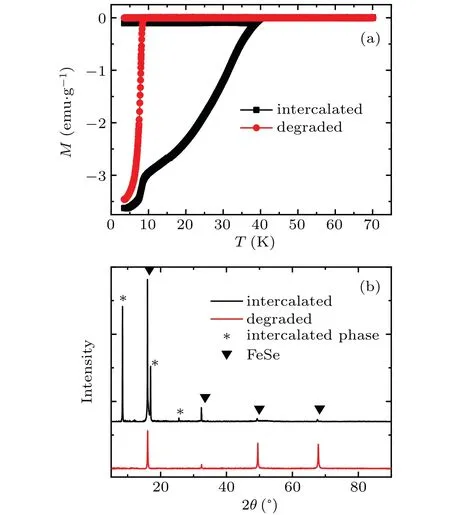
Fig.5. (a)Temperature dependent magnetic susceptibility of a freshly intercalated sample and the one after degradation,which is measured in ZFC and FC modes with an applied magnetic field of 1 mT. (b) XRD patterns of the freshly intercalated and degraded phases. The peaks marked by star belong to the intercalated phase,and the rest marked by down-triangle belong to the FeSe phase.
4. Conclusions
We report superconductivity with transition temperatureTcabove 40 K by electrochemically reacting FeSe with the ionic liquid of EMIM-BF4.This phenomenon was recently reported as a process of protonating the FeSe crystals,but it was not clear what is the real superconducting phase. By doing x-ray diffraction measurements, we find a new set of diffraction peaks arising from the intercalated samples, these newly emergent peaks coexist with those of residual FeSe. We conclude that the newly emergent superconducting phase is the organic-cation (C6H11N+2, EMIM+)-intercalated FeSe phase,namely,(EMIM)xFeSe.Our results rule out the possibility that the high temperature superconducting phase is the simple protonated one Hy-FeSe. We also find that the upper critical fieldHc2is quite high,indicating a strong pairing potential. While the irreversibility fieldHirris suppressed quickly with increasing temperature,showing a large region of vortex liquid in the phase diagram. By fitting the irreversibility line to the vortex melting formula deduced from the Lindermann criterion, we get a quite large mass ratio(MZ/M)1/2≈44.5,which is much larger than the value of FeSe and (Li1?xFex)OHFeSe single crystal. This also supports that the resultant material should be highly anisotropic, as expected for a system with a large spacing between the FeSe layers.
Acknowledgment
We appreciate the kind help from Weiqiang Yu and Tianfeng Duan for establishing the device for the electrochemical reaction.

- Chinese Physics B的其它文章
- Physical properties of relativistic electron beam during long-range propagation in space plasma environment?
- Heterogeneous traffic flow modeling with drivers’timid and aggressive characteristics?
- Optimized monogamy and polygamy inequalities for multipartite qubit entanglement?
- CO2 emission control in new CM car-following model with feedback control of the optimal estimation of velocity difference under V2X environment?
- Non-peripherally octaalkyl-substituted nickel phthalocyanines used as non-dopant hole transport materials in perovskite solar cells?
- Dual mechanisms of Bcl-2 regulation in IP3-receptor-mediated Ca2+release: A computational study?