Strength characteristics and energy dissipation evolution of thawing silty clay during cyclic triaxial loading
2021-12-29 03:15:22HongHuanCuiBoYuanShaoXiaoWenHan
HongHuan Cui,BoYuan Shao ,XiaoWen Han
1.Hebei Provincial Key Laboratory of Civil Engineering Diagnosis,Reconstruction and Disaster Resistance,Zhangjiakou,Heibei075000,China
2.Hebei University of Architecture,Zhangjiakou,Hebei 075000,China
ABSTRACT Cyclic triaxial tests are conducted to analyze the evolution of strength parameters and energy dissipation of thawing silty clay under different stress paths.The effects of freezing temperature,thawing temperature and confining pressures on the stress-strain and strength characteristics of soil samples are studied through monotonic loading and cyclic loading tests by using high-and low-temperature triaxial apparatus.The variation of the total work,elastic deformation energy,dissipated energy,energy dissipation rate,residual strain,and damage variable during loading and unloading are discussed.The ex‐perimental results show that the samples have higher strain tolerance under high confining pressure,low freezing tempera‐ture,and low thawing temperature,and the same other conditions.The soil sample state and failure pattern can be judged by using the energy parameters measured in the experiment.
Keywords:thawing soil;stress-strain relationship;triaxial cyclic loading and unloading;energy dissipation
1 Introduction
With the rapid improvement of China's overall economy and the vigorous development of infrastruc‐tures in the cold region,frozen soil mechanics,the foundation of engineering design,has become a focus of current research topics.The deformation and strength characteristics are essential for understanding the behavior of frozen soil.Frozen soil is very sensi‐tive to temperature and extremely unstable in nature.Its properties are controlled not only by mineral and particle size composition,density,and water content of soil particles but also by ice content.In seasonally frozen soil areas,the soil undergoes freeze-thaw cy‐cles at least once or twice a year.On the one hand,the freeze-thaw cycle will change the bearing capacity of the soil.During thawing,because the soil in the lower part of the subgrade is not completely thawed,the drainage in the upper part is limited,which often leads to a pronounced reduction in the bearing capaci‐ty and even damage.On the other hand,the traffic load is a long-term reciprocating cyclic load,and the vertical stress changes cyclically.During spring thaw‐ing,the frequent use of large trucks and other cyclic loads can cause severe damage to the subgrade,result in increasing settlement and many road diseases,and compromise the safety and operationality of the subgrade.
Past studies on seasonally frozen soil under cyclic loading mainly focus on frozen soils.One of the earli‐er studies by Sun et al.(2005)focused on the defor‐mation characteristics and mechanical properties of frozen sandy soil under triaxial cyclic loading.Through triaxial compression and cyclic tests,Yang et al.(2010)obtained the stress-strain relationships and the relationship between compressive strength and other mechanical parameters of different Qinghai-Ti‐bet frozen silt.Xu et al.(2014)carried out triaxial cy‐clic loading tests and monotonic loading comparative tests to study the deformation and damage characteris‐tics of frozen loess under two stress paths.Recently,Cui et al.(2020a)conducted static triaxial tests on samples under different conditions such as confining pressure and water content to explore the static char‐acteristics of the unidirectional thawing silty clay sub‐grade.In addition,Cui et al.(2020b)carried out three-week cyclic loading tests on thawing silty clay and analyzed its strength characteristics and hystere‐sis evolution law.
To sum up,there are few studies on thawing soil properties under cyclic loading,and there is no related report on deformation characteristics.However,in the vast seasonally frozen soil areas,freezing and thaw‐ing often cause damage to the subgrade,which leads to excessive deformation,primarily due to the coexis‐tence of ice,water,soil particles,and gas in thawing soil.In contrast,the completed thawed soil consists of three phases,i.e.,soil particles,water,and gas,and the entirely frozen soil mainly comprises soil particles,ice,and gas.Thawing soil is the most unstable and has the weakest deformation resistance.In this study,high-and low-temperature triaxial apparatus were used to carry out monotonic loading and cyclic load‐ing tests on thawing silty clay to investigate the evolu‐tion of the mechanical properties.The results can be helpful for road construction and maintenance in sea‐sonally freezing regions.
2 Soil sample and test scheme
2.1 Sample Preparation and Physical Properties
The soil in this study was sampled from a site along the Zhangcheng Expressway in Hebei Province.The particle composition is listed in Table 1,and the index properties are summarized in Table 2.After dry‐ing and screening with a 2-mm sieve,the sample was mixed with water evenly to form a loose soil with cor‐responding water content and stored for 12 hours in a closed condition to allow the soil and water to achieve equilibrium.According to the Standard of Geotechni‐cal Test Methods(GB/T501 23-2019)and the High‐way Geotechnical Test Regulations(JTG E40-2007),cylindrical samples with a diameter of 61.8 mm and a height of 125 mm under the design moisture content and 90%compaction were prepared.After comple‐tion,it was sealed with the mold and frozen at the cor‐responding negative temperature for 12 hours in an environment chamber.Then,it was demolded and in‐stalled in the test apparatus to conduct triaxial cyclic loading tests under selected thawing temperatures and confining pressure.
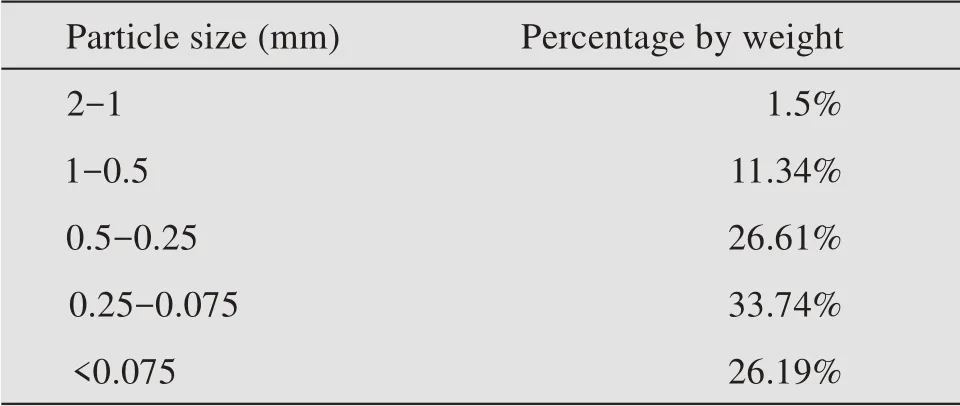
Table 1 Soil sample grain size distribution
2.2 Test Scheme
(1)Considering the main elements affecting the strength of thawing soil subgrade and local climate characteristics,three factors,including confining pres‐sure,freezing temperature,and thawing temperature,were selected in this study.Among them,the confin‐ing pressure was set to 20 kPa,50 kPa,or 80 kPa,the freezing temperature was?5℃,?10℃,or?15℃,and the thawing temperature was 6℃or 12℃.In all cases,the optimal moisture content of 12%was used to prepare specimens.
(2)The test was carried out in high-and low-tem‐perature triaxial apparatus.As shown in Figure 1,the pressure chamber is divided into an inner compart‐ment and an outer one,with the inner one connected to an axial compression system and the outer one linked with a water bath system.Water from the bath at a selected thawing temperature is circulated in the pressure chamber to maintain a constant temperature.The testing machine is controlled by a computer,which can display in real-time,collect data automati‐cally,and obtain the whole stress-strain curve of a specimen under triaxial compression.A displacement sensor with a range of up to 8 mm with an accuracy of 1.0×10?5mm is used to measure the axial deforma‐tion,and a load cell with a capacity of 2,000 kN and an accuracy of 1.0×10?3kN is used to measure the axial load.

Table 2 Soil sample index properties
(3)In the repeated loading and unloading,the specimen is loaded to 2%of axial strain,then unload‐ed until the deviator stress(σ1?σ3)becomes zero,and then re-load until the axial strain is increased by 2%-3%compared with the previous one,and then un‐load.The loading and unloading processes are repeat‐ed in turn until the maximum axial strain reaches 15%after complete unloading.The axial strains achieved during the experiment are 2%,4%,6%,9%and 12%,and a typical test curve is illustrated in Figure 2.
(4)The heat loss during the installation process of the sample can be ignored due to the short time.The test loading and unloading rates are 1.67×10?2mm/s,and the test ends when the sample axial strain reaches 15%.The cyclic loading and unloading test took about 30 minutes,and the complete thaw of the sam‐ple core to the test temperature took about 25 minutes in the indoor environment.During the test,constant thawing temperature can be guaranteed by the appara‐tus,and the test conditions satisfy the requirements of the triaxial test of thawing soil.
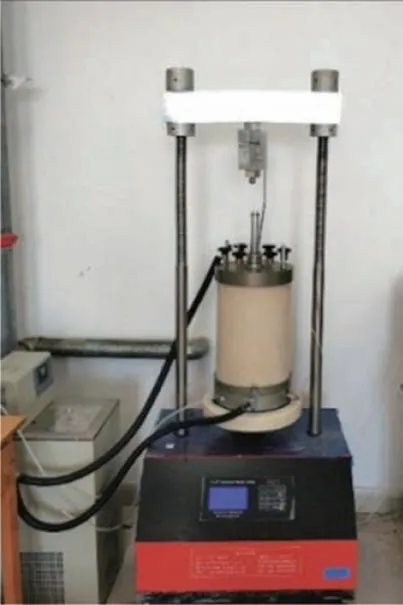
Figure 1 View of the TKA-TTS-10D triaxial apparatus with temperature control
3 Analysis of test results
3.1 Peak stress evolution of thawing soil during cyclic loading
Soil samples are frozen unidirectionally in a closed system.Under the same water content and compaction,the cooling temperature determines the soil frozen depth,the water migration pattern,and fi‐nally,the cryostructure(Yang et al.,2010).Frozen soil samples with various cryostructures would dem‐onstrate different properties during thawing and load‐ing.Figure 3 shows the initial peak stress diagram un‐der three freezing temperatures(-5℃,-10℃,-15℃)and three confining pressures(20 kPa,50 kPa,80 kPa)at a thawing temperature of 6℃.Note that the initial peak stress refers to the maximum stress in the first two cycles.

Figure 2 A typical stress-strain curve of repeated loading and unloading test
As shown in Figure 3,soil samples frozen under different conditions also show various properties during the same thawing temperature and loading process.At the same confining pressure and thawing temperature,the initial peak stress of the sample in the first two cycles increases with the decrease of cooling temperature,which indicates that the soil sample with a lower cooling temperature has a high‐er resistance to deformation.The soil samples with a lower cooling temperature have a deeper maximum frozen depth,more frozen water,higher ice strength,a faster freezing rate,and less impact on the soil structure.Therefore,the soil samples frozen at a low temperature are more resistive to deformation.Also,under the same freezing and thawing temperatures,the initial peak stress value of the sample with a high confining pressure is larger.The reason is that under high confining pressure,the particles are close to each other,and the frictional resistance between particles increases.
Figure 4 is a graph showing the influence of dif‐ferent cooling temperatures on the peak stress of each cycle.It can be seen from Figure 4 that,at the initial test stage,the soil sample is still in a frozen state.Due to the friction between particles and ice cementation,the soil shows higher initial strength;the lower the cooling temperature,the higher the initial strength is.Additionally,from the fourth cycle,the peak stresses of the samples begin to decrease and converge under the three working conditions,and this trend continues until the end of the experiment,indicating that the cooling temperature has little effect on the final strength.Combined with Figure 3,it can be seen that the confining pressure has a significant influence on the soil strength throughout the repeated loading and unloading cycles,and the soil strength with a high confining pressure is generally higher.
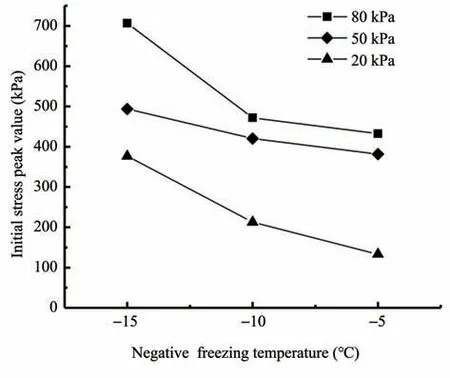
Figure 3 Initial peak stress corresponding to different freezing temperature and confining pressure under 6℃thawing temperature
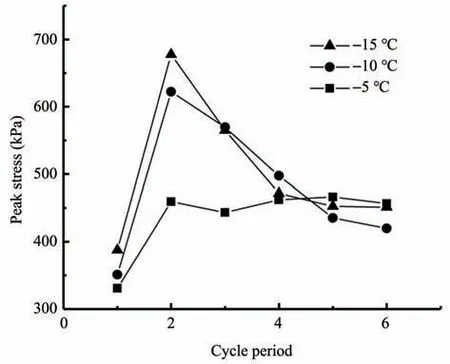
Figure 4 Peak stress vs.testing cycles for samples subject to various freezing temperatures and the same thawing temperature of 6℃and confining pressure of 80 kPa
Based on the above analysis,it can be concluded that the peak stress of the thawing soil appears in the initial test stage,since there is a large amount of pore ice cementing soil particles,which contributes to most of the soil strength.With the progress of the test,the pore ice in the soil sample melts completely,and the strength of the sample is 71.4%-95.5%of the peak strength.
3.2 Evolution of elastic modulus of thawing soil during cyclic loading and unloading
According to The Code for Highway Subgrade Design(JTGD30-2015),static modulus of inorganic bond stabilized materials is taken as the design param‐eter in the road design,which undoubtedly fails to take into account the dynamics of autumn freezing and spring thawing within the subgrade and pavement in seasonally frozen soil areas.In addition,as can be seen from the above,the bearing capacity of the nor‐mal soil subgrade will be weakened compared with that of the conventional soil subgrade,so it is neces‐sary to explore the evolution of the elastic modulus of the normal soil.
When studying the evolution of thawing soil elas‐tic modulus during cyclic loading,it is necessary to determine the slope of each hysteresis loop with the help of its stress-strain curve.The elastic modulus represents the soil's ability to resist deformation.The elastic modulus values at different test conditions are obtained,and its variation with the number of load‐ing cycles is depicted in Figure 5.Only the data for thawing temperature of 6℃is shown below since the data trend for thawing temperature of 12℃is very similar.
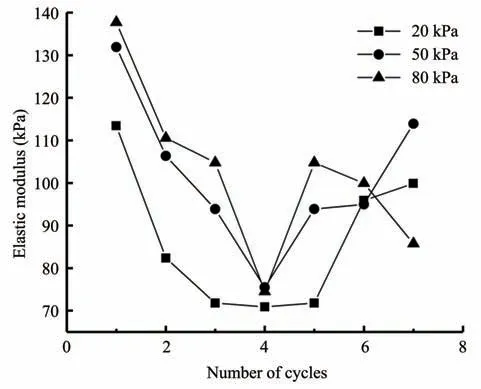
Figure 5 Variation of elastic modulus vs.the number of loading cycles under different confining pressures for the freezing temperature of?15°C and thawing temperature 6°C
As can be seen from Figure 5,with the increase of the number of cycles,the elastic modulus decreases first,then increases,and reaches the minimum value around the fourth cycle.The reason is that the soil sample is frozen at the initial test stage,and the ce‐mentation of pore ice and its inability to be com‐pressed afford the soil sample with great deformation resistance.However,as the test progresses,the soil sample gradually thaws,and the pore ice cementation gradually weakens and even disappears,resulting in a minimum elastic modulus around the fourth cycle.Af‐ter the soil samples are completely thawed,the soil samples are allowed to consolidate under confining pressure,resulting in increased friction angle and hence,enhanced ability to resist deformation again.With the increase of confining pressure,the maximum decrease rate of elastic modulus moves to the right,which indicates that the confining pressure limits the transverse soil deformation to a certain extent.
To explore the influence of freezing temperature on the elastic modulus under cyclic loading,the evo‐lution of elastic modulus with the number of cycles at different freezing temperatures is depicted in Figure 6.
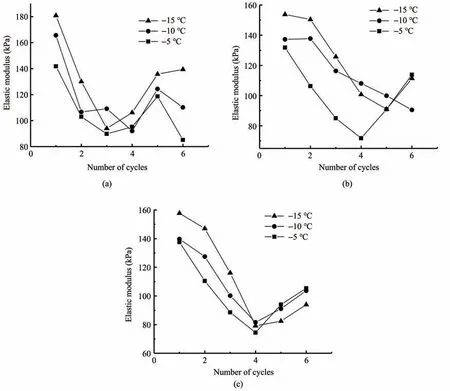
Figure 6 Variation of elastic modulus under thawing temperature of 6°C and various freezing temperatures and confining pressures.(a)Confining pressure of 20 kPa;(b)Confining pressure of 50 kPa;(c)Confining pressure of 80 kPa
From Figure 6a,b and 6c,one can see that under the same confining pressure,the lower the freezing temperature,the greater the peak strength of soil sam‐ples is.However,the soil elastic modulus reduction shows the opposite trend,namely,the lower the freez‐ing temperature,the faster the elastic modulus de‐creases.According to Figure 4,when the soil mois‐ture content is constant,the change in the freezing temperature affects not only the ice content and cryo‐structure of the frozen soil sample but also the soil freezing rate and the amount of water migration dur‐ing freezing.Since ice content controls the cementa‐tion of soil particles,the soil samples with a low freez‐ing temperature have high initial strength.However,with the increase in sample temperature as the test progresses,pore ice melts,and the soil sample enters an unstable state with four phases,i.e.,soil particles,water,ice,and air,which causes the soil's deformation resistance to drop like a cliff,and the elastic modulus reaches a minimum value in the fourth cycle.At the later stage of the experiment,the ice cementation in the soil sample completely disappears,and the sample enters a stable state with three phases,i.e.,soil parti‐cles,water,and gas,and the elastic modulus increases.
It can be concluded that under all working condi‐tions,the relationship of elastic modulus is as fol‐lows:entirely frozen soil>fully thawed soil>thaw‐ing soil,which indicates that the thawing soil is the most fragile and dangerous.Therefore,it is safer and more reasonable to take the elastic modulus of thaw‐ing soil subgrade as the design reference value for pavement engineering instead of the elastic modulus of subgrade soil under conventional conditions.
4 Energy evolution of thawing soil during cyclic loading
To further explore the evolution of relevant param‐eters of thawing soil,this section examines the energy evolution within thawing soil under the joint action of spring thawing and cyclic loading of vehicles.Figure 7 illustrates a typical hysteretic loop during the load‐ing and unloading stages.
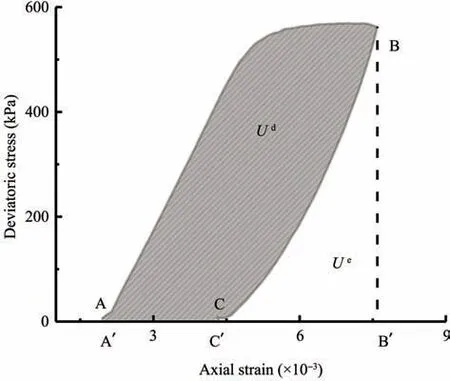
Figure 7 Typical hysteresis loop curve
As shown in Figure 7,in a loading and unloading cycle,the upper and lower extreme points in the load‐ing phase are B and A,respectively,the lower ex‐treme point in the unloading phase is C,and the pro‐jections of the three extreme points on the abscissa ax‐is are B′,A′and C′,respectively.During the loading stage from A to B,the stress increases with increasing strain,and the indenter of the testing machine does positive work on the sample.After reaching the upper limit stress(B),the stress(load)decreases until C,the sample releases elastic deformation energy,and the in‐denter of the testing machine does negative work on the sample.In the past analyses,the hysteretic loop is often treated as closed approximately;that is,the curve A B Cis regarded as a closed area.
Based on Figure 7,the energy parameters that should be considered in detail during energy analysis and calculation of cyclic loading include:
(1)The area enclosed by the loading curve A B and the abscissa(approximate trapezoid A'B'B A)is the total work U of the testing machine on the sample.
(2)The area enclosed by the unloading curve B C and the abscissa(the blank part in the total work)is the released elastic deformation energy Ue.
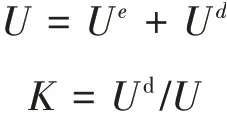
(3)The dissipated energy Udcan be expressed as the total work U done by the testing machine minus the elastic deformation energy Ueof the sample,that is,the area between the loading and unloading curves(shaded part in the figure).
(4)To examine the proportion of dissipated ener‐gy within a single cycle more intuitively,the energy dissipation rate,K=dissipated energy/total work,is introduced.
The calculation formulas of related energy param‐eters are as follows:
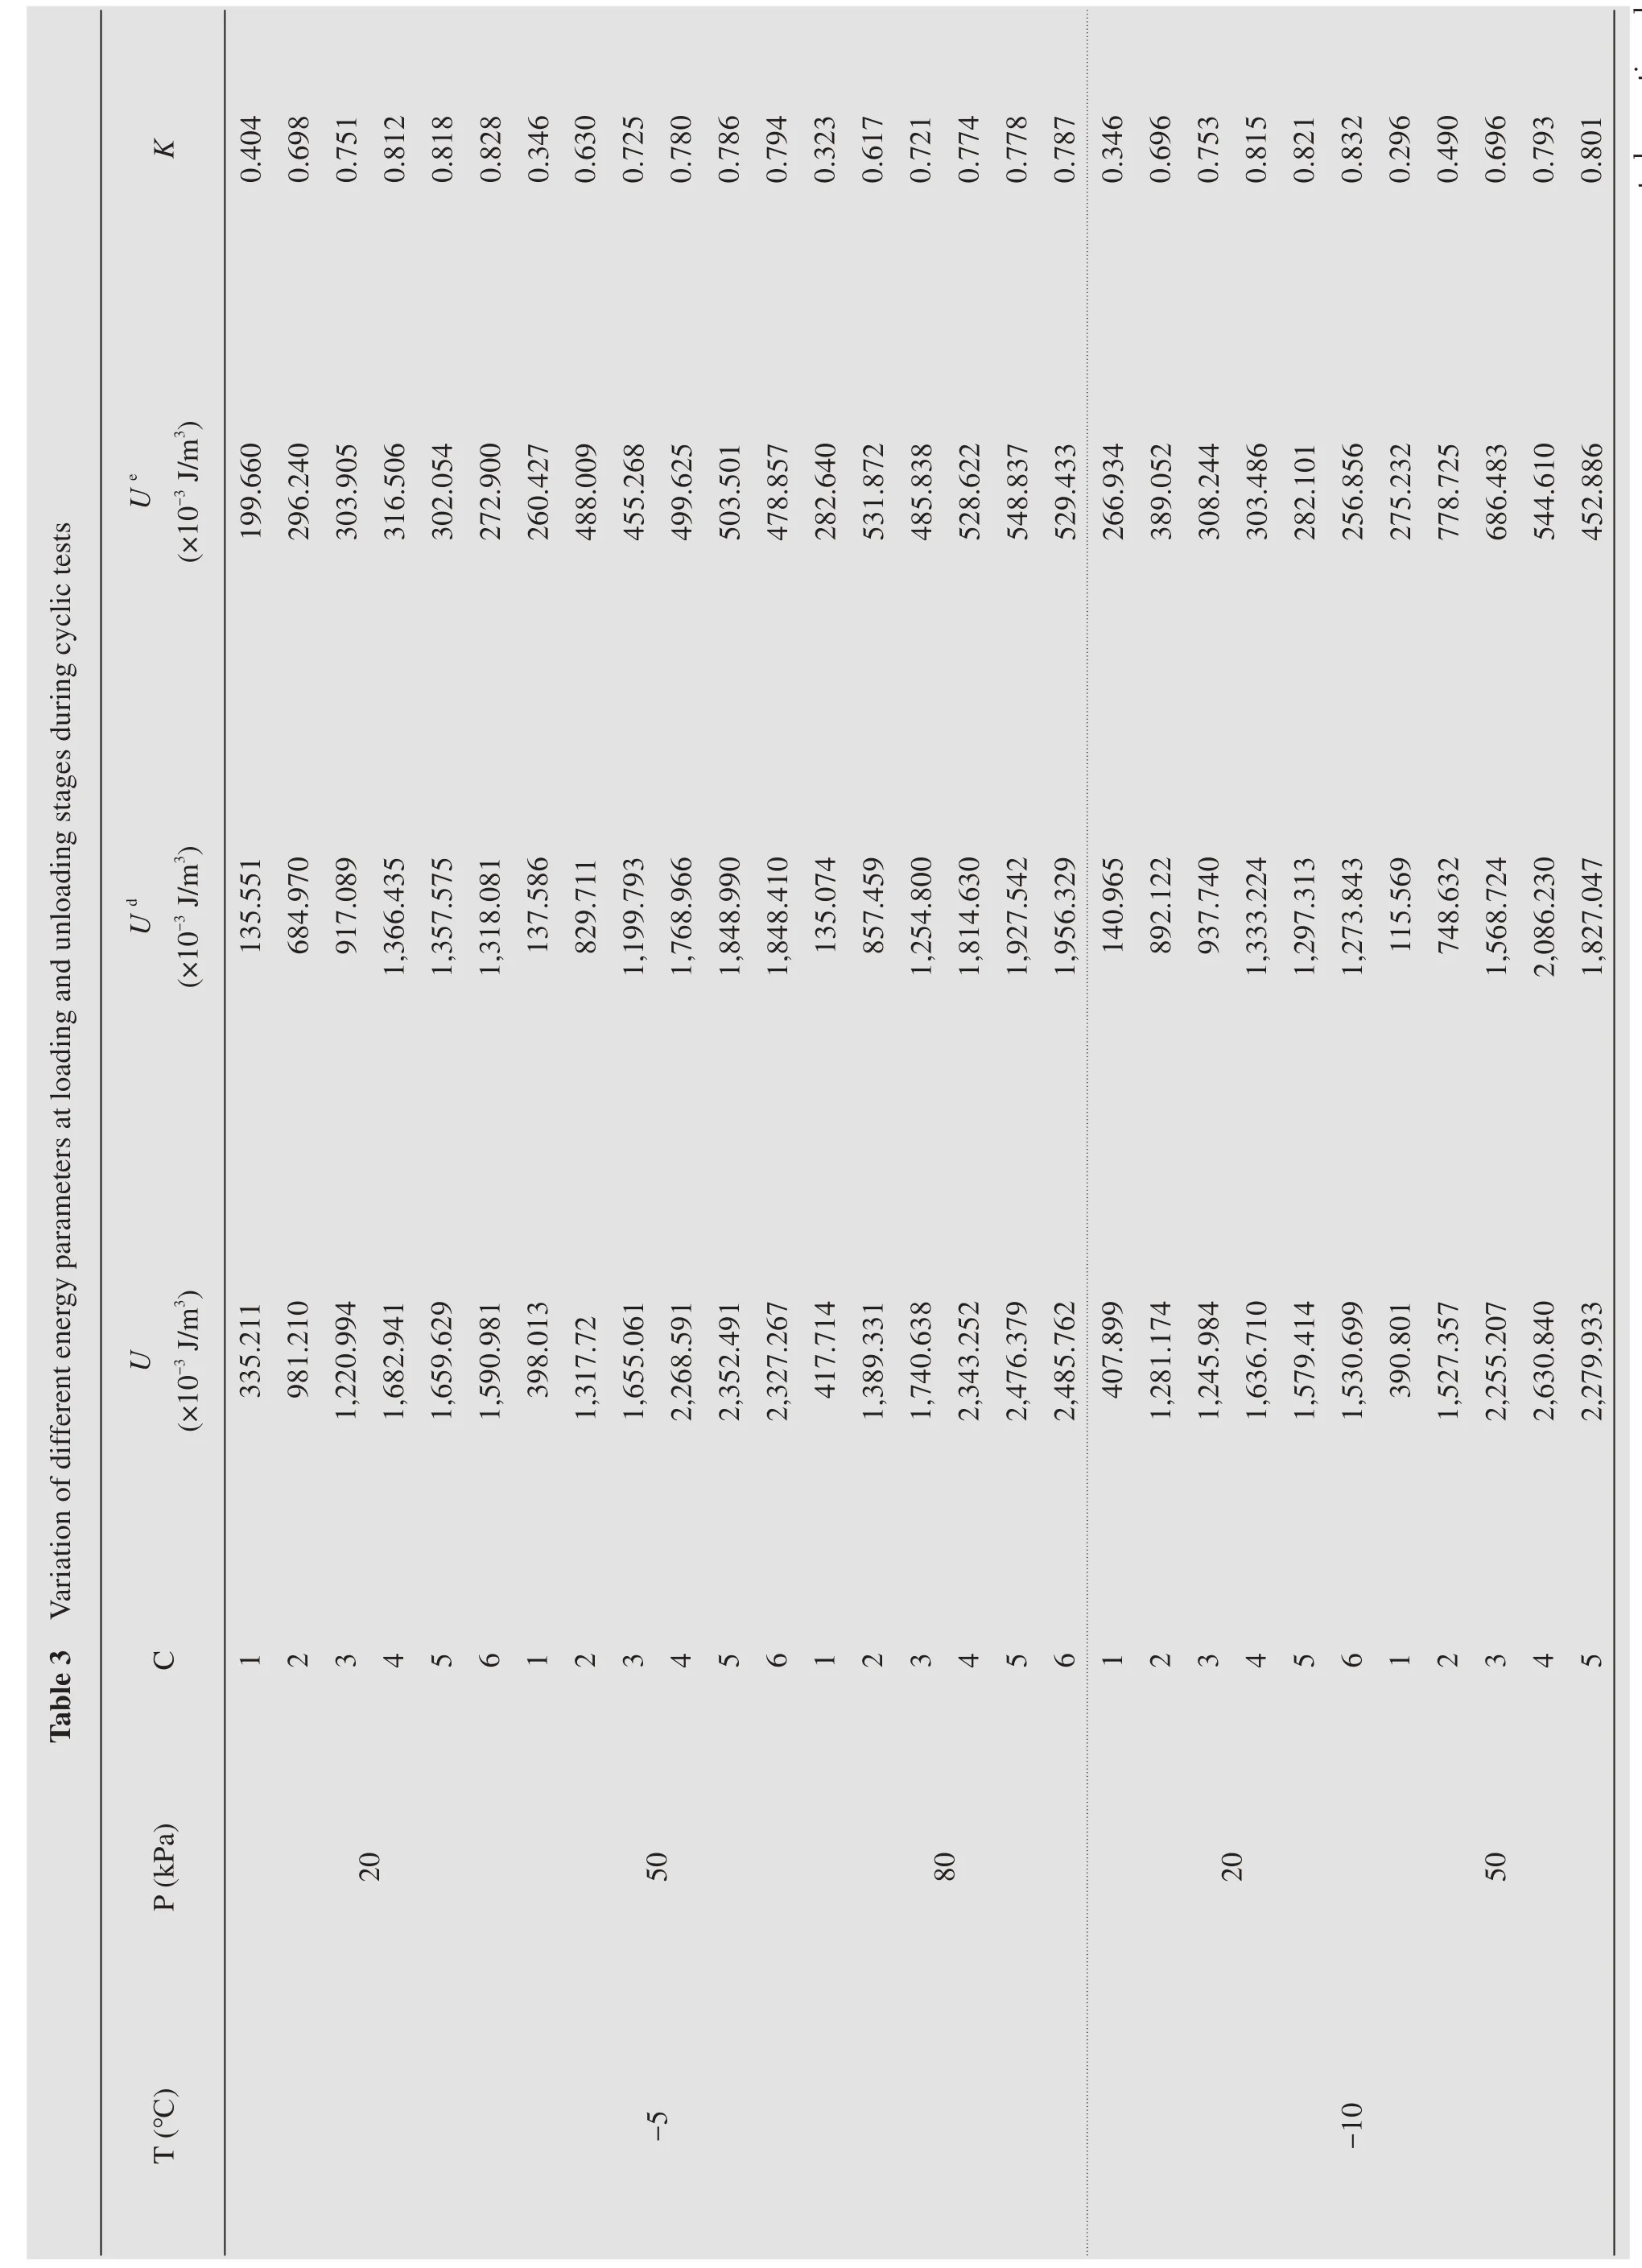
Based on this,the test data are statistically ana‐lyzed,as shown in Table 3.
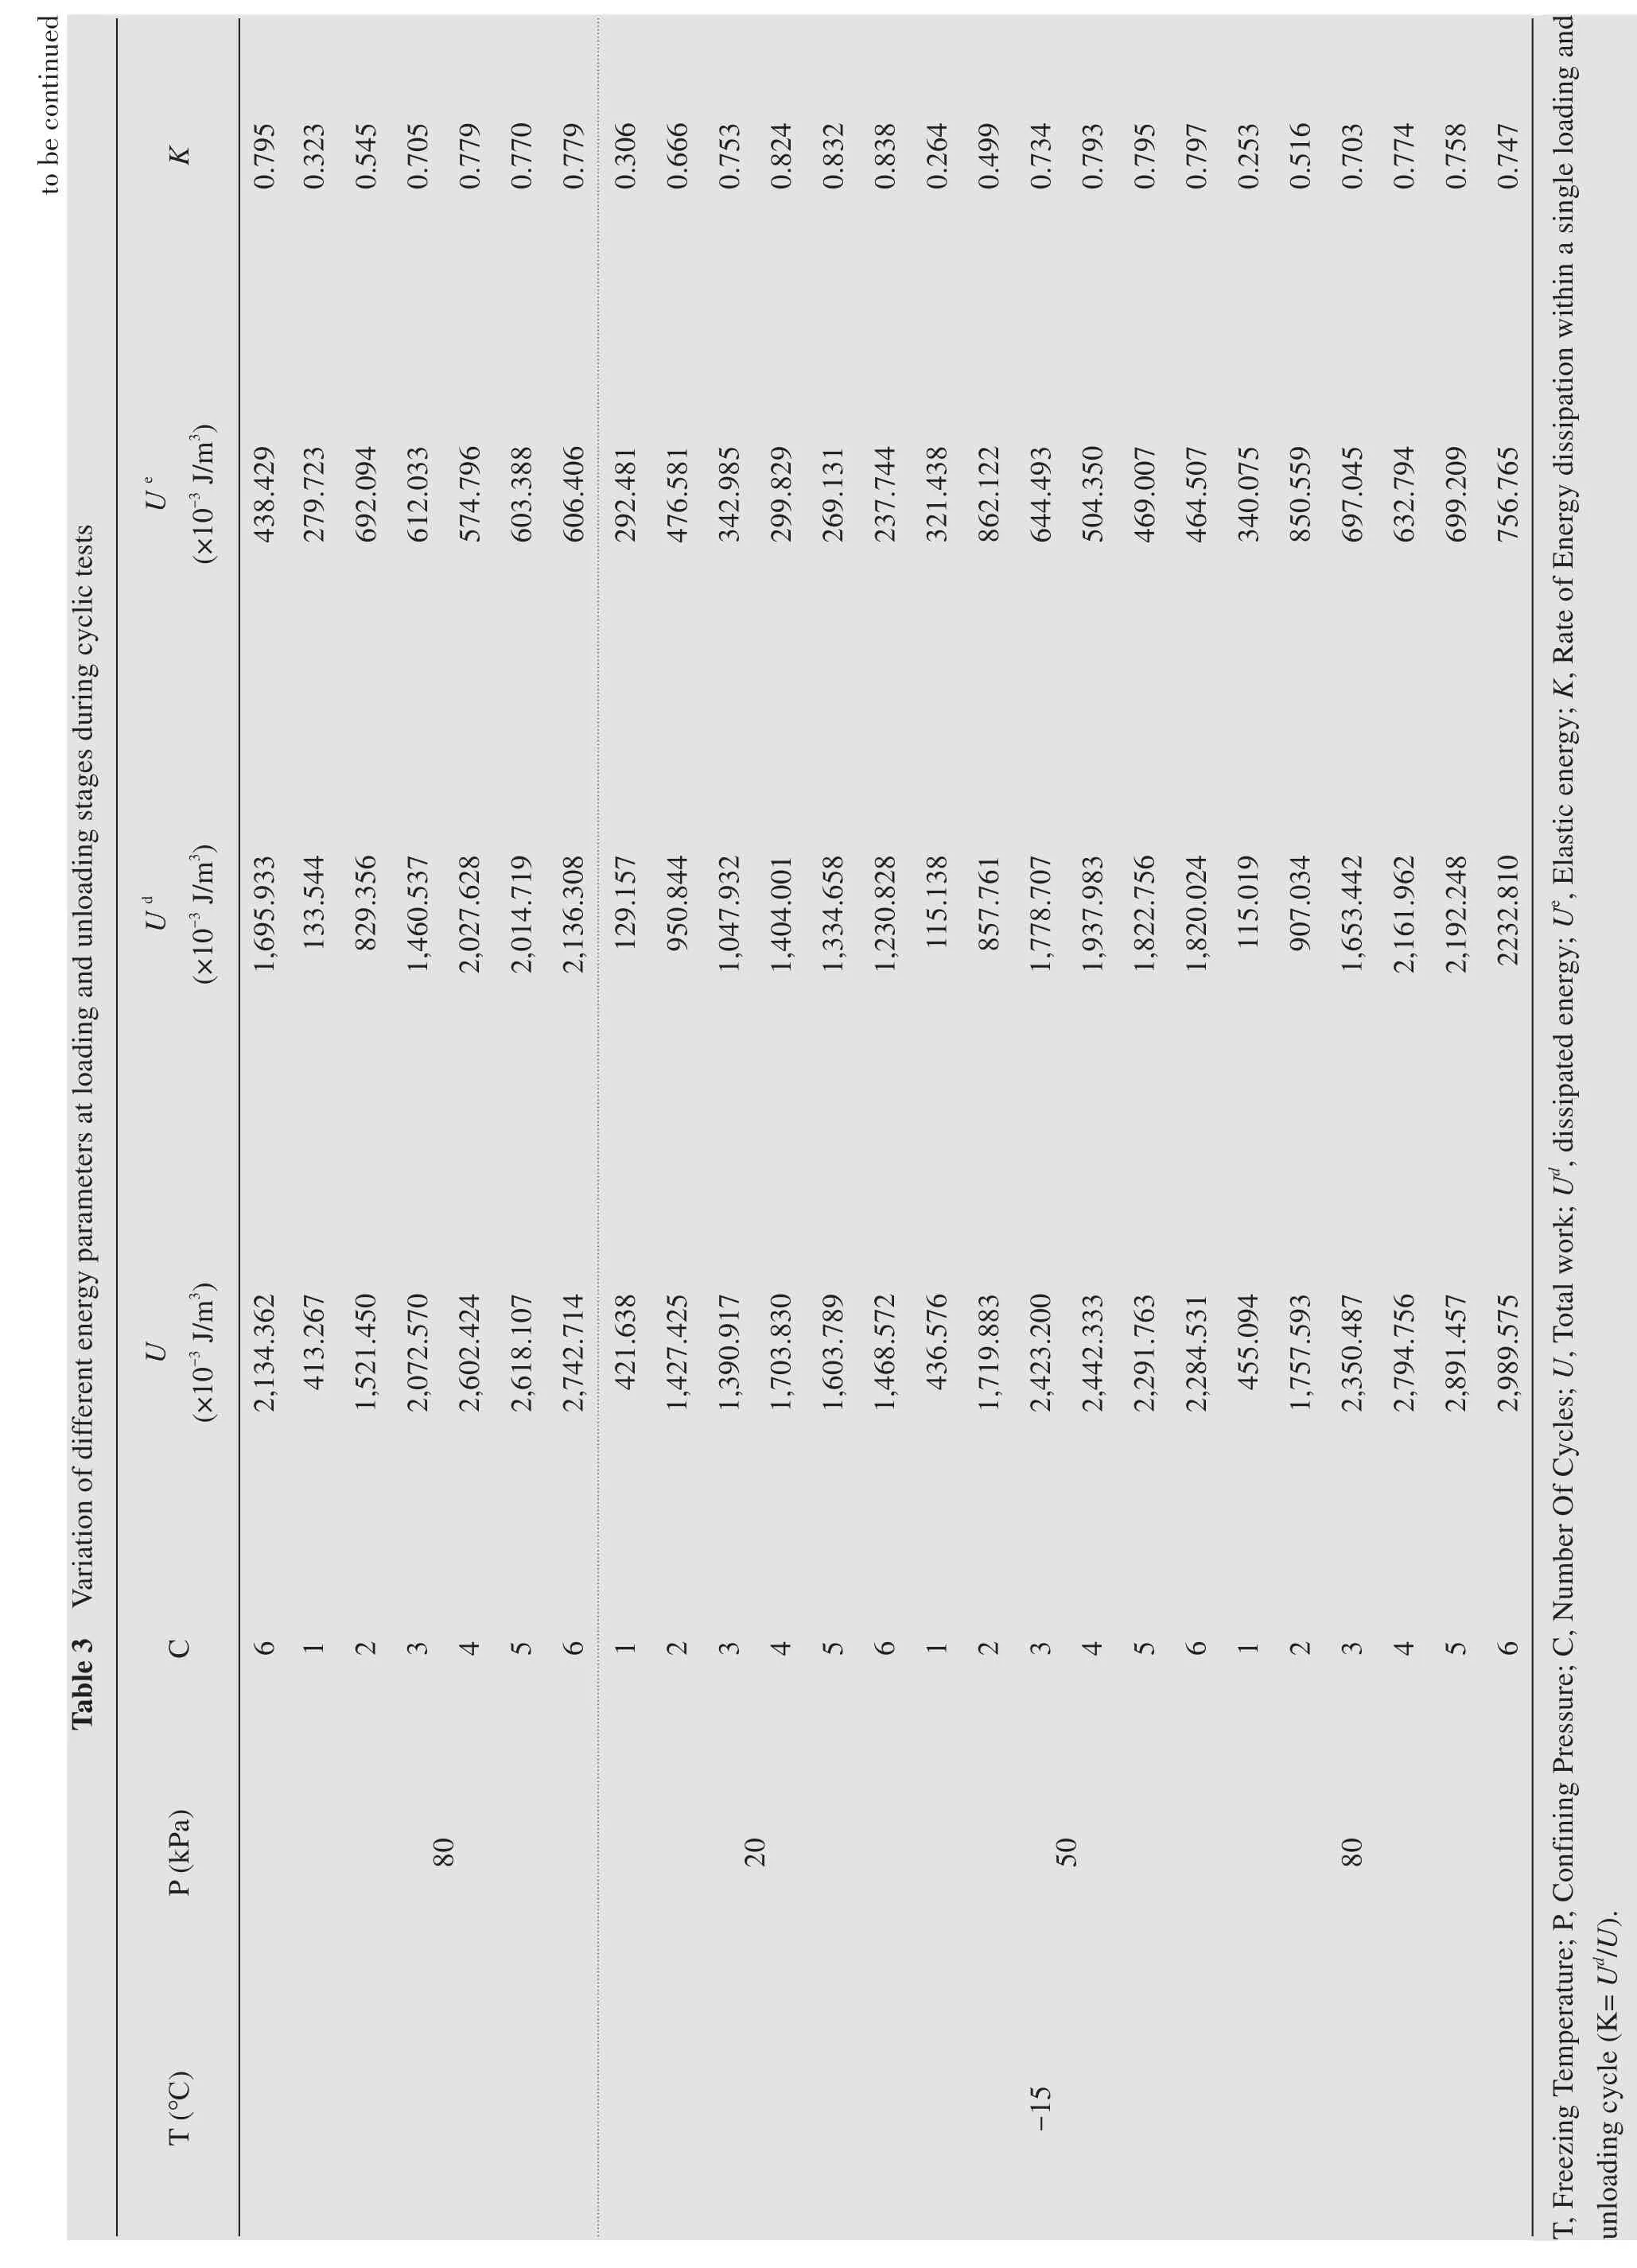
In addition,to more clearly express the change rule of each variable,the variation in U,Ue,Ud,and K with thenumber of loading cyclesare illustrated in Figure8.
Combined with Table 3 and Figure 8,it can be seen that:
In addition,to more clearly express the change rule of each variable,the variation in U,Ue,Ud,and K with the number of loading cycles are illustrated in Figure 8.
Combined with Table 3 and Figure 8,it can be seen that:
(1)As the sample is thawing,the total work done by the testing machine during the repeated loading and un‐loading processes increases first and then tends to stabi‐lize with the increase in the number of cycles and axial strain.Figure 8b shows that the trend of dissipated ener‐gy with the number of cycles is consistent with that of the total work.Also,the testing machine does more work on the sample with low freezing temperature and high confining pressure,which also has higher dissipat‐ed energy generated by plastic deformation.This result indicates that the soil particles with pore ice cementa‐tion in the early test stage absorb most of the energy during loading,and thisenergy isreleased with themelt‐ing of the poreice as the sample temperature rises.
?
?
(2)As can be seen from Figure 8c,during re‐peated loading and unloading,the energy released due to elastic deformation under the same confining pressure will approach a certain stable value.How‐ever,for the soil sample with low freezing tempera‐ture,the ice content of the sample is high.Assum‐ing that the ice and water are incompressible,the ice crystals in the initially frozen sample absorb 50%of the elastic deformation energy and,thus,re‐lease higher elastic deformation energy,which grad‐ually weakens and disappears with the thawing of the sample.
(3)The energy dissipation rate can directly reflect the state of the sample.If the energy dissipation rate gradually increases,it means that the sample is transi‐tioning from the elastic state to the plastic state.This process will continue until the dissipation rate pla‐teaus,meaning that the sample enters a perfect plastic state until it is destroyed.Therefore,it can be seen from Figure 8d that the energy dissipation rate curve can be used to roughly judge the bearing state and pre‐dict the failure mode of the soil sample.
Figure 8 Relationshipsbetween energy parameters and number of cycles
5 Conclusions
(1)The strength of a single stress cycle in repeat‐ed loading and unloading processes of thawing silty clay is analyzed.It is concluded that cementation ice provides a high soil strength in the initial test stage.Af‐ter the cementation ice melts completely,its strength decreasesto 71.4%-95.5%of the initial strength.
(2)It can be seen from the evolution of the elastic modulus during cyclic loading of thawing soil under various working conditions that the soil elastic modu‐lus first drops from the peak value in the initially fro‐zen state to the minimum value of the semi-thawed state,and then rises to a certain extent due to consoli‐dation of the fully thawed soil,with the increase ranging 10.6%to 32.1%of the peak value.
(3)Through the energy analysis during repeated loading and unloading of thawing soil,it is conclud‐ed that from the fourth cycle,the energy evolution curve tends to stabilize,and the energy dissipation ratio plateaus to a certain value.It indicates that the sample has completed the transition from an elastic state to a plastic one,and the soil state can be judged,and the failure can be predicted in the pro‐cess of energy calculation.
(4)Finally,considering the elastic modulus and energy evolution trends during repeated loading and unloading,one can see that the elastic modulus of thawing soil in the fourth cycle is the lowest,indicat‐ing that the thawing soil is the most dangerous.There‐fore,the author thinks that the elastic modulus of soil sample in a thawing state is more suitable for practi‐cal engineering in seasonally frozen soil areas.
 Sciences in Cold and Arid Regions2021年5期
- Sciences in Cold and Arid Regions的其它文章
- Study on mechanical properties of soil-rock mixture of various compactness subjected to freeze-thaw cycles
- Impact of brine on physical properties of saline soils
- Study on thermal-state variation of high-grade highway embankment under different pavement conditions
- Field monitoring of differential frost heave in widened highway subgrade
- Numerical simulation of electroosmosis in unsaturated compacted clay
- Study on tensile damage characteristicsof sandstone under freeze-thaw cycles