Can the computed tomography texture analysis of colorectal liver metastases predict the response to first-line cytotoxic chemotherapy?
2022-02-12 09:41:16EtienneRabeDaniaCioniLauraBagliettoMarcoForniliMichelaGabelloniEmanueleNeri
World Journal of Hepatology 2022年1期
Etienne Rabe, Dania Cioni, Laura Baglietto, Marco Fornili, Michela Gabelloni, Emanuele Neri
Etienne Rabe, Dania Cioni, Michela Gabelloni, Emanuele Neri, Academic Radiology, Master in Oncologic Imaging, Department of Translational Research, University of Pisa, Pisa 56126, Italy
Etienne Rabe, Bay Radiology-Cancercare Oncology Centre, Bay Radiology, Port Elizabeth 6001, Eastern Cape, South Africa
Laura Baglietto, Marco Fornili, Department of Clinical and Experimental Medicine, University of Pisa, Pisa 56126, Italy
Abstract BACKGROUND Artificial intelligence in radiology has the potential to assist with the diagnosis, prognostication and therapeutic response prediction of various cancers.A few studies have reported that texture analysis can be helpful in predicting the response to chemotherapy for colorectal liver metastases, however, the results have varied.Necrotic metastases were not clearly excluded in these studies and in most studies the full range of texture analysis features were not evaluated.This study was designed to determine if the computed tomography (CT) texture analysis results of non-necrotic colorectal liver metastases differ from previous reports.A larger range of texture features were also evaluated to identify potential new biomarkers.AIM To identify potential new imaging biomarkers with CT texture analysis which can predict the response to first-line cytotoxic chemotherapy in non-necrotic colorectal liver metastases (CRLMs).METHODS Patients who presented with CRLMs from 2012 to 2020 were retrospectively selected on the institutional radiology information system of our private radiology practice.The inclusion criteria were non-necrotic CRLMs with a minimum size of 10 mm (diagnosed on archived 1.25 mm portal venous phase CT scans) which were treated with standard first-line cytotoxic chemotherapy (FOLFOX, FOLFIRI, FOLFOXIRI, CAPE-OX, CAPE-IRI or capecitabine).The final study cohort consisted of 29 patients.The treatment response of the CRLMs was classified according to the RECIST 1.1 criteria.By means of CT texture analysis, various first and second order texture features were extracted from a single nonnecrotic target CRLM in each responding and non-responding patient.Associations between features and response to chemotherapy were assessed by logistic regression models.The prognostic accuracy of selected features was evaluated by using the area under the curve.RESULTS There were 15 responders (partial response) and 14 non-responders (7 stable and 7 with progressive disease).The responders presented with a higher number of CRLMs (P = 0.05).In univariable analysis, eight texture features of the responding CRLMs were associated with treatment response, but due to strong correlations among some of the features, only two features, namely minimum histogram gradient intensity and long run low grey level emphasis, were included in the multiple analysis.The area under the receiver operating characteristic curve of the multiple model was 0.80 (95%CI: 0.64 to 0.96), with a sensitivity of 0.73 (95%CI: 0.48 to 0.89) and a specificity of 0.79 (95%CI: 0.52 to 0.92).CONCLUSION Eight first and second order texture features, but particularly minimum histogram gradient intensity and long run low grey level emphasis are significantly correlated with treatment response in non-necrotic CRLMs.
Key Words: Colorectal cancer; Liver metastases; Radiomics; Computed tomography texture analysis; Response assessment
INTRODUCTION
Colorectal cancer (CRC) is one of the most common malignant tumors.According to the global burden of cancer worldwide using the GLOBOCAN 2018, it was estimated that colorectal cancer was the fourth most common cancer and second leading cause of cancer related deaths[1].
The liver is the most frequent site of metastatic disease[1] and approximately 20%-25% of the patients with CRC will have synchronous liver metastases at the time of diagnosis and at least another 60% of patients who develop metastatic disease will have metachronous liver-confined metastases[2].
Unfortunately, approximately half of the patients with colorectal cancer have no treatment response or develop disease progression despite first-line chemotherapy[3].Since the introduction of targeted therapies (e.g., bevacizumab and cetuximab) there has been an increase in the progression-free and overall survival rates in several clinical studies with the median overall survival exceeding 2 years[4-6].
Oncologists monitor their patients closely with regard to their clinical course, performance status and laboratory tests (for instance liver function tests and tumor marker levels) to determine if their patients with cancer are responding to the chemotherapy or potentially progressing.It will be greatly beneficial to the oncologists if we could identify effective predictive biomarkers on the baseline imaging examination which can estimate the response which can be expected during chemotherapy in order to individualize treatment (precision medicine).These imaging biomarkers may prompt the oncologists to perform earlier follow-up imaging studies to determine whether an alternative chemotherapy treatment should be considered.
The Response Evaluation Criteria in Solid Tumors (RECIST 1.1) is typically and mainly used to assess the response to chemotherapy and measures and classifies the changes in the longest axial tumor diameters[7].Due to the irregular shapes of tumors these size measurements may, however, not be representative of the true tumor volume.Moreover, the correlation between RECIST and the pathological response is known to be limited[8-9].
Radiomics is a rapidly growing field of radiological research where routine patient scans are converted into mineable quantitative data[10] that can be utilized to decode the tumor phenotype for applications ranging from improved diagnostics to prognostication to therapeutic response prediction[11].In radiomics, computed tomography (CT) texture analysis quantifies tissue heterogeneity by assessing the distribution of grey-levels, texture coarseness and irregularity within a lesion[12-15].Studies on different tumors have shown that CT texture analysis has promise in predicting pathological features, overall survival and response to therapy[15-17].In the last few years a few studies have also reported that texture analysis can be helpful in predicting the response to chemotherapy for colorectal liver metastases (CRLMs)[18-22].Thus far the CT texture analysis results of responding CRLMs in studies have been heterogeneous which can be secondary to many technical factors.In none of the aforementioned studies were necrotic metastases clearly excluded.The contrast injection protocols were not standardized or defined in all the studies.The CT slice thickness varied between 2 mm and 5 mm in the different studies and some studies combined CT scans with different slice thickness reconstructions for texture analysis.A thicker slice thickness can lead to partial volume effects which can affect the accuracy of the texture analysis results.In most of the studies predominately first order CT texture features were assessed and only a few studies included some second order texture features (predominantly grey level co-occurrence matrix features).
The purpose of this retrospective explorative study is to identify potential new imaging biomarkers by assessing a larger range of first and second order texture features with CT texture analysis which can predict the response to first-line cytotoxic chemotherapy in non-necrotic CRLMs and to compare the results with the findings from previous studies.
MATERIALS AND METHODS
Study design
This retrospective study was approved by the BLINDED Ethics Committee and was conducted in accordance with the ethical standards of the Declaration of Helsinki.Patient informed consent was waived.
The study population was selected in a consecutive retrospective manner by using the ICD-10 codes (International Classification of Diseases and Related Health Problems, 10threvision) for CRC to identify all patients on the institutional radiology information system (RIS) of our private radiology practice for the period of March 2012 to May 2020.All the CT scans were performed at one of the branches of our radiology practice in our demographic region.
The inclusion criteria were histopathological confirmed colorectal cancer with synchronous (diagnosed within 6 mo of primary CRC) or metachronous liver metastases; portal venous phase CT scans with archived slice thickness of 1.25 mm; hepatic metastasis minimum size of 10 mm; one of the following standard first-line chemotherapy regimens: FOLFOX, FOLFIRI, CAPE-OX, CAPE-IRI, FOLFOXIRI or capecitabine.
The exclusion criteria included absent baseline CT scan; poor quality portal venous phase CT scan due to inadequate contrast enhancement or artefacts; hepatic metastasis size less than 10 mm; metastases with clear necrosis or calcifications; fatty liver or other chronic liver pathology; previous chemotherapy; first-line chemotherapy combined with targeted or other therapy; more than 2 mo delay between baseline CT scan and start of chemotherapy; more than 7 mo delay since onset of first line chemotherapy and follow-up CT scans; no follow-up CT scan after chemotherapy; previous liver surgery or surgery/radiofrequency ablation after chemotherapy; mucinous colon carcinoma; history of previous or other coexisting malignancies.The final study cohort consisted of 29 patients.
Data
The following clinical and pathological information was collected from our RIS and patient medical records: patient demographics (age at diagnosis, date of diagnosis, gender); original CRC histology and grade of primary CRC; Kirsten rat sarcoma viral oncogene homolog (KRAS) mutation status (mutant or wild-type), if available; TNM staging of CRC; CEA and CA19-9 tumor marker levels around the time of baseline CT scan; details of first-line chemotherapy.
First-line chemotherapy regimens
All the patients received one of the following cytotoxic chemotherapeutic substances according to the National Comprehensive Cancer Network clinical guidelines in oncology: FOLFOX (intravenous (IV) 5-FU, leucovorin and oxaliplatin), FOLFIRI (IV 5-FU, leucovorin and irinotecan), FOLFOXIRI (IV 5-FU, leucovorin, oxaliplatin, and irinotecan), CAPE-OX (oral capecitabine and oxaliplatin), CAPE-IRI (oral capecitabine and irinotecan) and oral capecitabine.None of the study cases received targeted therapy.Chemotherapy was administered until there was radiological evidence of disease progression according to the RECIST 1.1 criteria.
CT acquisition
The CT examination closest to the date of diagnosis of the liver metastases was selected for the radiomics analysis.
All the scans in the study cohort were performed on three different multidetector CT scanners: GE Lightspeed RT16 (n= 16), GE Optima CT540 (n= 11) and GE Discovery IQ (n= 2) (GE healthcare, Milwaukee, WI).The portal venous phase CT scans were used for the radiomics analysis and were acquired as part of either a fourphase (unenhanced, arterial, portal venous, delayed phases,n= 19), a three-phase (unenhanced, arterial, portal venous,n= 8) or biphasic (unenhanced, portal venous,n= 2) contrast enhanced CT examination.The CT acquisition parameters of the study cohort are summarized in Table 1.
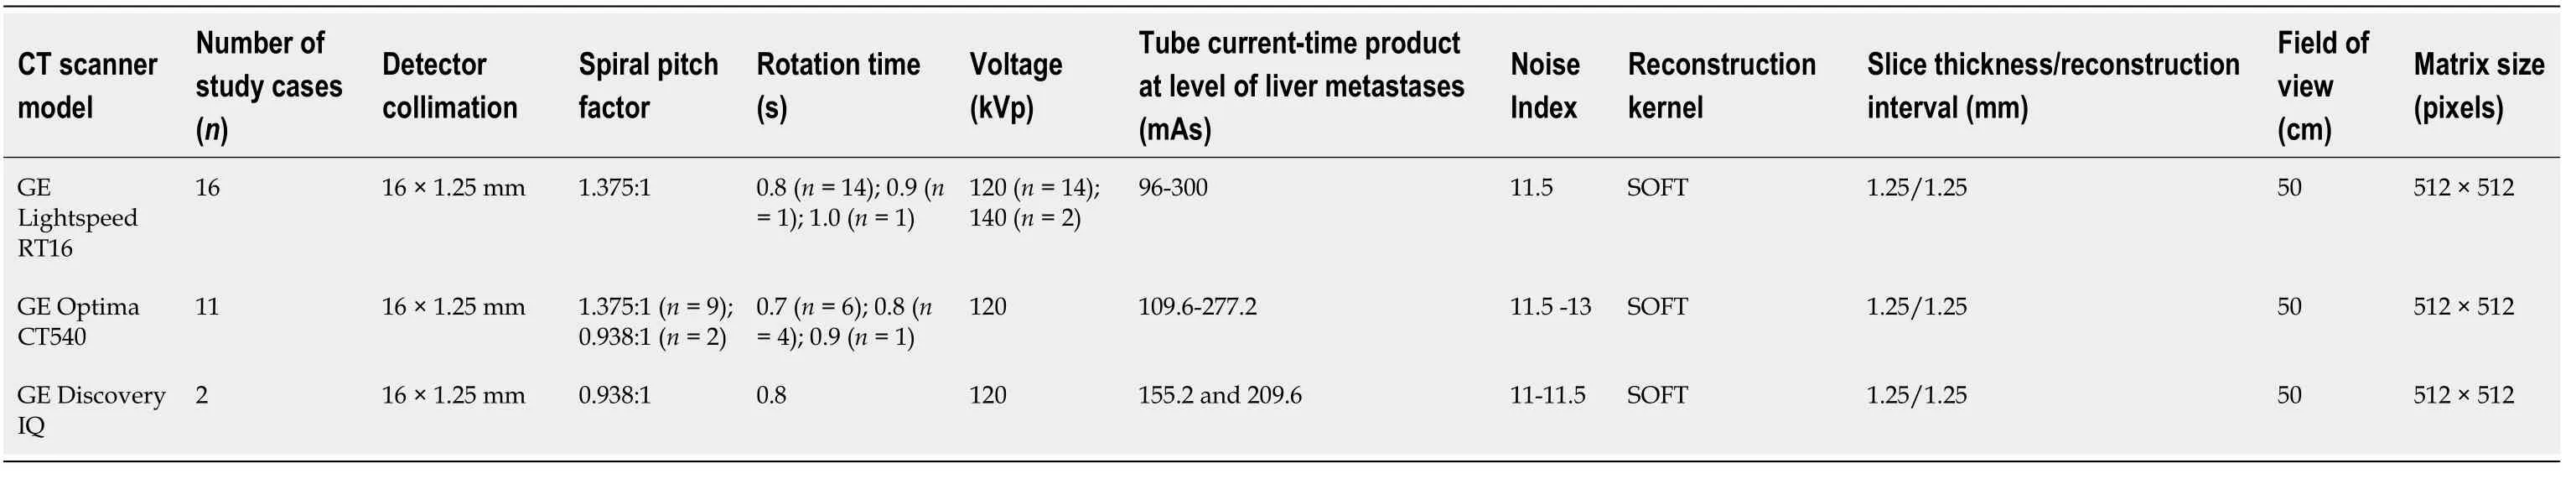
Table 1 Computed tomography acquisition parameters in study cohort
All the patients in the study cohort received intravenously 1.0-1.5 mL/kg of iomeprol 400 mgI/mL (Iomeron 400?, Bracco Diagnostics, Milan, Italy) except for one patient who received intravenously 1.8 mL/kg of ioversol 350 mgI/mL (Optiray PF 350?, Guerbet, Aulnay-sous-Bois, France).Contrast medium was injected at a rate of 2 mL/sec with an automatic power injector and a bolus tracking CT density threshold (SmartPrep?, GE Healthcare) of 100 HU.In the standard CT scan protocol, the portal phase scan is acquired at 80 s.The contrast medium injection was followed by a saline flush of 50-60 mL which was injected at 2 mL/sec.
CRLM segmentation and texture analysis
The texture analysis of the CRLMs was performed with the SOPHiA Radiomics betahepatic-metastasis software (version 2.1.7) of SOPHiA GENETICS.The DICOM images of the baseline 1.25 mm portal venous phase scans were used for the texture analysis.
Prior to feature extraction trilinear voxel size normalization (resampling) was performed to normalize the voxel size to 1 mm × 1 mm × 1 mm.A mean ± three standard deviations (3SD) for intensity rescaling was used.For the basic first order intensity-based features there was no discretization applied.Grey level intensity discretization was performed by using 32 grey levels for the discretized intensitybased features as well as for the second order texture features (fixed bin number of 32).
A 3D semi-automatic technique was used to perform the segmentation of a single target CRLM in each patient.Where the segmentation was inaccurate, the contours were manually edited.In a few cases complete manual segmentation of the CRLMs was required.All the segmentations were performed by the principal investigator (general radiologist with 20 years of CT experience).The major hepatic vessels, edge of the liver and the hypervascular rims which can be associated with some CRLMs(rarely encountered on portal venous phase scans) were excluded from the radiomics analysis.No intra- or inter-observer variation was evaluated.
The radiomics features which were calculated and extracted meet the standards and criteria of the Image Biomarker Standardization Initiative (IBSI)[23].
The radiomics features extracted with SOPHiA Radiomics are listed in Supplementary Table S1.The radiomics features include morphological indicators (27 features), statistics (21 features), local intensity indicators (4 features), intensity histogram indicators (24 features), volume intensity histogram indicators (5 features), grey level co-occurrence matrix texture indicators (26 features), grey level run length matrix (GLRLM) texture indicators (16 features), grey level size zone matrix texture indicators (16 features), grey level distance zone matrix texture indicators (16 features), neighborhood grey tone difference matrix texture indicators (3 features) and neighborhood grey level difference (NGLDM) texture indicators (17 features).
Response evaluation
A single target CRLM without clear necrosis or calcification was analyzed in each patient on the baseline and follow-up CT scan.The RECIST 1.1 criteria were used to assess the response to treatment[7].No non-target liver metastases were included in this study.
The patients in whom the liver metastases demonstrated a complete response (CR) or partial (PR) were classified as responders and the patients with either stable disease (SD) or progressive disease (PD) were classified as non-responders.
Following the technique illustrated by Ahnet al[19], a single target CRLM which demonstrated the best PR or CR (not necessarily the largest lesion) was evaluated in each responder.In each non-responder a single target liver metastasis which demonstrated the worst response to treatment (SD or PD) was segmented.
Independent observer
An independent general radiologist (25 years of experience in CT and oncologic imaging) visually confirmed and validated the selected CRLMs and the accuracy of the segmentations of the volumes of interest of target lesions.Where required, further manual editing was performed and a mutual consensus was reached regarding the final segmentations.
Statistical methods
Categorical variables were described by frequencies and percentages and continuous variables by medians and interquartile ranges (IQRs).Associations between exposures and response to chemotherapy were assessed by non-parametric Fisher’s exact tests and Kruskal-Wallis tests, for categorical and continuous variables respectively.
In order to limit the influence of extreme values, radiomic features were categorized into tertiles and the corresponding pseudo-continuous variables were calculated assigning 1 to the 1sttertile, 2 to the 2ndtertile and 3 to the 3rdtertile.Logistic regression models were fitted to estimate the associations between clinical response and each pseudo-continuous variable and the likelihood ratio test was applied to assess the significance of the association.
Redundant features were identified and excluded based on analysis of correlations.Features statistically significant in the univariable models were included in the multiple model.The performance of the multiple model in predicting response to therapy was assessed by the area under the receiver operating characteristic (ROC) curve (AUC).The best cut-off of the linear predictor was identified as the point on the ROC curve nearest to the point with sensitivity and specificity both equal to 1; the corresponding sensitivity and specificity were estimated.AUC estimate adjusted for optimism was obtained with a validation procedure based on bootstrap resampling[24].A nomogram was built from the multiple model.
All the statistical tests were two-sided with a significance level of 0.05.The analyses were conducted with the statistical softwareRversion 4.0.2, and its packagerms.
RESULTS
Patient characteristics
The CT scans of 236 consecutive patients with CRLMs who presented from March 2012 to May 2020 were retrospectively reviewed.Only 29 patients with CRLMs fulfilled all the inclusion criteria (Figure 1).
The demographic, clinical and tumor characteristics of the patient cohort are summarized in Table 2.Fifteen patients were classified as responders (all with PR) and 14 patients were classified as non-responders (7 SD and 7 PD) (Table 3).The median age at diagnosis was 59 years (IQR: 52 to 73) and 62% of participants were male.
Among the patient characteristics, only the number of CRLMs showed a positive correlation with the response group (P= 0.05, Table 2).Only 2 of the responders presented with oligometastases (≤ 5) in comparison with 8 of the non-responders.The responders presented with significantly more extensive CRLMs (> 5 metastases).
Chemotherapy regimens and follow-up periods
The chemotherapy regimens in the response and non-response group are summarized in Table 3.Both groups received between 3 and 12 cycles of chemotherapy between the baseline and follow-up scan, but the median was 8 cycles in the response group and 6 cycles in the non-response group.The FOLFOXIRI regimen was followed by two of the responders, but none of the non-responders.The time interval between the baseline CT scan and the start of chemotherapy varied between 3 and 51 d in the response group (median 18.0 d) and between 6 and 39 d in the non-response group (median 18.5 d).The interval between the baseline and follow-up CT scan varied between 10.3 and 29.0 wk in the response group (median 20.1 wk) and between 10.9 to 28.3 wk in the non-response group (median 15.8 wk).
Radiomic texture features and response to chemotherapy
In univariable analyses eight radiomic features were significantly associated with chemotherapy response (Table 4 and Supplementary Table 1), namely: Minimum histogram gradient intensity (intensity histogram indicator), skewness and discretized skewness (statistics), volume at intensity fraction 10 (volume intensity histogram indicator), three grey level run length indicators (GLRLM, long run low grey levelemphasis, low grey level run emphasis, short run low grey level emphasis) and low grey level count emphasis (neighboring grey level dependence matrix, NGLDM).Due to strong correlations within two groups of radiomic features (Figure 2), only minimum histogram gradient intensity (tertiles: 21 and 23) and long run low grey level emphasis (tertiles: 0.0086 and 0.0103) were included in the multiple analysis (Table 4).

Table 2 Characteristics of the patients, overall and by response to first-line chemotherapy
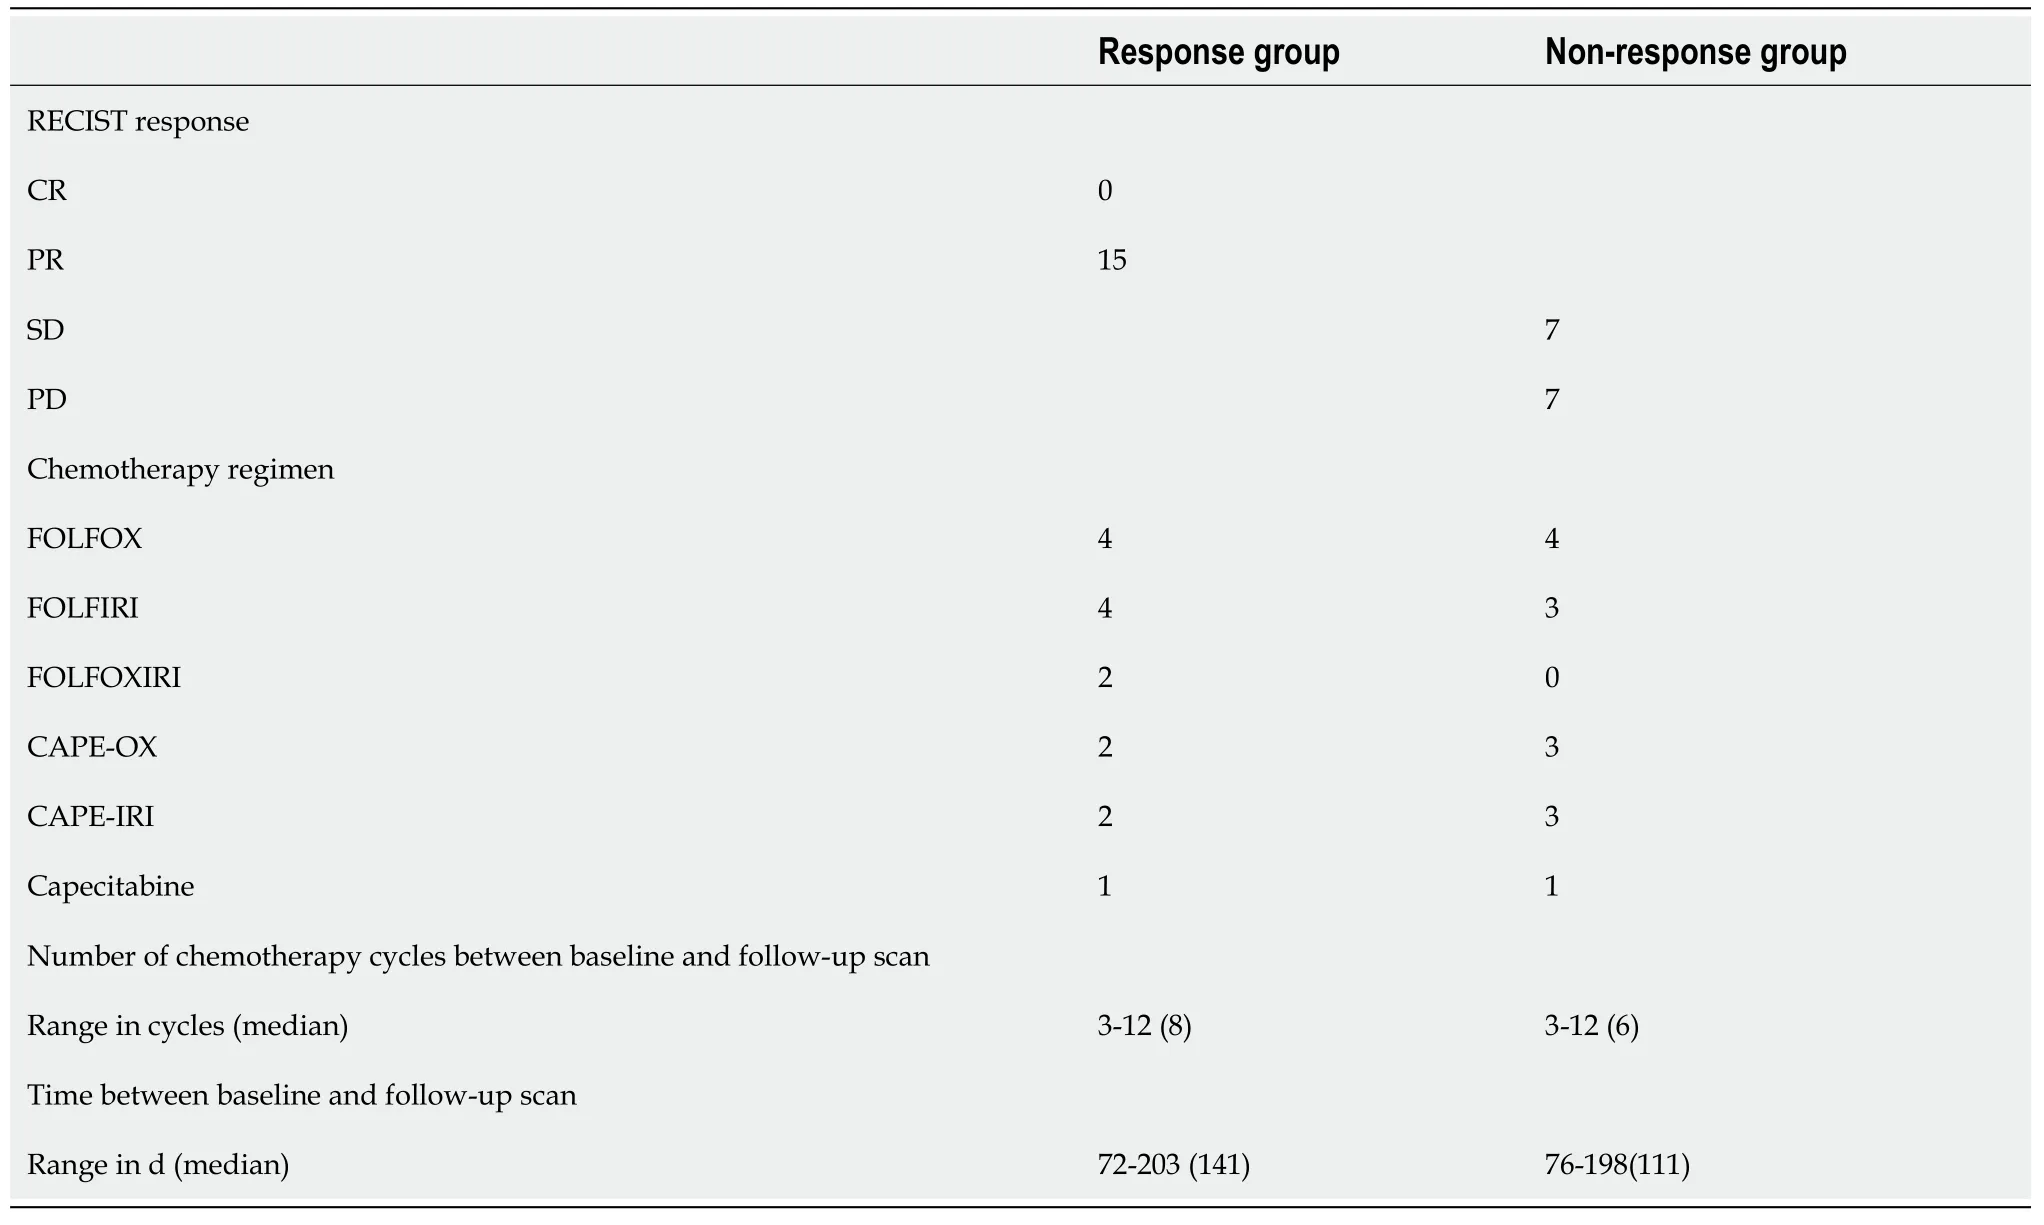
Table 3 Summary of Response Evaluation Criteria in Solid Tumors response and chemotherapy regimes in response and non-response group
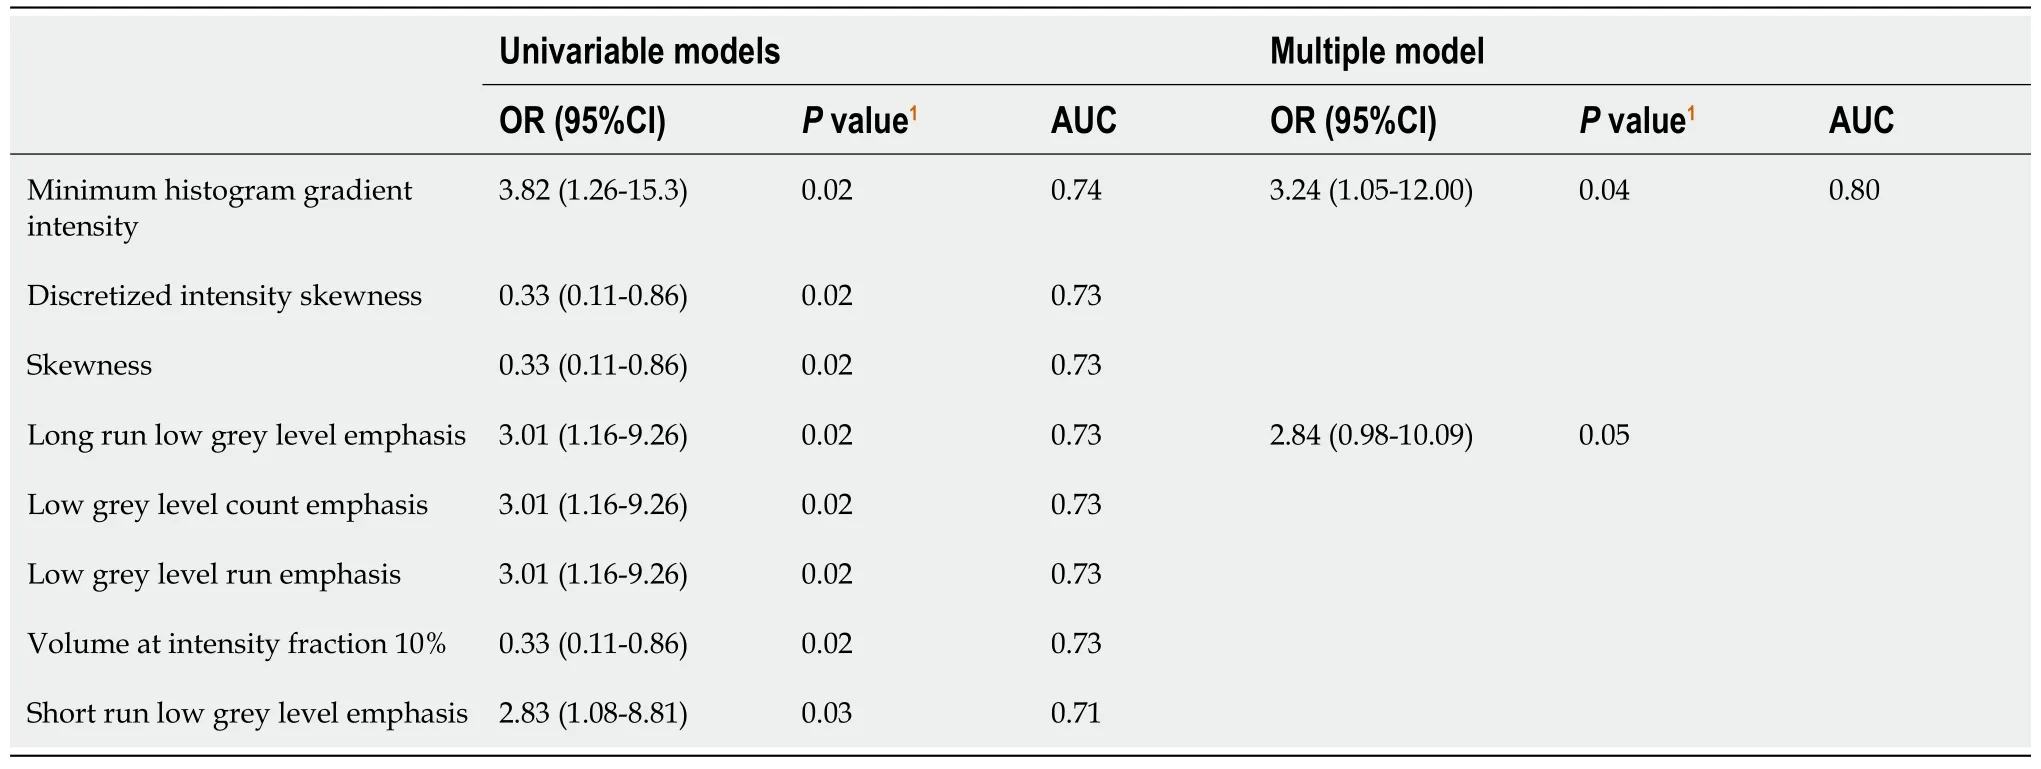
Table 4 Radiomic features associated with response to chemotherapy
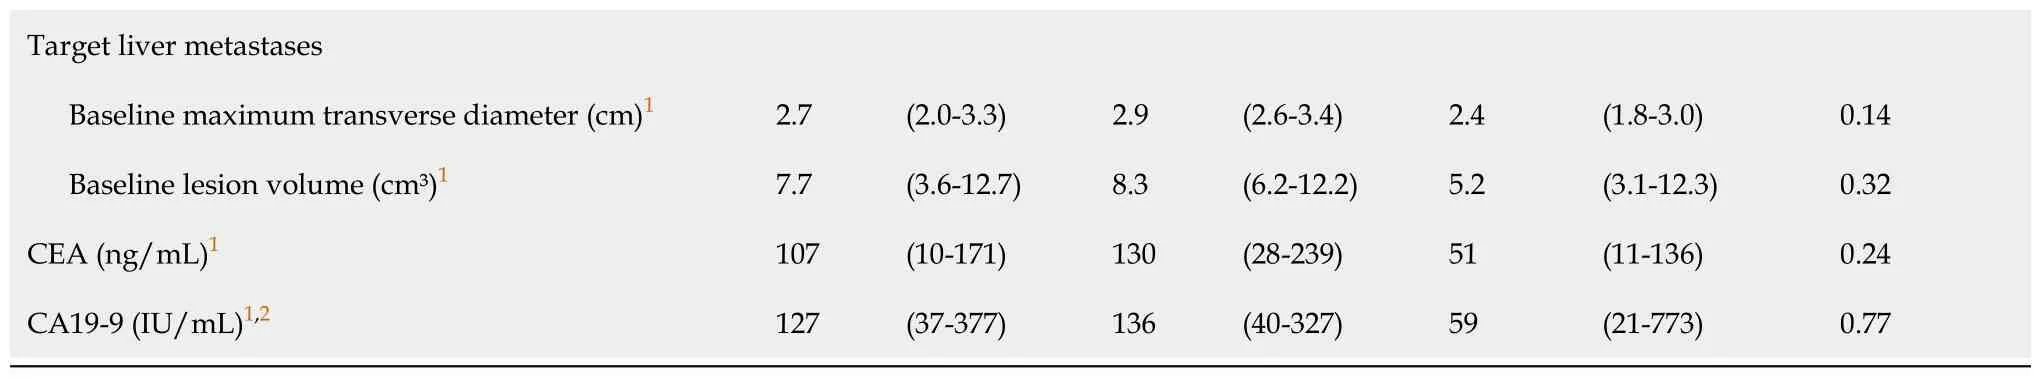
aFisher’s exact test for categorical variables and Kruskal-Wallis test for continuous variables.1Median (interquartile range).2Number of missing data n = 12.CRC: Colorectal cancer; KRAS: Kirsten rat sarcoma viral oncogene homolog; CRLMs: Colorectal liver metastases; CEA: Carcinoembryonic antigen.
The AUC of the multiple model was 0.80 (95%CI: 0.64 to 0.96); the best threshold of the linear predictor was 0.42, corresponding to a sensitivity of 0.73 (95%CI: 0.48 to 0.89) and a specificity of 0.79 (95%CI: 0.52 to 0.92).The optimism-adjusted AUC estimate from bootstrap validation was 0.77.Figure 3 shows the prognostic nomogram resulting from the multiple model together with the empirical distributions of the linear predictor from the best model in the two groups.CT images of a few responding and non-responding CRLMs are shown in Figure 4.
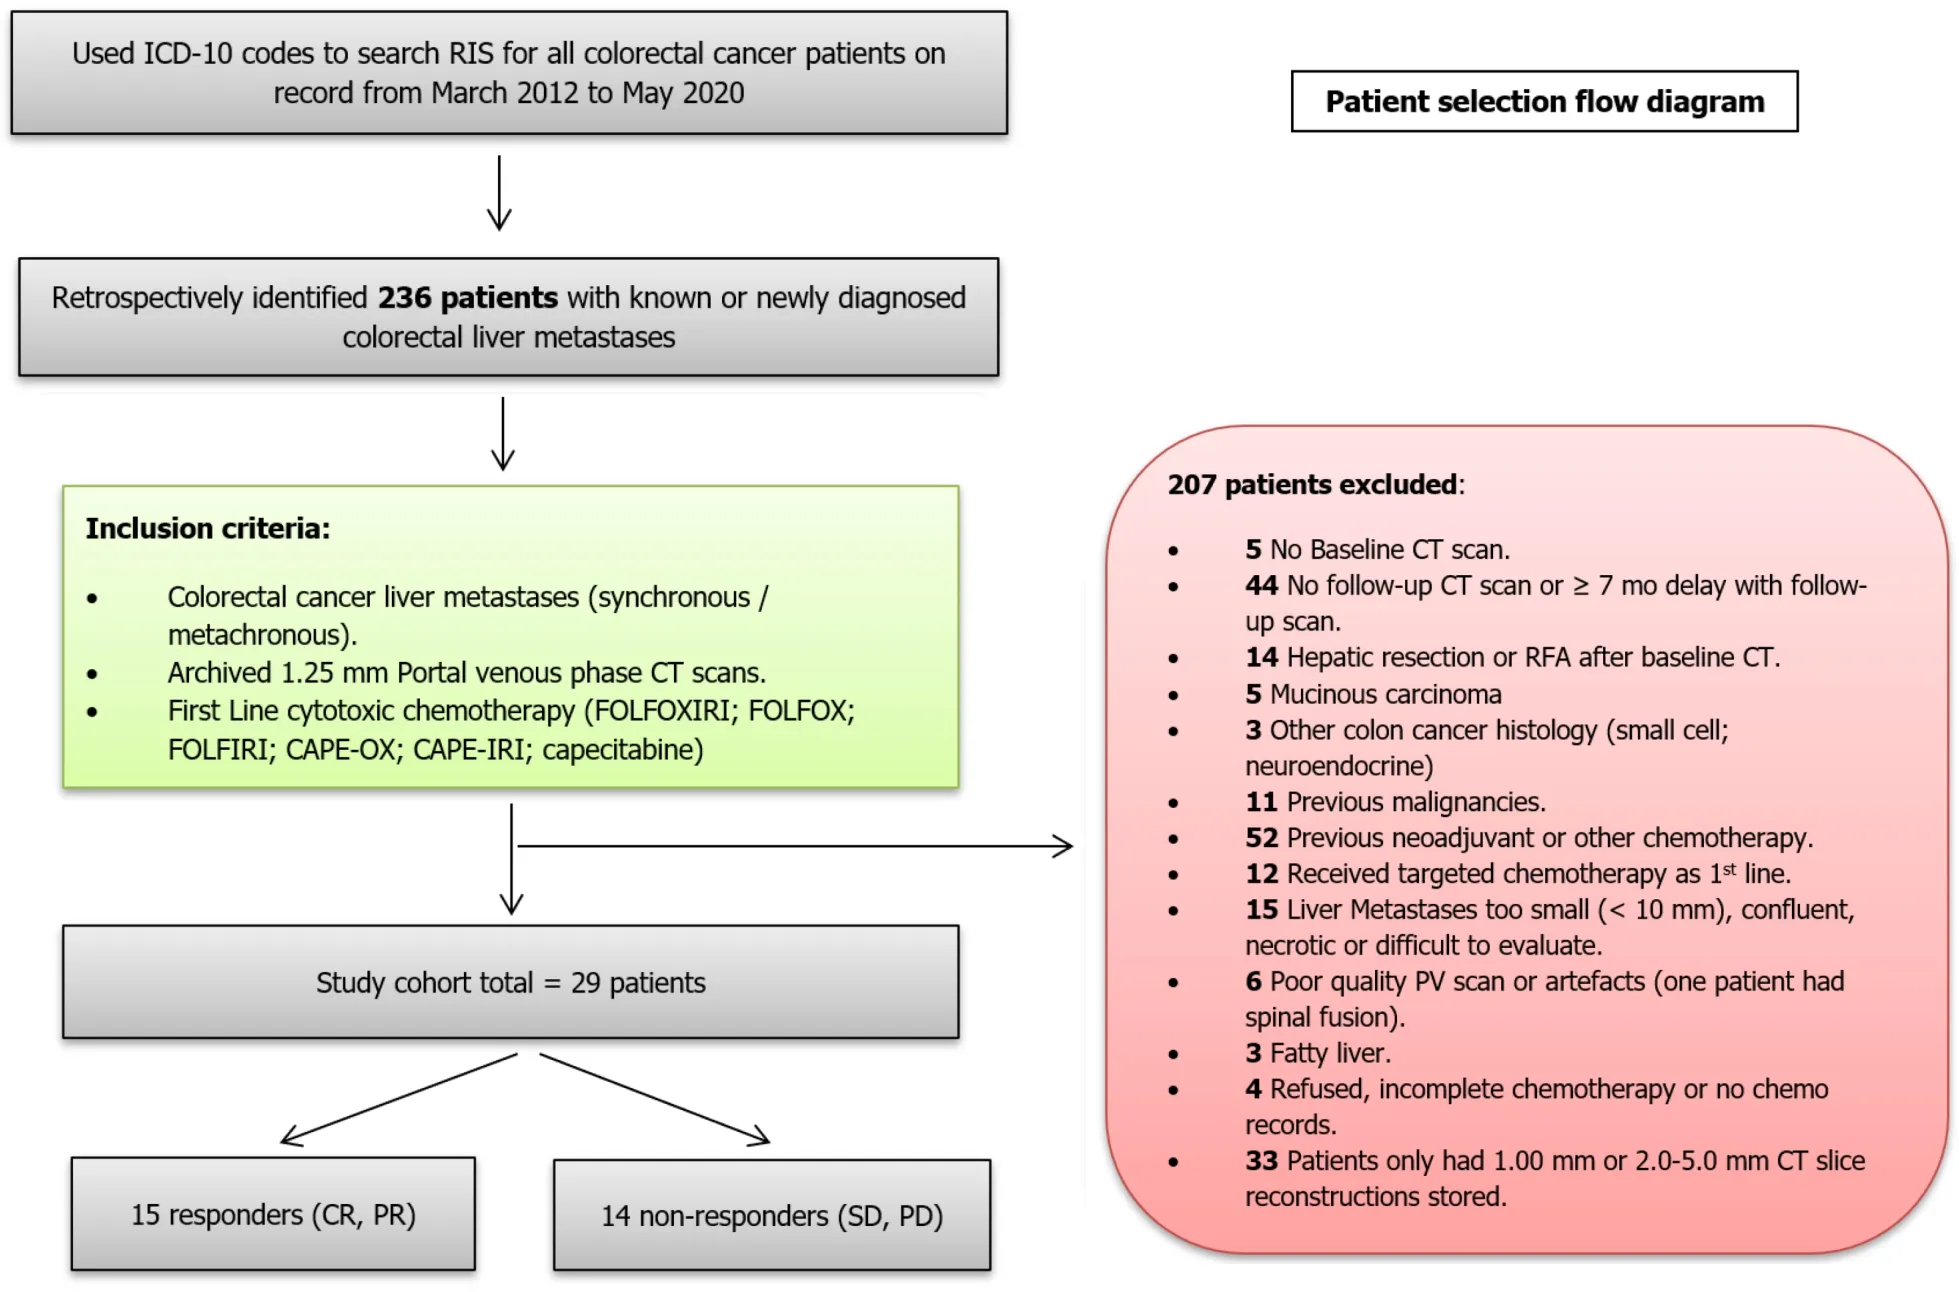
Figure 1 Patient selection flow chart.
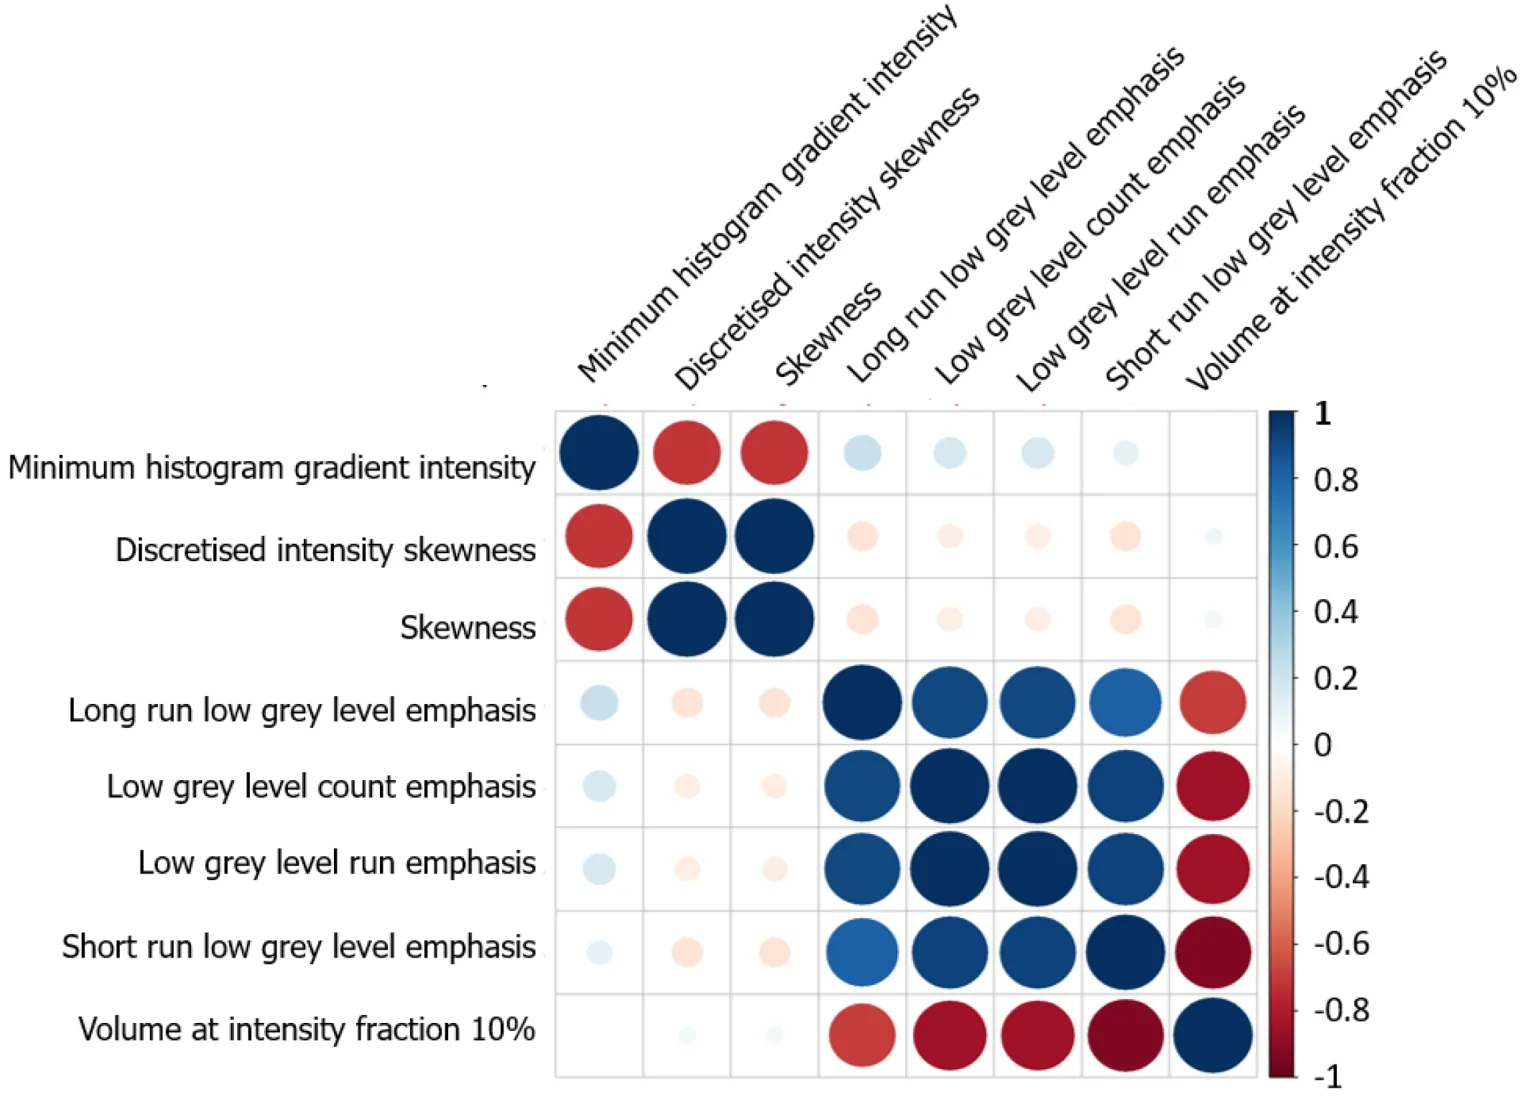
Figure 2 Correlations among radiomic features associated with response.
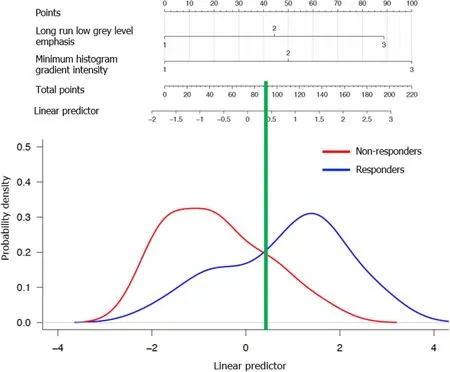
Figure 3 Prognostic nomogram of response to chemotherapy for patients.
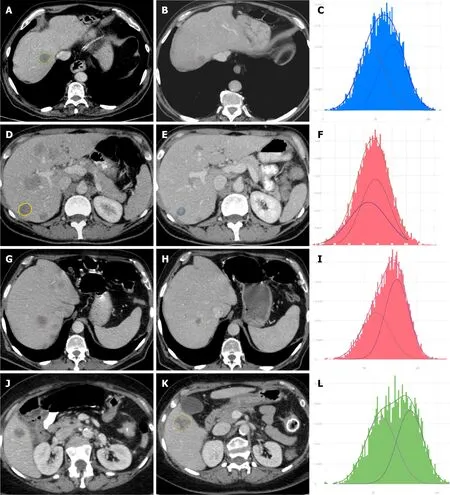
Figure 4 Appearance of typical responding and non-responding liver metastases.
DISCUSSION
The aim of this study was to determine if the pre-treatment CT texture analysis of CRLMs can predict the response to first-line cytotoxic chemotherapy with the RECIST1.1 criteria as gold standard.In our study, only the solid soft tissue component of the CRLMs was analyzed with texture analysis and metastases which demonstrated clear necrosis and calcifications were excluded.Compared with other studies, a larger range of first and second order texture features were also analyzed on thin 1.25 mm portal venous phase CT reconstructions.
Our results showed a correlation between the minimum histogram gradient intensity[23], negative skewness[25], discretized intensity skewness, volume at intensity fraction 10, various low grey level GLRLM features (low grey level run emphasis, short run low grey level emphasis, long run low grey level emphasis)[23,26,27] and low grey level count emphasis (NGLDM)[23,28] in responding CRLMs.Except for skewness, we are not aware that any other studies have reported the predictive first and second order texture features which were associated with response in our study.In the multiple model combining minimum histogram gradient intensity and long run low grey level emphasis the AUC of the multiple model was 0.80 (95%CI: 0.64 to 0.96).
The CRLMs in our study were not biopsied to determine if there are specific histopathological patterns which are correlated with the primary and secondary order textures that were associated with chemotherapy response.Few studies have investigated the correlation between the pathological changes in cancer, texture analysis and various CT density measurements.In general, tumor heterogeneity is associated with higher skewness, higher standard deviation, higher entropy, lower uniformity and higher kurtosis and has been reported to predict a poorer patient prognosis[14,19,29].Tumor heterogeneity reflects internal variation due to variation in cellularity, hypoxia, distribution of tumor vessels, necrosis, fibrosis, hemorrhage, myxoid changes and other factors[30-32].Research is suggesting that the CT texture analysis may reflect tumor angiogenesis and hypoxia[31,33] and that tumors with low levels of angiogenesis are more likely to exhibit hypoxia and necrosis[33].Some studies have demonstrated a correlation between skewness and the presence of an underlying KRAS mutation in CRC.Lubneret al[34] reported a negative trend between skewness and KRAS mutations.In the study by Yanget al[35] skewness also showed power in predicting the presence of KRAS/NRAS/BRAF mutations in CRC.Unfortunately, the KRAS mutation status was only tested in a limited number of our cases and therefore the texture differences between CRLMs with KRAS wild-typevsKRAS mutations were not assessed.Negative skewness may potentially also represent more pronounced low attenuation areas due to small areas of tumoral necrosis, chronic hemorrhage or myxoid change[36] which are not clearly visible to the naked eye.To the best of our knowledge, no studies have investigated the biological correlations of the GLRLM and NGLDM second order texture features.
Patients who received first-line cytotoxic chemotherapy were evaluated in studies by Ahnet al[19] and Ravanelliet al[37].Ahnet al[19] showed that in the responding CRLMs on cytotoxic chemotherapy two first order histogram features, namely lower skewness in 2D and a narrower standard deviation on the 3D texture analysis, were significantly associated with chemotherapy response.We found no significant correlation between the standard deviation and the prediction of response in our study which can potentially be explained by the fact that we excluded necrotic CRLMs (necrosis will increase the standard deviation) which may be associated with nonresponding CRLMs.In the study by Ravanelliet al[37] none of the assessed first-order textures could discriminate between the responders and non-responders in the FOLFOX/FOLFIRI group according to the RECIST 1.1 criteria and this is consistent with our findings.
The responding patients in our study presented with more extensive liver metastases.There was no statistically significant difference in the position of the colorectal cancer, in the TNM stage or tumor grade of the primary CRC or in the size (longest diameters according to RECIST criteria) and volumes of the CRLMs between the responders and non-responders.This leads one to assume that the responding CRLMs were probably associated with a more aggressive biological behavior[38].
Although the role of texture analysis is still being investigated it has the potential to impact positively on the therapeutic management of patients with cancer once predictive and prognostic biomarkers have been validated.The correlation between the texture features and the biological, histological, and genetic variables requires further research with histologically validated studies.
This study shows some limitations.The study design is retrospective and included a relatively small cohort of patients.Moreover, some of the CT acquisition parameters[39-43] and the total volume of contrast (mL/kg) injected varied slightly in a few patients.
The selection of the first-line cytotoxic chemotherapy regimen, the number of chemotherapy cycles administered and the time interval between the baseline and follow-up scans varied in the study cohort.Although this may impact on the results, this is reflective of actual clinical oncology practice and it is important to develop radiomics signatures which will have practical applications in clinical practice.
Finally, the accuracy of the segmentations was checked by an independent observer, but the inter- and intra-observer variability was not evaluated.However, a semiautomatic segmentation technique was used which can reduce inter-user variability[44].
CONCLUSION
Our study identified a few new texture features and a promising radiomics signature which are significantly associated with the response of CRLMs to first-line cytotoxic chemotherapy.These preliminary results need to be validated and confirmed on larger patient cohorts.Further investigations are required to determine if the predictive texture features have any prognostic value and are linked to the KRAS mutation status of CRLMs.
ARTICLE HIGHLIGHTS
Research background
Radiomics is a rapidly growing field of radiological research.In radiomics, computed tomography (CT) texture analysis quantifies tissue heterogeneity and has shown promise in predicting pathological features, the overall survival and the response to therapy in oncology.In the last few years a few studies have reported that texture analysis can be helpful in predicting the response to chemotherapy for colorectal liver metastases, but the results have been heterogeneous.
Research motivation
In previously published texture analysis studies on the first-line chemotherapy response of colorectal liver metastases (CRLMs), necrotic CRLMs were not clearly excluded.Thicker CT slice reconstructions were utilized in most studies which could have influenced the radiomics results due to partial voxel artefacts.Limited first and second order texture features were also analyzed in previous studies.
Research objectives
The aim of this study was to identify new predictive imaging biomarkers in patients with non-necrotic CRLMs who received first-line cytotoxic chemotherapy.CT texture analysis was performed on non-necrotic CRLMs utilizing 1.25 mm portal venous phase CT reconstructions.We also assessed a larger range of first and second order texture features.
Research methods
A total of 236 patients with CRLMs who received first-line cytotoxic chemotherapy in our private institution from March 2012 to May 2020 were retrospectively identified on our radiology information system.There were various inclusion and exclusion criteria and the final study cohort consisted of 29 patients.Multiple first and second order texture features were analyzed with the SOPHiA Radiomics software to identify predictive biomarkers in the responding CRLMs.
Research results
Our study identified a few new texture features and a promising radiomics signature which are significantly associated with the response of CRLMs to first-line cytotoxic chemotherapy.In univariable analysis eight texture features of the responding non- necrotic CRLMs were associated with treatment response, but due to strong pairwise correlations among some of the features, only two features namely minimum histogram gradient intensity and long run low grey level emphasis were included in the multiple analyses and final radiomics signature.The results of this study were unique but need to be validated and confirmed on larger patient cohorts.
Research conclusions
Future radiomics studies should attempt to quantify the difference in the texture analysis results of necrotic vs non-necrotic CRLMs utilizing different CT slice reconstructions in the same study cohort to compare the predictive value of texture analysis.These factors may partially account for the heterogeneous results which have been reported in the last few years.To allow for the better comparison between radiomics studies we should work towards the standardization of study designs, interscanner differences, acquisition parameters, analysis algorithms, the feature extraction techniques, analysis methodologies and the group of texture features which should be evaluated based on the different types of cancer.
Research perspectives
The preliminary results of our study need to be validated and confirmed on larger patient cohorts.Further investigations are required to determine if the predictive texture features have any prognostic value and are linked to the KRAS mutation status of CRLMs.Standardization of radiomics studies is required to compare the texture analysis results of different studies.
ACKNOWLEDGEMENTS
SOPHiA GENETICS for sponsoring their SOPHiA Radiomics software and services for the duration of the Master in Oncologic Imaging.Dr.Dupper L (private oncologist at Cancercare, Port Elizabeth, South Africa) for assisting with the collection of the clinical and pathology results of the study cohort and for providing general clinical information on the management of colorectal liver metastases (CRLMs).Dr.Crocket J (private oncologist at Cancercare, Port Elizabeth, South Africa) for providing general clinical background information on the chemotherapeutic management of patients with CRLMs.Dr.Basson S (general radiologist at Bay Radiology, Port Elizabeth, South Africa) who acted as independent observer to confirm the accurate segmentation and selection of the CRLMs for the study.
 World Journal of Hepatology2022年1期
- World Journal of Hepatology的其它文章
- Current highlights on solid pseudopapillary neoplasm of the pancreas
- Is there a role of lipid-lowering therapies in the management of fatty liver disease?
- Vitamin D supplementation for autoimmune hepatitis: A need for further investigation
- Acute liver failure secondary to acute antibody mediated rejection after compatible liver transplant: A case report
- COVID-19 emergency: Changes in quality of life perception in patients with chronic liver disease-An Italian single-centre study
- Correlation of hepatitis B surface antigen expression with clinicopathological and biochemical parameters in liver biopsies: A comprehensive study