Speed-resolved blood perfusion and oxygen saturation in human skin response to thermal stimulation
2022-03-08 08:15:24ShuYouWangYanKeAiYuYingTianQiZhenWangShuYongJiaFengXiongXiaoJingSongWeiBoZhangGuangJunWang
TMR Modern Herbal Medicine 2022年1期
Shu-You Wang,Yan-Ke Ai,Yu-Ying Tian,Qi-Zhen Wang,Shu-Yong Jia,Feng Xiong,Xiao-Jing Song,Wei-Bo Zhang,Guang-Jun Wang,*
1 Institute of Acupuncture and Moxibustion,China Academy of Chinese Medical Sciences,Beijing,China.
2 Institute of Basic Research in Clinical Medicine,China Academy of Chinese Medical Sciences,Beijing,China.
Abstract The functional status of vessels can be determined by assessing blood perfusion.By integrating diffuse reflectance spectroscopy(DRS)and Laser Doppler Flowmetry(LDF),the speed-resolved blood perfusion and blood oxygen saturation can be measured simultaneously by Enhanced Perfusion and Oxygen Saturation(EPOS).The dataset presented in this descriptor contains EPOS data recorded from a forearm point exposed to different levels of thermal stimulation,the classical LDF at control points,the R-R time series and data regarding the subjects’ characteristics.All data were recorded from 60 recruited healthy subjects.Half of the subjects received different levels of thermal stimulation,and half of them were blank controls.We believe that this dataset will lead to the development of local blood perfusion methods that can be used to index vessel function assessments.This publicly available dataset will be beneficial to the microcirculation evaluation.
Keywords Laser Doppler Flowmetry,Speed-resolved Blood Perfusion,Blood Oxygen Saturation,Thermal Stimulation,Electrocardiogram,Coherence Analysis
Background &Summary
There is increasing evidence that microcirculation can be used to evaluate vascular disorders at the systemic level[1,2],and there is a close relationship between cardiac function and vessel function[3,4].In general,the functional status of vessels can be assessed by laser Doppler flowmetry(LDF).However,differentiating between different vascular compartments using the classical LDF approach is difficult.Recently,a multiparameter model based on the Monte Carlo algorithm has provided the possibility of further distinguishing the different velocity components in microcirculation perfusion[5-7].This new method may provide further insight into evaluating vascular dysfunction at the systemic level[8,9].
According to previous studies,blood perfusion signals recorded by LDF can be separated into different frequency bands in the frequency domain[10-13];these frequency bands might reflect different physiological rhythms[14].From another perspective,microcirculation perfusion can also be distinguished by the speed distribution,and the speed of red blood cells(RBCs)is closely related to the total cross-sectional area of different types of blood vessels.Therefore,different velocity components have potential value for distinguishing different types of blood vessels,thereby exploring the regulatory mechanisms of local microcirculation.By applying computational models,the Enhanced Perfusion and Oxygen Saturation(EPOS)system enables absolute measures of speed resolved perfusion.Dividing the flow at different speeds enables some differentiation of the flow into different vessel structures[15],such as capillaries,venules and arterioles,although one cannot expect a one-to-one correlation between flow speed and vessel type.By separating perfusion into speed regions,the different vascular effects that result from thermal stimulation can be studied separately.Therefore,our results provide an opportunity for deeper insight into the endothelial and neurovascular function and for a better understanding of how microcirculation responds to different levels of thermal stimulation in human skin microcirculation.
On the other hand,oxygen saturation represents a dynamic balance between the O2supply and O2consumption in the capillary,arteriolar,and venular beds.It is generally believed that local oxygen saturation is closely related to blood flow perfusion[16].Previous studies have shown an exponential correlation between oxygen saturation and blood flow.When the flow speed increases,the capillary transit time decreases,resulting in an instantaneously lowered oxygen extraction and an increased overall blood saturation level[17].However,because blood flow components can be divided into different speed-resolved components,there is still no evidence of the relationship between oxygen saturation and speed-resolved blood perfusion.
This data descriptor outlines a dataset of speed-resolved blood perfusion and oxygen saturation signals recorded locally at the stimulating point before and after stimulation with different levels of thermal stimulation,as well as classical LDF data of the control points and RR interval data of the subjects.It was compiled for our related work[18]with parts of the dataset used in the study on complexity changes of local speed-resolved blood perfusion and the relationship between local speedresolved blood perfusion and the heart rate.The results[18]indicated that different thermal stimulation resulted in different changes in the complexity area index of speedresolved blood perfusion.Overall,this dataset can be used to study the relationship between local oxygen saturation and speed-resolved blood flux in response to different levels of thermal stimulation.In addition,our present dataset is useful as a reference dataset for various studies on normal or abnormal blood perfusion signal patterns that are common.Because both DRS and LDF have limited penetration depth,the measurements shown here will be restricted to only the superficial regions of the skin.
Methods
These methods are expanded versions of descriptions in our related work[18,19].
Participants and design
Sixty healthy subjects aged 18 to 60 years were included in this study.Please refer to Data 4 for more details[20].None of the participants reported neurological,psychiatric,or other brain-related diseases.None of the subjects were taking any medication that would affect cardiovascular or autonomic regulation.Alcohol,tea and coffee intake were prohibited for at least 24 hours prior to measurements.This study was conducted according to the Helsinki declaration,all participants were informed of the experimental procedure,and all patients provided written consent prior to the experiment.Written consent was approved by the Institutional Research Ethics Boards of Acupuncture &Moxibustion of the China Academy of Chinese Medical Sciences.
All recruited participants completed the measurements between 9 a.m.and 5 p.m.Subjects in the thermal stimulation group received a total of 4 different levels of stimulation corresponding to 38°C,40°C,42°C and 44°C.The order of thermal stimulation was randomly determined for each patient.The experimental protocol was as follows:All experiments were carried out in a quiet,temperaturecontrolled(24-26°C)laboratory.After a period of cardiovascular stability(30 min),a baseline recording was made for 30 min.Then,the test subjects were stimulated using a thermal stimulation EPOS(Perimed AB,Stockholm,Sweden)for 30 min followed by a 30-min rest period.For the blank control group(BC group),the measurement process was the same as that for the temperature stimulation group(TS group),except that the probe was not heated to keep the subjects in a resting state so that the blood flow parameters of the subjects could be obtained in a resting state.The thermal stimulation point was located on the anterior aspect of the forearm,between the tendons of the palmaris longus and the flexor carpi radials,5 proportional bone cun(B-cun)proximal to the palmar wrist crease.Control point 1 was located 2 B-cun proximal to the palmar wrist crease,and control point 2 was located 8 B-cun proximal to the palmar wrist crease[21].The recording points are shown in Figure 1.
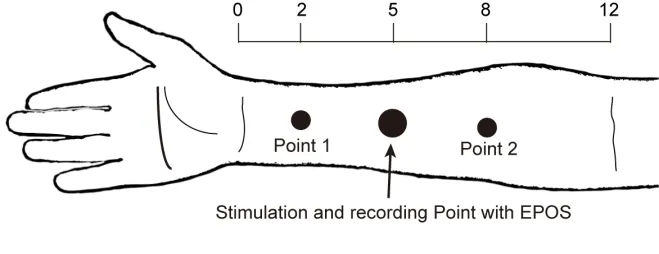
Figure 1.The thermal stimulation point and control point in the right forearm.
The thermal stimulation point was located on the anterior aspect of the forearm,between the tendons of the palmaris longus and the flexor carpi radials,5 B-cun proximal to the palmar wrist crease.Control point 1 was located 2 B-cun proximal to the palmar wrist crease,and control point 2 was located 8 B-cun proximal to the palmar wrist crease.The figure is modified from our related work.
Protocol for the blood perfusion and oxygen saturation measurements
During the recording session,subjects were placed in a supine position,and their forearms were fixed with a vacuum pillow(AB Germa,Kristianstad,Sweden).Microcirculation was measured by a PeriFlux 6000 Enhanced Perfusion and Oxygen Saturation(EPOS;Perimed AB,Stockholm,Sweden)system with a 3-Hz sampling rate according to the previously described recording protocol[8,22].All of the measurement processes were set up in the EPOS management system.During measurements,the EPOS flat probe was fixated using double-sided adhesive tape(PF 105-1,Perimed AB,Stockholm,Sweden).The EPOS system was used for a multimodal assessment of the microcirculation using diffuse reflectance spectroscopy(DRS)and LDF.Using the EPOS system,data for both speed-resolved blood perfusion and oxygen saturation signals were obtained simultaneously.The blood perfusion of the stimulated point was evaluated for three speeds(V1,< 1 mm/s;V2,1-10 mm/s;and V3,> 10 mm/s).The probe combined both a laser Doppler probe and a thermostatic probe at the stimulated point,which allowed for controlled,consistent heating of the skin area under the probe surface.
The control points are also located on the midline of the forearm,which is collinear with the stimulus point and equidistant from the stimulus point.The classic LDFs of both control points(points 1 and 2)were recorded by a PeriFlux 5000(Perimed AB,Stockholm,Sweden)system with a 64-Hz sampling rate.The method used to record the blood perfusion flux signal is described in our previous studies[23-25].Thus in the control points,just conventional blood perfusion was recorded and without any stimulation
Both the thermal stimulation point and control points are shown in Figure 1.The temperature recordings,oxygen saturation recordings,speed-resolved perfusion and classic LDF of the control points for one case subject are shown in Figure 2.For the speed-resolved perfusion results recorded by PF6000,the data were exported directly from the EPOS system in MATLAB format;for the control point results,which were recorded by PF5000,the data were opened with PeriSoft for Windows(version 2.5.5,Perimed,Sweden)and then exported in the txt format.Finally,the data were saved in MATLAB(2015b,MathWorks,Natick,Massachusetts,USA)and Excel format.
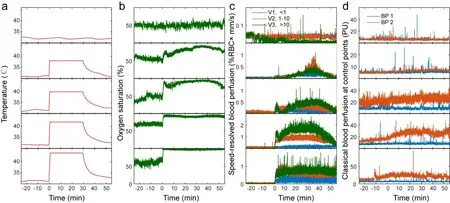
Figure 2.Example of raw dataset.(a)Temperature curves under different stimuli.From top to bottom is blank control,38 °C,40 °C,42 °C and 44 °C,respectively.The temperature under different temperatures.(b)The oxygen saturation under different temperatures.(c)The speed-resolved blood perfusion at the stimulation and recording point under different temperatures.(d)The classical blood perfusion at control points under different temperatures.V1,low speed,< 1 %RBC× mm/s;V2,mid-speed,1-10 %RBC × mm/s;and V3,high speed,> 10 %RBC × mm/s.BP1,blank control point 1;BP2,blank control point 2.
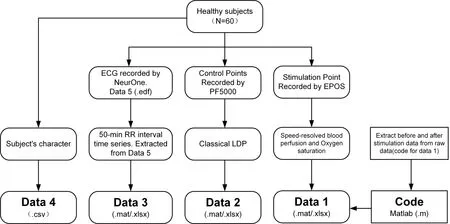
Figure 3.The structure of the database.Data 1,Data 2,Data 3,Data 4 and Data 5 can be found in figshare(https://doi.org/10.6084/m9.figshare.8299343.v4).
Electrocardiogram measurement protocol
The ECG was measured by the NeurOne system(NeurOne,MEGA electronics Ltd,Finland).Subjects were directed to lie down on a comfortable bed,and 3 adhesive Ag/AgCl electrodes(3M,Shanghai,China)were applied to the chest for ECG recording at a sampling rate of 1000 Hz[23,26-28].The raw data were saved as Data 5 in EDF format,the files were imported into Kubio HRV software(Kubios HRV Premium 3.0.0,Kubios oy,Kuopio,Finland)in EDF format,and then,the 50-min RR interval time series were extracted and saved in mat format.
Data records
The dataset can be found on the figshare[20].Data 1,Data 2 and Data 3 folders contain both Matlab and excel format files each.Data 5 contains ECG raw data in EDF format(the data structure is shown in Figure 3).The names of the files under each folder are shown in Online-only Supplementary Table 1,Online-only Supplementary Table 2 and Online-only Supplementary Table 3.The mat file in the Data 1 folder contains 4 matrix elements:oxygen,perfusion,temperature and time.The matrix perfusion element is made up of three columns:v1(< 1 %RBC ×mm/s),v2(1-10 %RBC × mm/s)and v3(> 10 %RBC ×mm/s).The oxygen,perfusion and temperature elements are synchronized in time with a 3-Hz sampling rate and are shown in Figure 2a,b,and c.The mat file in the Data 2 folder contains 2 matrix elements,namely,BP_1 and BP_2,from classical LDF recorded at control points with a 64-Hz sampling rate,and these data are shown in Figure 2d.The mat file in the Data 3 folder contains 2 matrix elements:RRs and T_RRs.The RRs represent the R-R time series of the ECG,and the T_RRs represent the time index.The samples were extracted from ECG recordings with a NeurOne system with a 1000-Hz sampling rate.Data 4,comprising data pertaining to the subjects’ characteristics,is presented in CSV format.
Technical validation
To exclude motion artifacts,the subjects’ forearms were fixed with a vacuum pillow(AB Germa,Kristianstad,Sweden).During the recording,if the hemoglobin signature in the DRS spectra was too weak,the RBC oxygen saturation estimation became unstable.The oxygen saturation estimate was hence discarded for hemoglobin areas that were too small and if the estimated RBC tissue concentration was below 0.1 %[22].During data preprocessing,any outliers were replaced using the linear interpolation method.By default,an outlier is a value that is more than three scaled median absolute deviations(MADs)away from the median.
Coherence analysis
In the current dataset,data for oxygen saturation and speed-resolved blood perfusion were obtained simultaneously,and coherence analysis was performed between oxygen saturation and speed-resolved blood perfusion.To calculate the coherence between oxygen saturation and speed-resolved blood perfusion,the coherence value was estimated by the following equation[29]:


Figure 4.Coherence analysis results between oxygen saturation and speed-resolved blood perfusion.(a)The coherence value between oxygen saturation and V1 blood perfusion before thermal stimulation.(b)The coherence value between oxygen saturation and V2 blood perfusion before thermal stimulation.(c)The coherence value between oxygen saturation and V3 blood perfusion before thermal stimulation.(d)The coherence value between oxygen saturation and V1 blood perfusion after thermal stimulation.(e)The coherence value between oxygen saturation and V2 blood perfusion after thermal stimulation.(f)The coherence value between oxygen saturation and V3 blood perfusion after thermal stimulation.V1,low speed,<1 %RBC × mm/s;V2,mid-speed,1-10 %RBC × mm/s;and V3,high speed,>10 %RBC × mm/s.Oxy,oxygen saturation.Data are presented as the mean ± sem.
In general,the flow with speeds below 1 mm/s are associated with capillary flow,although some venular flow may also fall into that category.The speeds 1-10 mm/s is foremost constituted by flow in venules,small arterioles and,under some circumstances,veins.The flow speeds above 10 mm/s are primarily related to flow in larger arterioles and other larger vessels situated in the sampling volume.It should be noted,however,that these relationships between flow speed and vessel type may be altered during for example heating provocations or when pressure is applied.Under some conditions,capillaries may act as shunting vessels and then likely contain flow speeds above 1 mm/s,but in that situation those capillaries do not contribute to the nutritive flow.Therefore,when interpreting the data,we should pay attention to the following points:First,the data we get is distinguished by speed,not by blood vessel type;Second,under the condition of thermal stimulation,the standard value of speed to distinguish blood flow may change,no longer 1mm/s and 10 mm/s,and it should be increased appropriately;Third,oxygen saturation is different in different vessel types.It is a potential method to correct speed-resolved blood flow through the relationship between oxygen saturation and speed-resolved blood flow.
Limitation
In the current dataset,the age of the recruited subjects is relatively concentrated,it can’t represent all age groups.Therefore,it is impossible to analyze the relationship between heart rate,skin blood flow,and blood oxygen saturation in different age groups,which is the limitation of this study.In addition,the relevant receptors of the skin have a high resolution to temperature and can distinguish very small temperature difference changes.In the current dataset,the span of the stimulation temperature setting is too large.This is also a limitation of this study.In blood flow signal recording,due to the limitation of instrument sampling rate,the amount of data recorded per unit time is very limited,which affects the subsequent correlation analysis.Therefore,in future research,on the one hand,we should recruit people of different ages to make the samples representative,on the other hand,we should reduce the temperature gradient of stimulation and increase the sampling rate.
Data availability
Supplementary data are available online at https://doi.org/10.6084/m9.figshare.8299343.v4 and Supplementary Tables are available online at TMR Modern Herbal Medicine.
Correspondence and requests for materials should be addressed to tjuwgj@gamil.com(Guang-Jun Wang).
Code availability
Readers can access codes in our datasets at figshare.com.Among these codes,MATLAB codes named “Code for Data 1.zip” for extracting data from raw datasets can be found.
Abbreviations
DRS,diffuse reflectance spectroscopy;LDF,laser Doppler Flowmetry;EPOS,Enhanced Perfusion and Oxygen Saturation;RBCs,red blood cells;TS,temperature stimulation;BC,blank control;B-cun proportional bone cun;Oxy,oxygen saturation;V1,low speed,<1 %RBC ×mm/s;V2,mid-speed,1-10 %RBC × mm/s;V3,high speed,>10 %RBC × mm/s.
Acknowledgments
This research was funded by the Ministry of Science and Technology of the People’s Republic of China(2015CB554502)and the Fundamental Research Funds for the Central Public Welfare Research Institutes(ZZ11098).
Author contributions
Conceptualization,Guang-Jun Wang;Methodology,Shu-You Wang,Yu-Ying Tian,Shu-Yong Jia,Xiao-Jing Song,Wei-Bo Zhang and Guang-Jun Wang;Analysis,Shu-Yong Jia and Guang-Jun Wang;Writing original draft preparation,Shu-Yong Jia,Xiao-Jing Song,Wei-Bo Zhang and Guang-Jun Wang;Writing review and editing,Shu-You Wang,Yan-Ke Ai,Yu-Ying Tian,Feng Xiong and Guang-Jun Wang;Visualization,Qi-Zhen Wang and Guang-Jun Wang;Guang-Jun Wang and All authors have read and agreed to the published version of the manuscript.
Competing interests
The authors declare no competing interests.
Supplementary Tables
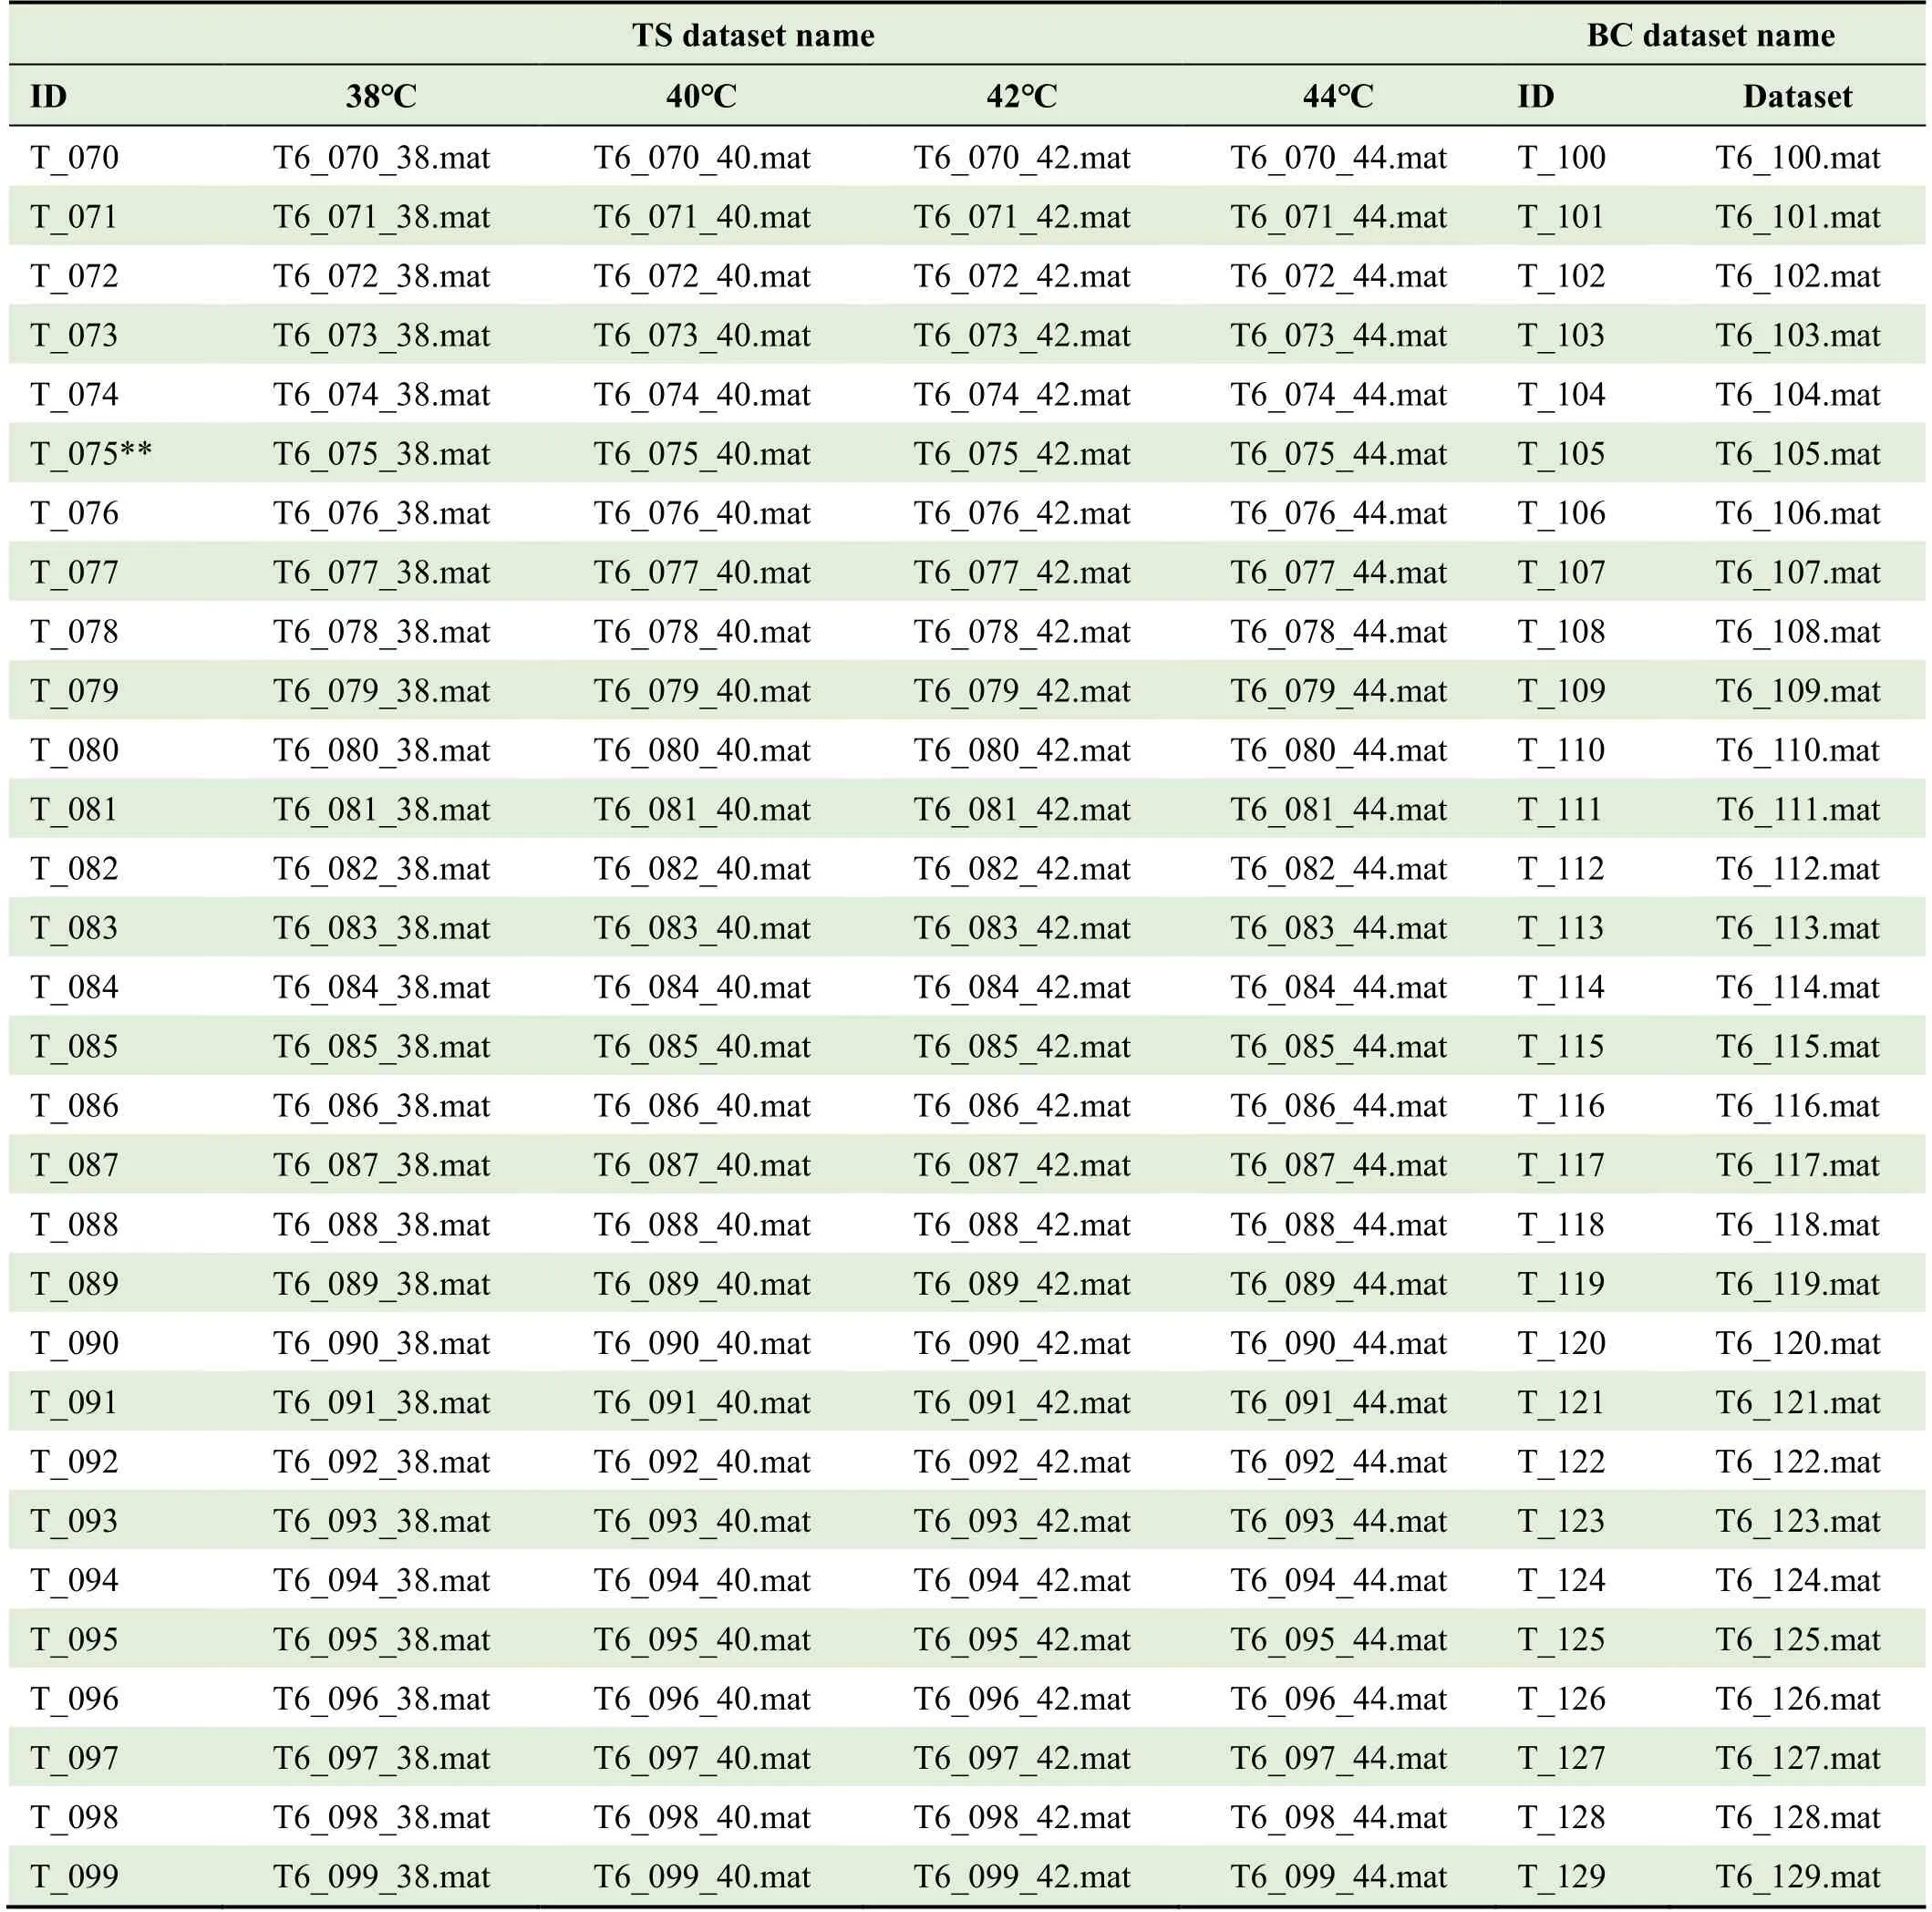
Table 1.The file names of Data 1(recorded by EPOS).

Table 2.The file names of Data2(recorded by PF5000).

Table 3.The file names of Data 3(50-min RR interval extracted from Data 5)and Data 5(ECG signal recorded by NeurOne system).
 TMR Modern Herbal Medicine2022年1期
- TMR Modern Herbal Medicine的其它文章
- Blood stasis syndrome:clinical multi-omics research and related problems
- Efficacy and safety of Phillyrin (KD-1)capsule in the treatment of moderate COVlD-19:protocol for a randomized controlled trial
- Guizhi Fuling capsule can induce apoptosis of myeloma cells through the mitochondrial apoptosis pathway
- Clinical practice guidelines for traditional Chinese medicine and integrated traditional Chinese and western medicine:a cross-sectional study of data analysis from 2010 to 2020
- lndirubin suppresses 4T1 murine breast cancer in vitro and in vivo by induction of ferroptosis