Hemoglobin within normal range is negatively related to hemoglobin A1c in a nondiabetic American population aged 16 years and older
2022-03-23 01:38:16XiaoFangBaiHuanWangQiaoLingZhao
World Journal of Diabetes 2022年3期
lNTRODUCTlON
Diabetes mellitus(DM)has a high global incidence.The prevalence and incidence of DM continue to increase annually.DM is a major cause of global morbidity and mortality,and was one of the major causes of death in the United States in 2015.Over 30 million and 86 million Americans suffer from diabetes and prediabetes,respectively,which could increase the occurrence rate of many chronic diseases,especially type 2 DM(T2DM)[1].Obesity may serve as a major inducement factor for diabetes,and the prevalence of diabetes and obesity are increasing[2].Diabetes status can be classified into three categories:nondiabetes,prediabetes,and diabetes(T2DM)[3].Chronic prediabetes and diabetes often cause a series of complications,including renal,ophthalmological,neurological,and vascular complications
It is well known that controlling high blood glucose levels could reduce and postpone the appearance and progression of DM-related complications[4].Therefore,many prospective ongoing clinical studies are evaluating the efficacy of new and rarely studied diabetes biomarkers.
Hemoglobin(Hb)is a protein molecule that only exists in red blood cells(RBCs)that can bind oxygen.In the bloodstream,Hb is glycated.Hemoglobin A1c(HbA1c)acts as glycosylated hemoglobin(GHb)constructed by the nonenzymatic binding of glucose to valine at the N-terminus of the Hb β chain,which is the most abundant and common Hb in human erythrocytes.The GHb(HbA1c)level represents the percentage of Hb proteins bound to glucose.Glycemic control has been assessed using GHb.The higher the primary environmental level of blood glucose,the higher the HbA1c level[5].However,the relationship between the Hb and HbA1c levels remains unclear.Hence,our study aimed to reveal the relationship between the normal level of Hb and GHb in a nondiabetic American population aged ≥ 16 years through cross-sectional investigation data obtained from the 1999-2018 National Health and Nutrition Examination Survey(NHANES)
MATERlALS AND METHODS
Population research
This study analyzed the NHANES data from 1999 to 2018(20 years).The NHANES participants are representative of the non-institutionalized civilians in America employed by the NHANES multistage stratified sampling design[6].
By Sunday, everyone was anxious to pick new names again, and this time there was even more laughter and merriment during the picking process, except for Eric. Once again he unfolded his paper, looked at it, and stuffed it in his pocket without a word. Mother noticed, but said nothing.
Since 1999,the NHANES has investigated approximately 5000 people in 15 different counties in America every year[8,10-13].Each participant represents approximately 65000 people across the country,and such individuals have made significant contributions to the study.Our research had a large-scale,population-based research design;therefore,our results can be extended to the entire American population.However,there are some limitations that should be noted.First,a cause-andeffect relationship between Hb and HbA1c levels could not be established as a consequence of the crosssectional design of our research.Longitudinal,prospective,large-scale human studies are needed at this point.Second,some covariant data were extracted from self-reporting,which may be easily affected by self-reporting bias.Nevertheless,the data were gathered by skilled interviewers in accordance withstandardized agreements.Third,we excluded individuals with diabetes and abnormal Hb levels and those younger than 16 years of age.Therefore,our conclusions do not apply to these groups of people.Fourth,although several potential confounding factors were regulated,other potential confounding factors were not included in this study.Therefore,our study may include biases.Further prospective studies with large sample sizes are needed which include the measurement of these additional variables.
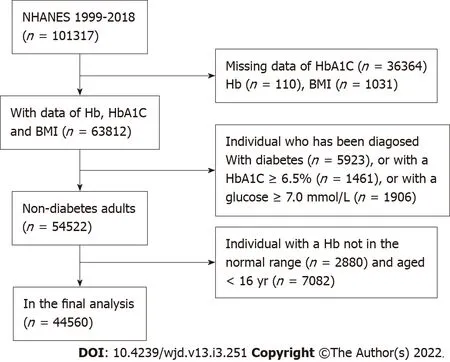
A total of 101317 participants were registered in the NHANES 1999-2018 database.In this research,44560 adults aged ≥ 16 years with Hb and HbA1c level data were considered available.We excluded the individual cases with missing HbA1c data(
= 36364);with missing Hb data(
= 110);with missing body mass index(BMI)data(
= 1031);aged < 16 years(
= 7,082);diagnosed with diabetes(
= 5923);with an HbA1c level of > 6.5%(
= 1461)or a glucose level of > 7.0 mol/L(
= 1906);and with an abnormal Hb level(
= 2880).Furthermore,44560 nondiabetic patients were included in the final analysis(Figure 1).
Variable research
The exposure variable was the Hb level.The method used to derive the complete blood count(CBC)parameters was based on the Beckmann Kurt counting and grading method,combined with an automatic dilution and hybrid device used for sample treatment and a single beam photometer for the determination of the Hb level.
All the country people were standing10 round the King s throne, and were crowded together in thick masses almost out of the windows to see the Princess receive the suitors; and as each one came into the room all his fine phrases went out like a candle! It doesn t matter! said the Princess
But the whole shop, from the till down to the shavings, from that night changed their opinion of the tub, and they looked up to it, and had such faith in it that they were under the impression that when the grocer read the art and drama critiques out of the paper in the evenings, it all came from the tub
The outcome variable was the HbA1c level.The HbA1c whole blood sample was processed,stockpiled,and transferred to the University of Kansas,Columbia,Missouri.
The multivariate model contained variables that may confuse the association between the HbA1c and Hb.Age;sex;ethnicity;education level;marital status;smoking behavior;BMI;levels of blood glucose,uric acid,total protein,alanine aminotransferase,cholesterol,and serum creatinine;platelet count;and white blood cell and RBC counts were acquired from questionnaires.Smoking behavior was derived from the question “Have you/Has SP smoked more than 100 cigarettes in your/his/her whole life?”The variable name was SMQ020.The SAS label referred to having smoked more than 100 cigarettes in a lifetime.Marital status was defined as follows:unmarried(never married),married(including married and living with partner),divorced(including widowed,divorced,and separated),and unknown(including refused,unknown,and missing).Educational level was quantified as follows:less than high school(including less than the 9
grade and 9
to 11
grade),high school,and above high school(including some university or AA degrees and above university).Race was classified as follows:Mexican Americans,non-Hispanic whites,non-Hispanic blacks,Hispanics,and others,including multiple ethnic groups.BMI was measured at the mobile examination center and calculated as weight/height
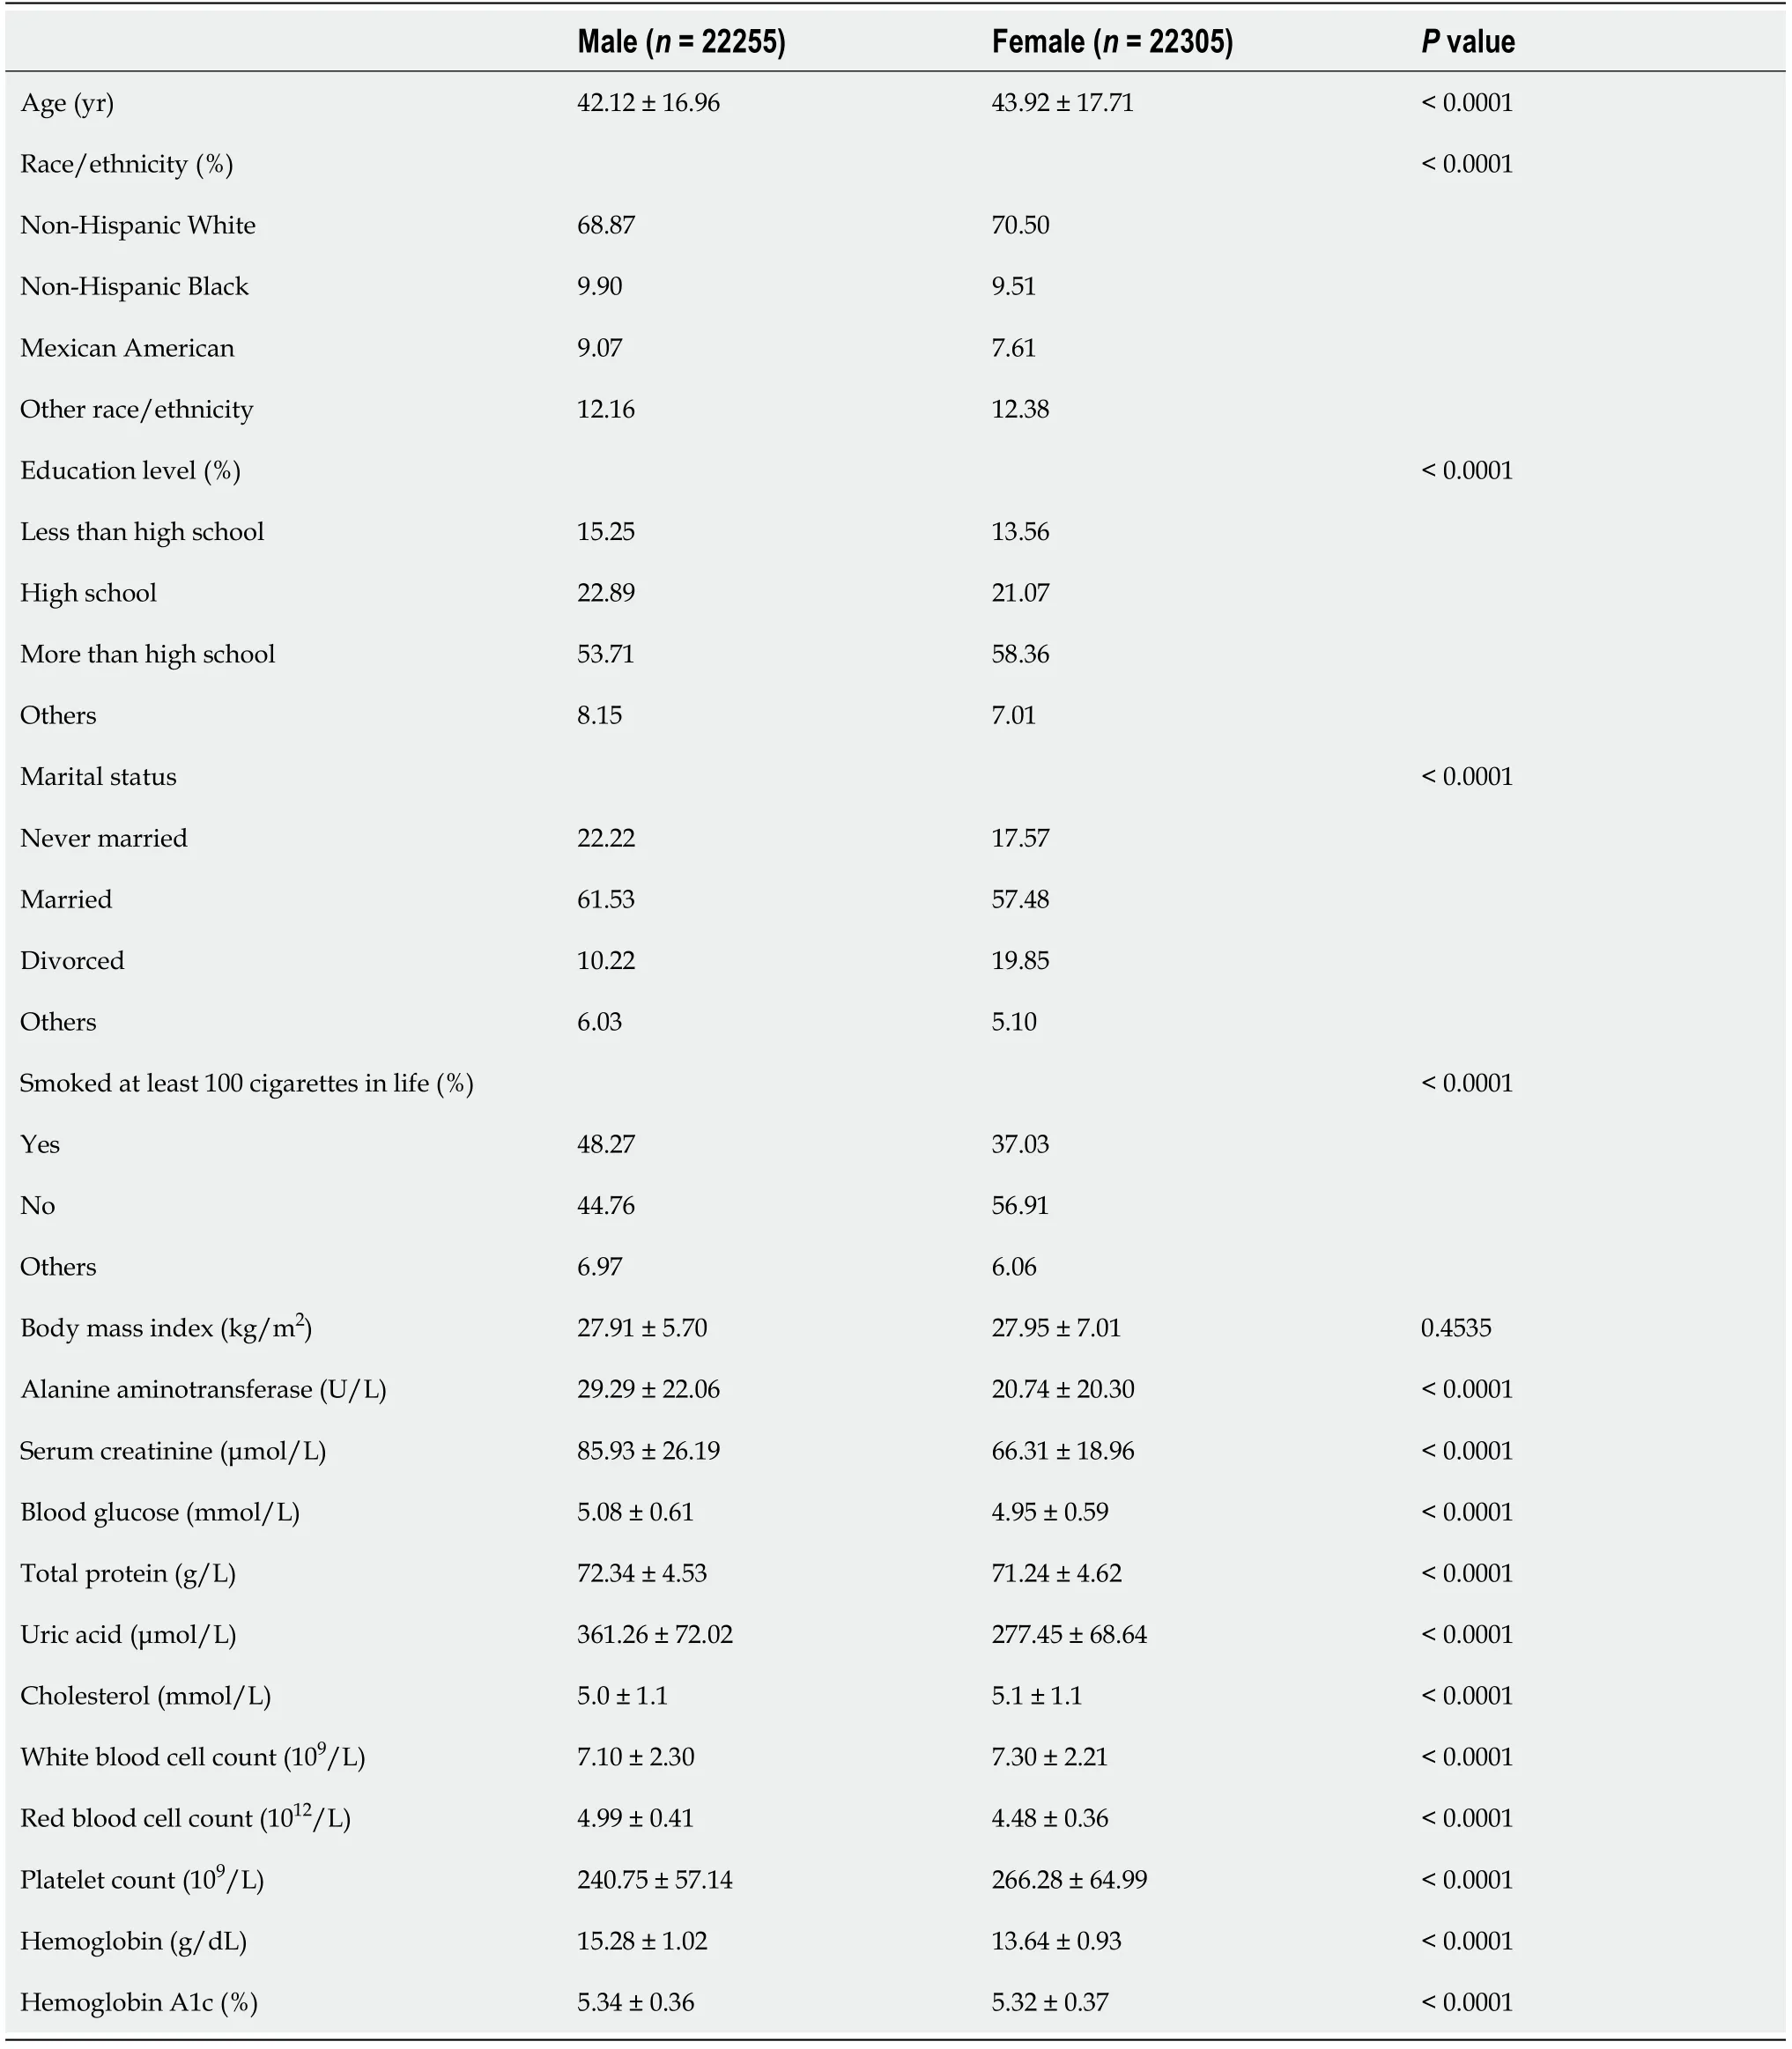
.Blood glucose,total protein,uric acid,cholesterol,alanine aminotransferase,and serum creatinine levels and other data were obtained through the Beckman Synchron LX20 standard biochemical curve analysis.The platelet and white blood cell/RBC count data were obtained from a CBC with a 5-part differential.Diabetes was defined as an HbA1c level of > 6.5% or a fasting blood glucose level of > 7 mmol/L,according to the 2019 American Diabetes Association standards[7].Details of the data are presented in Table 1 and freely available on the NHANES website(www.cdc.gov/nchs/nhanes/).
Further subgroup analyses were performed based on sex and age.The quartile classification of the Hb level and sensitivity analysis was performed,and the trend P value was calculated.This was followed by a subgroup analysis sorted by age and sex.We applied smoothing curve fitting and generalized additive models to search for the potential nonlinear relationship between the GHb and Hb levels.Piecewise linear regression was employed to analyze the threshold effect of HbA1c.All analyses incorporated the NHANES sampling weights.Statistical significance was set at
< 0.05.
He flew into a dreadful rage when he saw them, and screamed out, Oh, you fools! the river and bridge were they! Go back and bring them to me at once, or it will be the worse for you
RESULTS
A total of 44560 participants ≥ 16 years of age were included in this study.The weighted distributions of sex are shown in Table 1.Women were more educated than men and comprised a higher percentage of non-Hispanic whites and older age individuals;they also had higher cholesterol levels and white blood cell and platelet counts,lower percentage of smoking at least 100 cigarettes in a lifetime,lower levels of alanine aminotransferase,total protein,serum uric acid,serum creatinine,blood glucose,Hb,and HbA1c,and a lower RBC count.
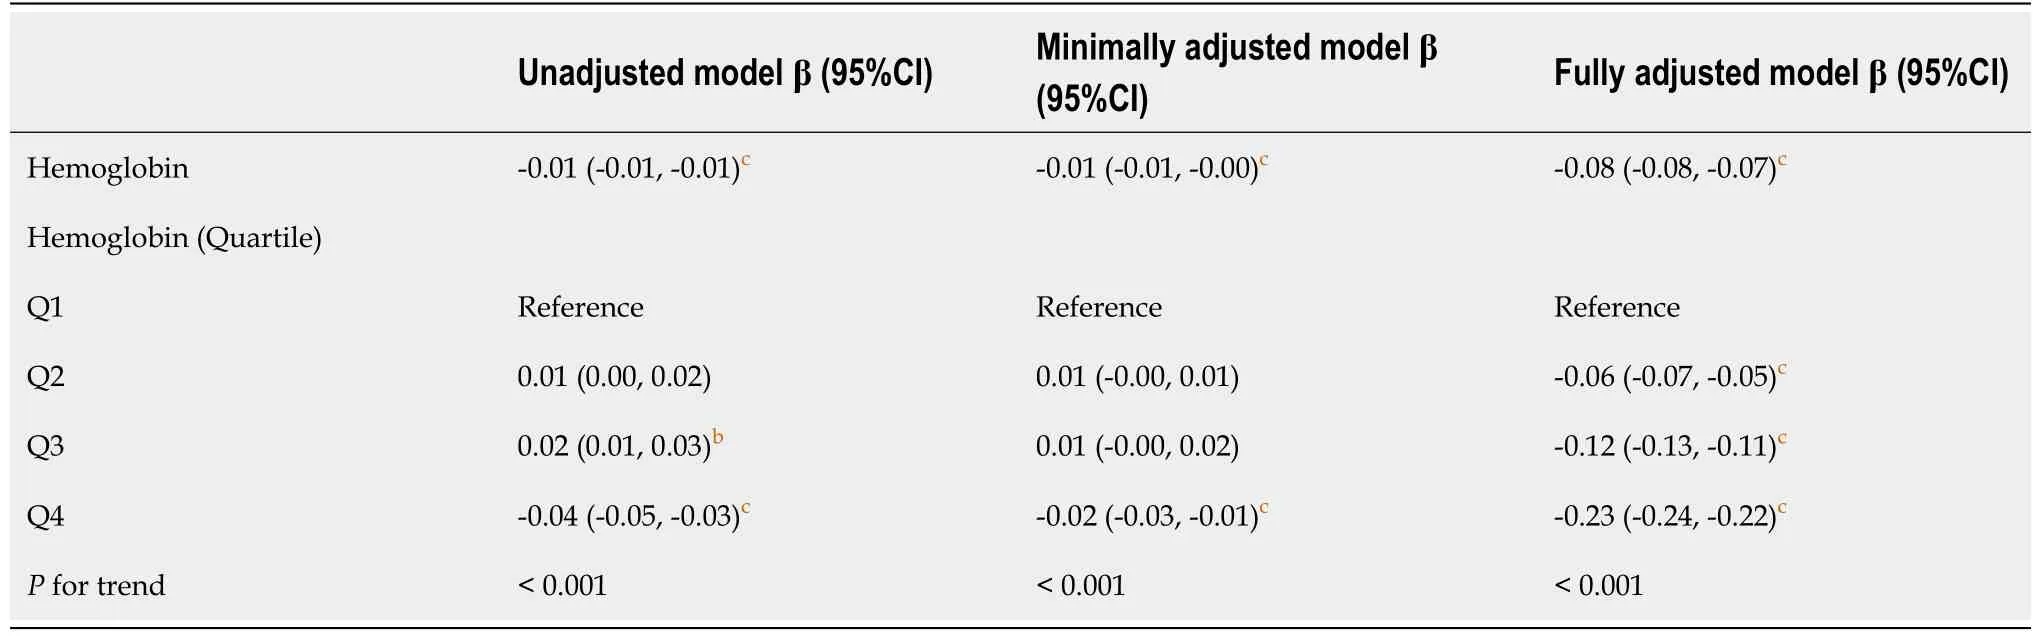
The correlation between Hb and HbA1c obtained by multiple regression analysis is shown in Table 2.There was a negative correlation between the Hb and HbA1c levels(β = -0.01;95%CI:-0.01,-0.01)in the unadjusted model.The correlation remained significant with the smallest adjustment for age and sex in the regression model(β = -0.01;95%CI:-0.01,-0.00).After further adjusting the covariates with the estimated impact of the HbA1c level in the model exceeding 10%,the correlation remained negative(β =-0.08;95%CI:-0.08,-0.07).
value was < 0.001 for trend.
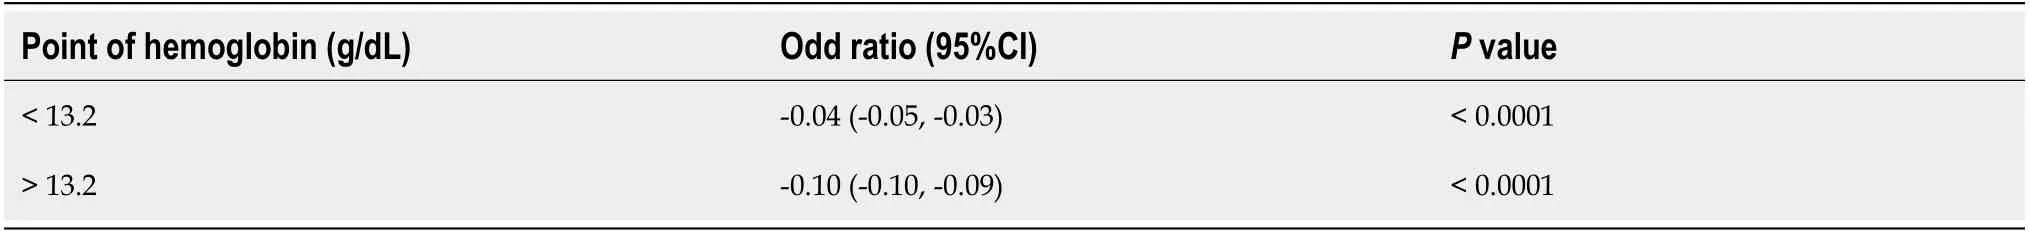
A nonlinear relationship between Hb and HbA1c was observed when the Hb levels reached the turning point(13.2 g/dL)[adjusted odds ratio(OR),-0.04;95%CI:-0.05,-0.03;
< 0.0001)and when the Hb levels exceeded 13.2 g/dL(adjusted OR,-0.10;95%CI:-0.10,-0.09;
< 0.0001).The results are presented in Table 4.
Accordingly envoys5 were sent to bring back an exact report of the princess s looks and ways, and they returned saying that she was tall and well made, but so very light that the equerries who accompanied her in her walks had to be always watching her, lest she should suddenly be blown away
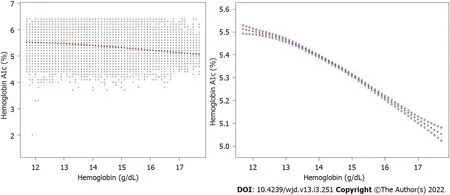
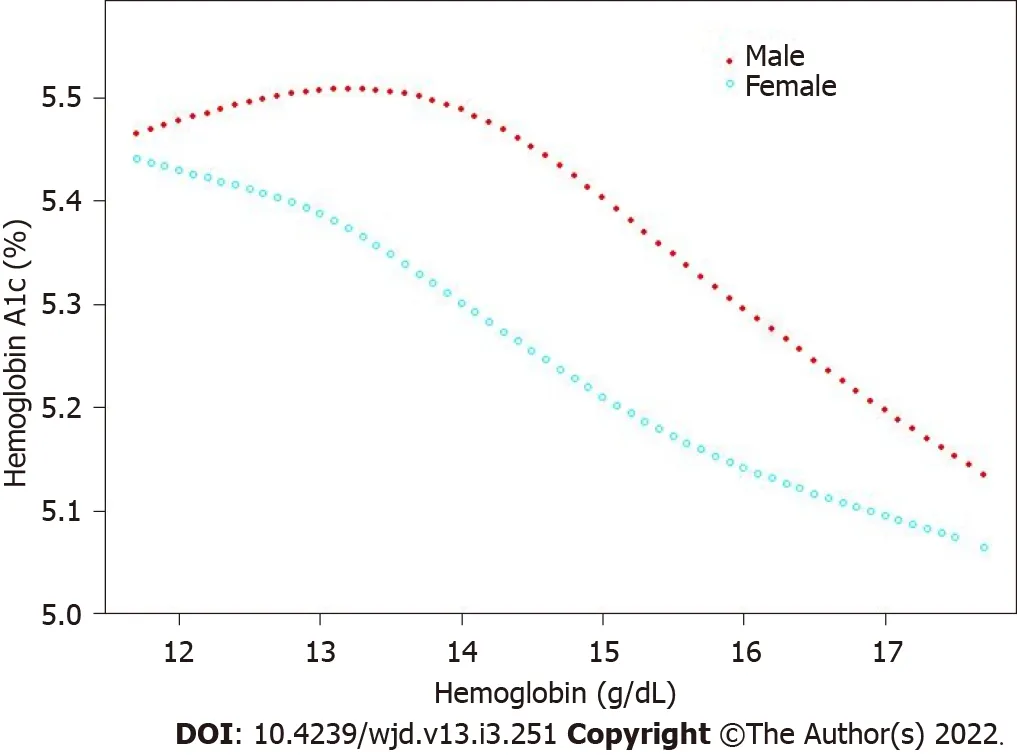
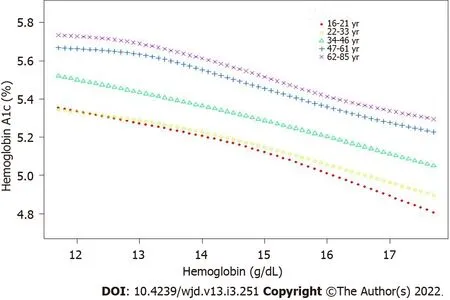
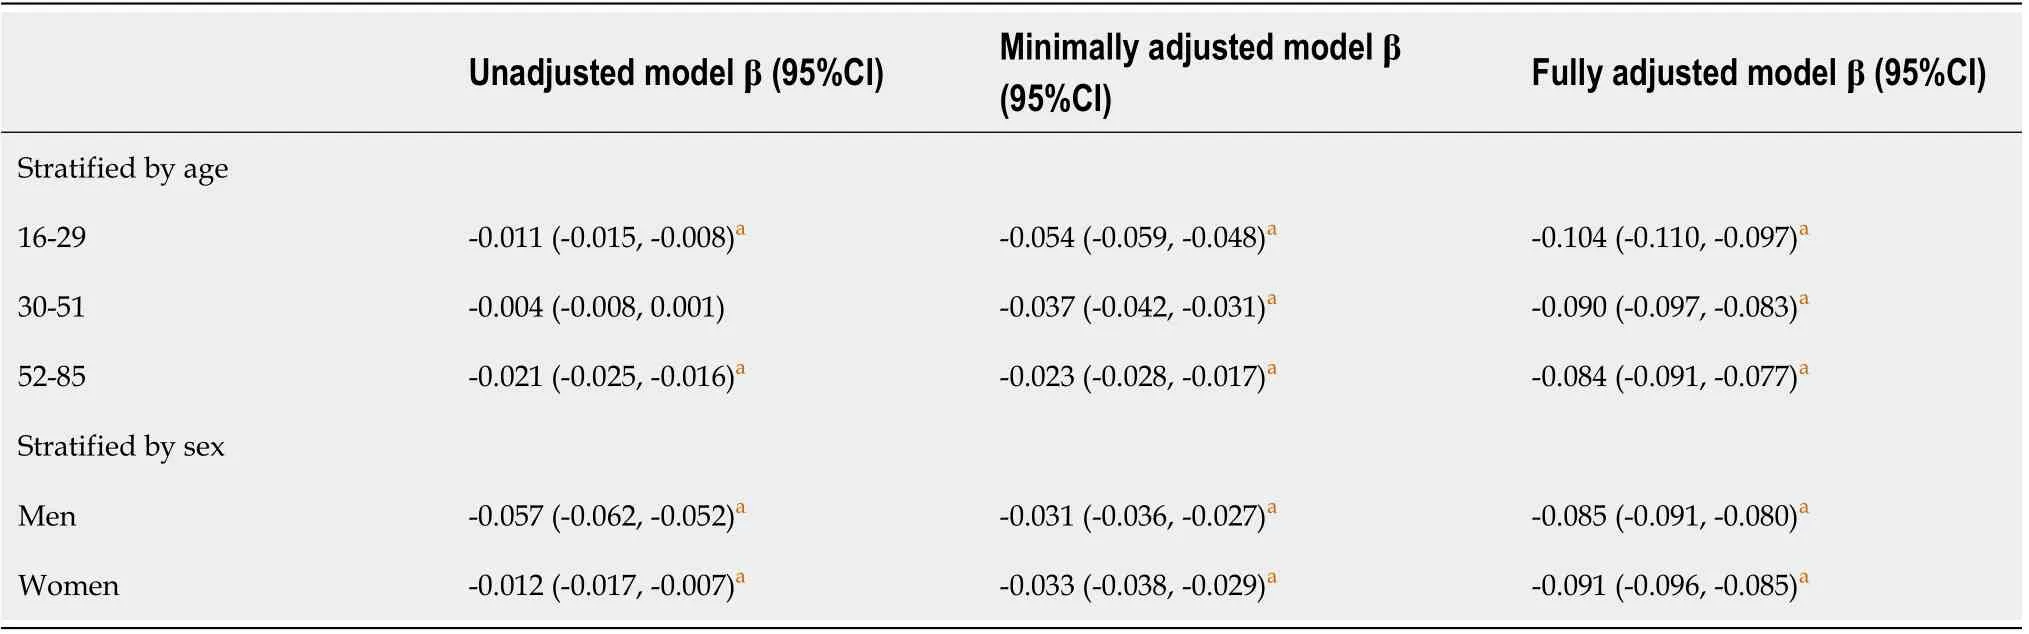
The correlation was still negative in the subgroup analysis classified by age(16-29 years,β = -0.011;95%CI:-0.015,-0.008;30-51 years,β = -0.004;95%CI:0.008,0.001;52-85 years,β = -0.021;95%CI:-0.025,-0.016)and sex(men,β = -0.057;95%CI:-0.062,-0.052;women,β = -0.012;95%CI:-0.017,-0.007)when the covariates were controlled.The results are presented in Table 3.The smooth curve fitting and generalized additive model further verified the negative correlation between the Hb and HbA1c levels(Figures 2-4).
DlSCUSSlON
In the present study,we examined numerous samples of American nondiabetic individuals aged ≥ 16 years to investigate the relationship between the Hb and HbA1c levels in the normal range.Our study showed that the Hb and HbA1c levels were negatively correlated in both men and women.
HbA1c is a GHb,which is a nonenzymatic reaction of glucose binding to Hb.HbA1c is considered as a better marker to evaluate the state of DM compared with blood glucose monitoring,and it is stable and able to represent the average blood glucose level over the past 2-3 mo.The HbA1c levels are affected by a large number of factors,such as race,RBC disorders,and hemoglobinopathies.
A large retrospective cohort study conducted by Grossman
included 11,352 individuals without diabetes and assessed the correlation between the Hb and HbA1c levels.The fifth highest Hb level of HbA1c individuals was significantly lower than that of the other fifth of individuals,and the correlation between the Hb and HbA1c levels was negligible[8].However,Lai
[9]found that in 1659 Chinese nondiabetic adults aged 20-49 years,the normal Hb levels were negatively correlated with HbA1c.
mother took her to the kitchen. She filled three pots with water and placed each on a high fire. Soon the pots came to a boil. In the first, she placed carrots, in the second she placed eggs and in the last she placed ground coffee beans. She let them sit and boil without saying a word. In about twenty minutes, she turned off the burners. She fished the carrots out and placed them in a bowl. She pulled the eggs out and placed them in a bowl. Then she ladled the coffee out and placed it in a bowl.
In our study,we found that the correlation between the Hb and HbA1c levels was obviously negative in the unadjusted model.When minimal adjustments to sex and age were made in the regression model and when the model further adjusted for the estimated value of the HbA1c level to exceed 10 covariates,the association was still significant.Our results were generally consistent with those of Lai
[9]’s studies on Chinese populations.
Things really started to fall into place() when a friend had told me that his dad - who played Santa Claus at various charitable functions in my area - would be willing to make a visit on Christmas morning to our home to deliver my Katie her presents! Knowing that my parents would be there as well, I began to get ready for what would turn out to be one of the most memorable9 days of my mother s life.
CONCLUSlON
In conclusion,our results show that in the nondiabetic American population aged ≥ 16 years,the Hb levels were negatively correlated with the HbA1c levels within the normal range in both men and women.The Hb levels were independent and negatively related to the HbA1c levels.
ARTlCLE HlGHLlGHTS
Research background
To elucidate the relationship between Hb and HbA1c.
Research motivation
To elucidate the relationship between Hb and HbA1c in a nondiabetic population aged ≥ 16 years in America.
Research objectives
The relationship between hemoglobin(Hb)and hemoglobin A1c(HbA1c)remains unclear.
Alas! yes, madam, she answered, and if you will but cure him, you may take me back to the farm, or bring the Green Giant to life again, and you shall see how obedient I will be
Research methods
The relationship was estimated using a multivariate regression.
Research results
Hb levels are negatively correlated with HbA1c.
Research conclusions
From a clinical point of view,HbA1c decreases by 0.08% for every 1 g/dL increase in Hb.
Research perspectives
Normal Hb levels are negatively correlated with HbA1c in nondiabetic Americans aged ≥ 16 years.
FOOTNOTES
Bai XF sorted out the data and wrote the draft;Wang H and Zhao QL revised the article.
The authors declare that they have no competing interests.
The data that support the findings of this study are openly available by contacting the corresponding author.
This article is an open-access article that was selected by an in-house editor and fully peer-reviewed by external reviewers.It is distributed in accordance with the Creative Commons Attribution NonCommercial(CC BYNC 4.0)license,which permits others to distribute,remix,adapt,build upon this work non-commercially,and license their derivative works on different terms,provided the original work is properly cited and the use is noncommercial.See:https://creativecommons.org/Licenses/by-nc/4.0/
China
Xiao-Fang Bai 0000-0002-8799-1809;Huan Wang 0000-0001-6078-7835;Qiao-Ling Zhao 0000-0002-7121-3578.
Zhang H
A
Zhang H
1 Conway BN,Han X,Munro HM,Gross AL,Shu XO,Hargreaves MK,Zheng W,Powers AC,Blot WJ.The obesity epidemic and rising diabetes incidence in a low-income racially diverse southern US cohort.
2018;13:e0190993[PMID:29324894 DOI:10.1371/journal.pone.0190993]
2 Anders S,Schroeter C.Diabetes,diet-health behavior,and obesity.
2015;6:33[PMID:25852643 DOI:10.3389/fendo.2015.00033]
3 Harreiter J,Roden M.[Diabetes mellitus-Definition,classification,diagnosis,screening and prevention(Update 2019)].
2019;131:6-15[PMID:30980151 DOI:10.1007/s00508-019-1450-4]
4 Nathan DM;DCCT/EDIC Research Group.The diabetes control and complications trial/epidemiology of diabetes interventions and complications study at 30 years:overview.
2014;37:9-16[PMID:24356592 DOI:10.2337/dc13-2112]
5 Emerging Risk Factors Collaboration,Di Angelantonio E,Gao P,Khan H,Butterworth AS,Wormser D,Kaptoge S,Kondapally Seshasai SR,Thompson A,Sarwar N,Willeit P,Ridker PM,Barr EL,Khaw KT,Psaty BM,Brenner H,Balkau B,Dekker JM,Lawlor DA,Daimon M,Willeit J,Nj?lstad I,Nissinen A,Brunner EJ,Kuller LH,Price JF,Sundstr?m J,Knuiman MW,Feskens EJ,Verschuren WM,Wald N,Bakker SJ,Whincup PH,Ford I,Goldbourt U,Gómez-de-la-Cámara A,Gallacher J,Simons LA,Rosengren A,Sutherland SE,Bj?rkelund C,Blazer DG,Wassertheil-Smoller S,Onat A,Marín Iba?ez A,Casiglia E,Jukema JW,Simpson LM,Giampaoli S,Nordestgaard BG,Selmer R,Wennberg P,Kauhanen J,Salonen JT,Dankner R,Barrett-Connor E,Kavousi M,Gudnason V,Evans D,Wallace RB,Cushman M,D'Agostino RB Sr,Umans JG,Kiyohara Y,Nakagawa H,Sato S,Gillum RF,Folsom AR,van der Schouw YT,Moons KG,Griffin SJ,Sattar N,Wareham NJ,Selvin E,Thompson SG,Danesh J.Glycated hemoglobin measurement and prediction of cardiovascular disease.
2014;311:1225-1233[PMID:24668104 DOI:10.1001/jama.2014.1873]
6 Kalyani RR,Saudek CD,Brancati FL,Selvin E.Association of diabetes,comorbidities,and A1C with functional disability in older adults:results from the National Health and Nutrition Examination Survey(NHANES),1999-2006.
2010;33:1055-1060[PMID:20185736 DOI:10.2337/dc09-1597]
7 American Diabetes Association.2.Classification and Diagnosis of Diabetes:
.
2019;42:S13-S28[PMID:30559228 DOI:10.2337/dc19-S002]
8 Grossman A,Gafter-Gvili A,Schmilovitz-Weiss H,Koren-Morag N,Beloosesky Y,Weiss A.Association of glycated hemoglobin with hemoglobin levels in elderly nondiabetic subjects.
2016;36:32-35[PMID:27594416 DOI:10.1016/j.ejim.2016.08.024]
9 Lai Y,Lin Z,Zhu Z.Association between hemoglobin within the normal range and hemoglobin A1c among Chinese nondiabetes adults.
2021;21:35[PMID:33639896 DOI:10.1186/s12902-021-00704-x]
10 National Health and Nutrition Examination Survey(NHANES)data.[cited 19 Sep 2021].Available from:https://www.cdc.gov/nchs/nhanes/index.htm
11 Campbell L,Pepper T,Shipman K.HbA1c:a review of non-glycaemic variables.
2019;72:12-19[PMID:30361394 DOI:10.1136/jclinpath-2017-204755]
12 Beck RW,Connor CG,Mullen DM,Wesley DM,Bergenstal RM.The Fallacy of Average:How Using HbA
Alone to Assess Glycemic Control Can Be Misleading.
2017;40:994-999[PMID:28733374 DOI:10.2337/dc17-0636]
13 English E,Idris I,Smith G,Dhatariya K,Kilpatrick ES,John WG.The effect of anaemia and abnormalities of erythrocyte indices on HbA1c analysis:a systematic review.
2015;58:1409-1421[PMID:25994072 DOI:10.1007/s00125-015-3599-3]
 World Journal of Diabetes2022年3期
- World Journal of Diabetes的其它文章
- Beyond diabetes remission a step further:Post bariatric surgery hypoglycemia
- Free fatty acids,glucose,and insulin in type 2 diabetes mellitus
- Sodium-glucose co-transporter 2 inhibitors induced euglycemic diabetic ketoacidosis within four days of initiation
- Age at diagnosis of type 2 diabetes and cardiovascular risk factor profile:A pooled analysis
- Functional annotation and enrichment analysis of differentially expressed serum proteins in patients with type 2 diabetes after dapagliflozin
- Humanin and diabetes mellitus:A review of in vitro and in vivo studies