Degradation of tiamulin by a packed bed dielectric barrier plasma combined with TiO2 catalyst
2022-08-29 00:43:06KunYANG楊坤HongweiSHEN沈紅偉YueyueLIU劉月月YangLIU劉陽PingjiGE葛平基andDezhengYANG楊德正
Plasma Science and Technology 2022年9期
Kun YANG (楊坤), Hongwei SHEN (沈紅偉), Yueyue LIU (劉月月),Yang LIU (劉陽), Pingji GE (葛平基) and Dezheng YANG (楊德正)
1 School of Science, Shihezi University, Shihezi 832003, People’s Republic of China
2 Key Laboratory of Environmental Monitoring and Pollutant Control of Xinjiang Bingtuan, Shihezi University, Shihezi 832003, People’s Republic of China
3 Key Lab of Materials Modification, Dalian University of Technology, Ministry of Education, Dalian 116024, People’s Republic of China
Abstract
Keywords: packed bed dielectric barrier discharge, plasma catalyst, tiamulin (TIA) antibiotics degradation, degradation mechanism
1. Introduction
Antibiotics are widely used in livestock and aquaculture due to their efficacy in preventing and treating diseases caused by bacteria.However,environmental scientists have recently found recognized antibiotic residues as important emerging environmental pollutants, with the development of antibiotic resistance having adverse effects on ecology and human health [1].Therefore,from the perspective of environmental protection and human health, it is particularly important to remove antibiotic residues efficiently from soil[2].Recently,a variety of methods have been explored to mitigate environmental contamination by antibiotics, such as adsorption, catalytic degradation, biodegradation, photocatalytic degradation and advanced oxidation[3].These different approaches each have their own advantages and challenges.
Non-thermal plasmas (NTPs), which can produce active substances such as electrons, highly exited atoms, ions,radicals, molecules, shock waves and ultraviolet (UV) light,could be promising for removing pollutants [4]. As an environmentally friendly and efficient technology, plasma technology can be used in treating organic pollutants, remediating wastewater, reducing exhaust gas emission and treating solid waste [5]. Kim et al used a dielectric barrier discharge (DBD) plasma to degrade antibiotics in synthetic wastewater, and their results show that this technology can play an important role in the treatment of organic pollutants [6].
In recent years, plasma combined with catalyst has shown synergistic effects,effectively improving the efficiency of antibiotic degradation. Guo et al used a pulsed discharge plasma(PDP)to induce WO3to co-degrade cyclic propylene satin (CIP) in water. After 60 min of processing, 0.16 g l-1WO3increased the CIP removal rate from 71.3% to 99.6%[7]. Aziz et al studied the degradation of the drugs dichlorofenic acid and ibuprofen in aqueous solutions by ozone,photocatalytic and non-thermal plasma. They found that the synergy of several methods greatly improved the efficiency of drug degradation [8]. He et al studied the significant synergistic effect of nano-TiO2and corona discharge plasma in the degradation of tetracycline in aqueous solutions [9]. The packed bed method in DBD is also a major method that researchers often use to degrade organic pollutants [10, 11].Ma and Xu studied the degradation and kinetics of reaction of typical organophosphorus pesticides in a packed bed reactor.The degradation efficiency was 80%at 35 kV with a gas flow rate of 800 ml min-1and initial concentration of 11.2 mg l-1[12]. The results of previous studies have demonstrated that the efficiency of degradation of antibiotic residues can be improved by increasing the discharge voltage, frequency,thickness of the catalyst bed, etc.
Tiamulin (TIA) is an antibiotic widely used in pig breeding, and existing studies have shown that TIA in pig excrement will enter the soil and surface water along with excrement used as fertilizer, which will lead to the risk of resistance in the environment [13]. In this study, plasma generated by the discharge of a packed bed dielectric barrier reactor(PBR)driven by an AC power supply degrades solidphase TIA in combination with a catalyst.We have optimized the experimental parameters of degradation and derived the most likely path of TIA degradation. All the other operating parameters of the PBR plasma setup were kept fixed,such as the electrode gap, catalyst bed thickness and catalyst particle diameter; the treatment time, applied voltage, gas flow rate,working gas composition and catalyst whose effects on the degradation will be studied were varied. The mechanism and pathway of degradation were also analyzed.
2. Experiment
2.1. Experimental setup and apparatus
A schematic of the experimental setup used to degrade solidphase TIA is pictured in figure 1(a). It is designed for gassolid discharge and the overall system comprises four parts:the power supply system, the gas delivery system, the PBR and the analytical system.The peak voltage of the AC voltage source (CTP-2000P, Nanjing Suman Electronics Co. Ltd)with a center frequency of 14 kHz can be adjusted in the range of 0-35 kV. The flow rates of nitrogen and oxygen were controlled by two mass flow controllers (MFCs)to adjust the ratio of gas components. As shown in figure 1(a), the diagnostic system consisted of two main components:electric and optical diagnosis. A voltage probe (P6015A, Tektronix,75 MHz bandwidth) and current probe (TCP312, Tektronix,and 100 MHz bandwidth) are used to measure the applied voltage (Vd) and discharge current (Id) profiles, respectively.All the wave-forms are recorded by an oscilloscope(TDS5054B, Tektronix, 500 MHz bandwidth). The longitudinally adjustable fiber head is parallel to the surface of the electrode. The emission spectrometer (F-4500, Hitachi) that captures the optical emission from the discharge region transmitted through the optical fiber is a three-channel spectrometer that uses a grating as a beam splitter and a CCD array as a detector. It can measure wavelengths from 300-800 nm at 0.1 nm optical resolution. The concentrations of TIA during plasma treatment were assessed by UV-visible spectrophotometer (Cary 6000, Agilent, USA) in the wavelength range of 190-900 nm.
A PBR with a DBD was designed to investigate the effects of PBR treatment on degradation of TIA(figure 1(b)).The PBR consists of two coaxial layers of quartz tubes with inner and outer layers having an inside diameter of 4 mm and outside diameter of 15 mm and a length of 200 mm. The γ-Al2O3pellets loaded with TIA are placed in the middle of the two layers of quartz tubes. The discharge in this area forms the plasma of the dielectric barrier.A copper bar with a diameter of 3 mm used as the high-voltage electrode was inserted into the inner quartz tube by rubber plug fittings.The grounded electrodes comprised an iron net with winding length of 100 mm installed outside the outer quartz tube surface. The gas supply was administered through a gas inlet followed by gas ionization utilizing an electric field between two electrodes.The plasma produced by the discharge acts on the surface of the filler.
2.2. Material preparation
Solid-phase TIA was obtained from Zhejiang University Sunny Technology (Xinjiang, China). The initial concentration of TIA in the solution was measured before adsorption.The γ-Al2O3particles were then immersed and adsorbed for 20 min, then taken out and dried overnight. Two samples were prepared under the same conditions,one group was kept as a control and the other group was treated with plasma. In addition, the γ-Al2O3particles loaded with TiO2were prepared by a gel method, which supported TIA in the same way as described above.

Figure 1. (a) Schematic diagram of the experimental apparatus for degradation of TIA and (b) schematic illustration of the structure of the PBR.
2.3. Measurement
All the experiments were carried out at room temperature and ambient pressure. The efficiency of TIA degradation was calculated as follows:
whereC0refers to the initial concentration (mg l-1) andCtis the concentration of TIA at a given reaction time.
The Lissajous method was used to determine the power consumption. The total power consumption of the reactor is proportional to the area of the Lissajous diagram and can be calculated as [14]
whereCmis the measuring capacitance (μF),fis the frequency of alternating current (Hz) andAis the area of the Lissajous diagram.
The average discharge power and the energy efficiency of TIA degradation are calculated with the following equation:
wheremTIAis the quantity of TIA removed, P is the discharge power (W) and t is the discharge time (s).
The kinetic analysis of TIA degradation is carried out following first-order kinetic model, which is shown as follows:

whereC0andCthave the same definition as equation(1),kis the kinetic constant andtis the reaction time (s).
3. Results and discussion
3.1. Plasma characteristics of the PBR
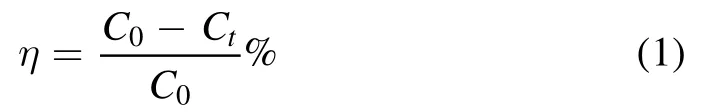
Figure 2. Discharge image of the PBR.
Figure 2 shows the discharge images in the PBR captured by a camera (Canon 5D mark IV, 500 ms exposure time) in the applied voltage range from 18 to 25 kV, with a gas flow rate of 1 l min-1, a discharge frequency of 14 kHz and an oxygen ratio of 1%.It is seen that microdischarge starts to occur after the appearance of the breakdown voltage. The uniform dispersion discharge can be seen in the photos.When the voltage is sufficiently high (>20 kV), a discharge with intense light emission begins in the electrode gap. The voltage-current characteristics confirm that the breakdown of gas in the DBD results in many current filaments called micro-discharges,which agrees with the image of the discharge in figure 2. The duration of the current filaments is 20 μs and the amplitude is 25 mA. This shows that the discharge in the PBR is still in filamentous discharge mode. This indicates that the energy transfer in each cycle is a sine function,the equivalent voltage and current per delivery can be integrated by the area of the region of corresponding state variables,and the input discharge power can be calculated from the latent relationship [15]. The discharge current filaments can be clearly observed when the discharge gap is broken down at 21 kV. The filament current with an amplitude of about 7 mA overlaps the displacement current. The duration of the discharge is about 30 μs in each half period. In this condition, the discharge is in filament discharge mode.The discharge current shows significant changes at 25 kV.Figure 3 illustrates the corresponding wave-forms of applied voltage and discharge current at a driving frequency of 14 kHz.From figure 3,the wave-forms of the discharge current and voltage illustrate the production of a large number of diffusive discharges in the discharge images. Improvement of discharge homogeneity enables the discharge to be evenly distributed in the discharge gaps and avoids the situation where most of the discharge area is not filled by plasma due to the uneven discharge in the filament mode. The stable and homogeneous discharge generated in the PBR is vital to the degradation of TIA, with obvious merits for enhancing degradation efficiency and energy efficiency, and has significant application prospects for soil remediation.
3.2. Selection of the initial concentration
In the early stage of this experiment, the adsorption concentration was detected as follows:with ultrapure water as the solvent, 20 ml TIA solutions with initial concentrations of 2 g l-1, 4 g l-1, 6 g l-1, 8 g l-1and 10 g l-1were prepared.Five pieces of γ-Al2O3pellets with a mass of 10 g (average particle size 1 mm)were placed into each initial solution to soak for 20 min for adsorption of TIA. The γ-Al2O3pellets were drained and placed in an oven set at 80°C for 10 h.After that,the pellets were put into 20 ml of ultrapure water for 30 min ultrasonic treatment and 10 min centrifugation (9000 rpm) for desorption.The supernatant in the centrifuge tube was removed,and its absorbance at 205 nm was measured with a UV spectrophotometer. The concentration can be determined by comparison with the standard curve for aqueous solutions of TIA.
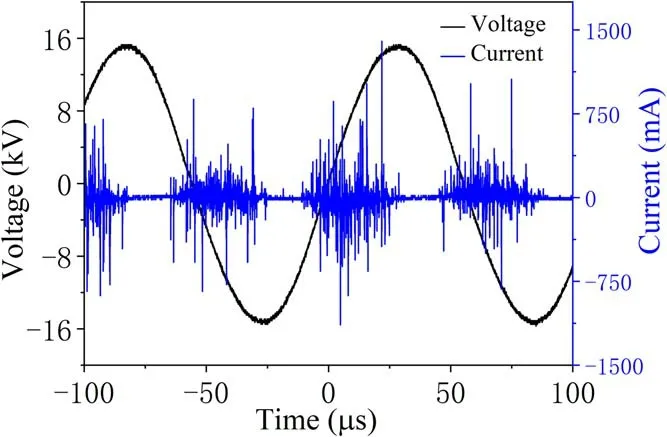
Figure 3.Typical wave-forms of applied voltage(Ut)and current(It).
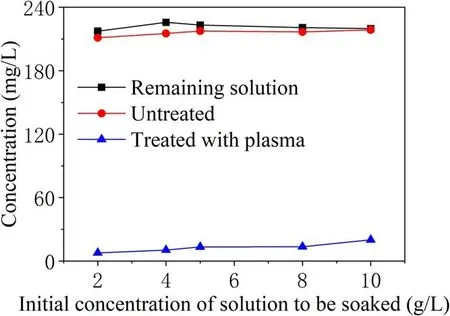
Figure 4.Adsorption and desorption experiments for γ-Al2O3 particles in different concentrations of TIA solution.
Figure 4 compares the concentration of the remaining solution after the addition of adsorbing particles to TIA solutions with different initial concentrations and the concentration of the desorbed solution before and after the particles were subjected to plasma discharge treatment. The concentration of the remaining solution after adsorption is close to the concentration after adsorption of TIA but not subject to plasma discharge.But after discharge treatment,the concentration is greatly reduced. The degradation of TIA by plasma produced by PBR is obvious. Judging from the changing trends of the three curves, the γ-Al2O3particles have reached adsorption saturation for the TIA solution with an initial concentration of 4 g l-1.The initial concentration of the solution selected to soak the sample was 4 g l-1, and the supernatant concentration of the sample after adsorption and desorption was 216.163 mg l-1.
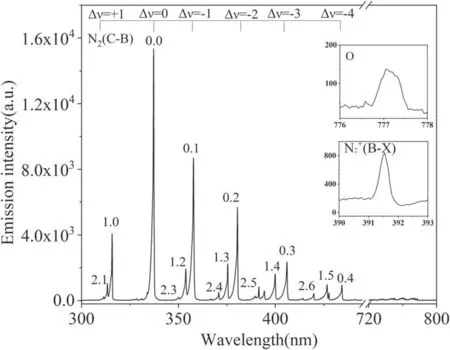
Figure 5.Emission spectrogram of the PBR.
3.3. The emission spectrum of the PBR
3.4. The effect of applied voltage on the degradation of TIA
During the discharge process,the applied voltage directly affects the number and intensity of physical and chemical effects such as active substances, high-energy electrons and ultraviolet light in the plasma [16]. Therefore, the voltage can affect the efficiency of TIA degradation as well as the catalytic activity of TiO2.As shown in figure 7,with increase in the applied voltage,the degradation efficiency from 23 to 26 kV shows an obvious upward trend, but after reaching 28 kV the growth tends to flatten.The degradation efficiency at 25 kV with added catalyst is 25% higher than that without catalyst. Plasma and catalyst show a good synergistic effect.For an applied voltage of 30 kV,a gas flow rate of 1 l min-1and an oxygen ratio of 1%,treatment with the PBR combined with TiO2catalyst for 5 min can achieve a TIA degradation efficiency of 97%.
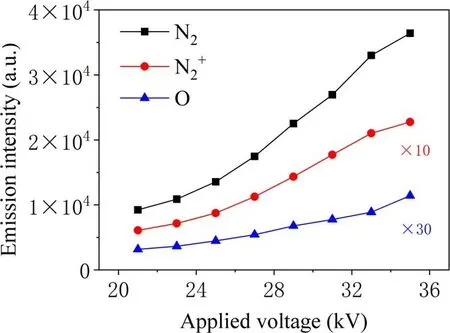
Figure 6.The intensity ofN2 , andO varies with the applied voltage.
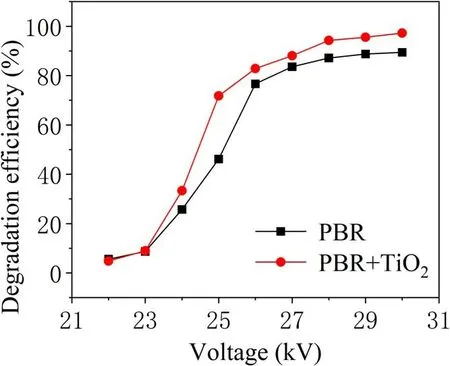
Figure 7.Effect of discharge voltage on TIA degradation efficiency.
With or without TiO2, the energy efficiency of TIA degradation at different voltages is analyzed under the same experimental conditions in figure 8.This shows an increasing trend from 22 kV which peaks at 26 kV. Then, a downward trend is observed with increase in the discharge voltage.When the applied voltage is 25 kV, the energy efficiency of PBR for TIA degradation is 0.46, and that of PBR combined with TiO2is 0.63.The latter displayed a distinct advantage in enhancing degradation. This is because as the discharge voltage increases more active substances are produced, but the number of TIA molecules in these regions did not change,resulting in decreased utilization of active materials. At the same time,with an increase in injected energy,more energy is used to form discharge by-products such as O2and NOxas well as a large amount of light and heat.In addition,from the analysis of the kinetic constants of the degradation process shown in figure 9,when the applied voltage is 25 kV,the firstorder reaction kinetic constants for the PBR system degrading TIA with and without TiO2are 0.25 min-1and 0.12 min-1,respectively. It is evident that in the high-voltage region, the reaction rate with the addition of catalyst has obvious advantages. This is because a higher applied voltage realized an improved activity and stability of the TiO2catalyst[17].At the same time, the UV light and heat generated during the discharge can also directly act on the TIA molecules and the TiO2catalyst to enhance the degradation effect [18].
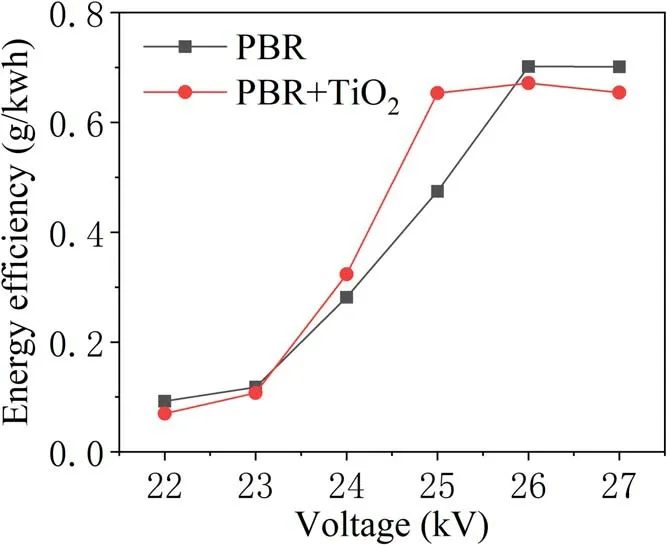
Figure 8.Variation of the energy efficiency of TIA degradation with applied voltage.
3.5. The effect of treatment time on degradation efficiency
The effect of treatment time on TIA degradation efficiency by DBD with and without TiO2is shown in figure 10. The experimental conditions are as follows: applied voltage 25 kV,gas flow rate 1 l min-1and oxygen ratio 1%.It can be seen from the experimental curve that the concentration of TIA decreases as the time of discharge treatment increases.When the treatment time was only 5 min,the efficiency of TIA degradation in PBR and PBR+TiO2reached 46.3% and 76.8%, respectively.However,the efficiency of TIA degradation increased to 90.7%and 95.2% when the treatment time was increased to 13 min.The experimental results show that the addition of catalyst can effectively improve the efficiency of TIA degradation in a short time. However, as the treatment time increases and energy continues to be injected,the number of TIA molecules gradually decreases the trend of increasing degradation gradually slows.
3.6. The effect of gas glow rate on the degradation of TIA
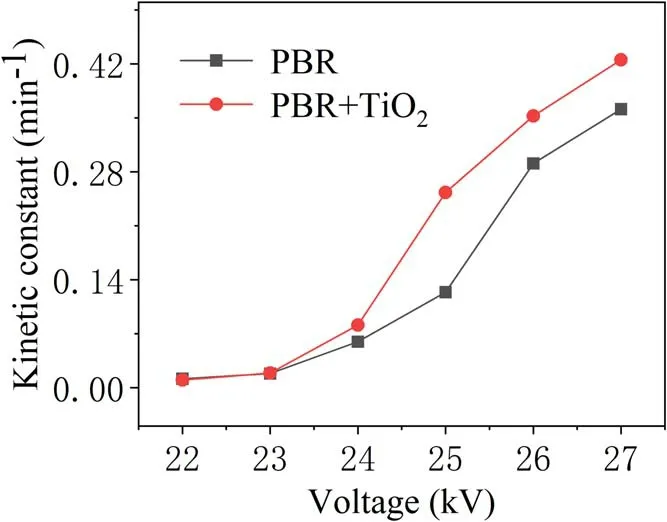
Figure 9.Variation of the kinetic constant of TIA degradation with applied voltage.

Figure 10.Variation of degradation efficiency with treatment time.
To investigate the effects of gas flow rate on the degradation of TIA,the reactions were conducted for various conditions of gas flow rate, but under the same degradation conditions, and compared with the catalyst-added reactions in figure 11.The working gases are nitrogen and oxygen,and the applied voltage is 25 kV,the oxygen ratio is 1%, and the treatment time is 5 min.Apparently, the gas flow rate strongly influences the removal efficiency. With increase in the gas flow rate, the efficiency of TIA degradation first increases and then decreases significantly.When the gas flow rate is 0.6 l min-1, the TIA degradation efficiency of PBR combined catalyst can reach 78.6%,which is 18.4% higher than that of PBR alone. The higher degradation efficiency would depend on increasing the amount of active material generated in the discharge area per unit area per unit time with increase in the initial gas flow. However, a continued rise in the gas flow rate leads directly to a decreased in the residence time, resulting in a reduced number of collisions between active particles and TIA molecules, thus reducing the degradation of TIA.
3.7. The effect of oxygen concentration on the degradation of TIA
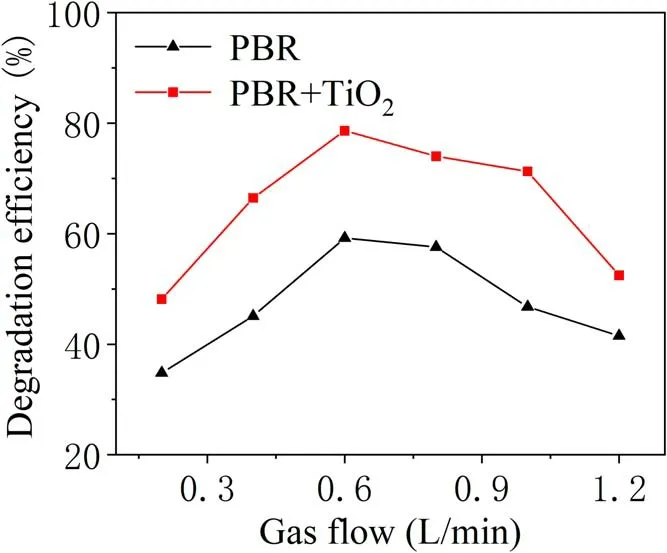
Figure 11.The effect of gas flow rate on efficiency of TIA degradation.

Figure 12.Effect of the oxygen concentration on the efficiency of TIA degradation.
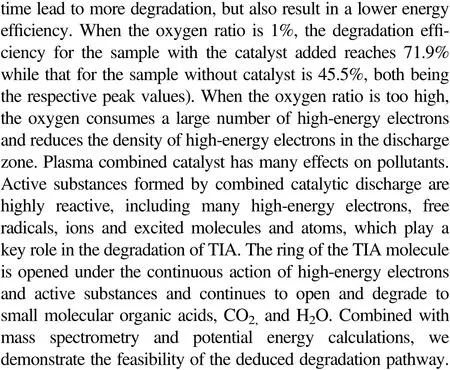
Figure 12 shows the effect of oxygen concentration on the efficiency of TIA degradation for an applied voltage of 25 kV,gas flow rate of 0.6 l min-1,discharge frequency of 14 kHz and treatment time of 5 min.This treatment was carried out under the same degradation conditions and compared with the results with the addition of catalyst. It can be seen that a higher TIA degradation efficiency was achieved in the presence of TiO2catalyst. The change in the oxygen concentration affected the efficiency of TIA degradation, and the trend of the graph resembles the curve of the catalyst-added results. When the oxygen ratio is 1%,the degradation efficiency of the sample with added catalyst reaches 71.9% compared with 45.5%without the catalyst, these being the respective peak values.However,when the proportion of oxygen is greater than 1%,the efficiency of TIA degradation decreases significantly with increase in the oxygen concentration.The addition of oxygen to nitrogen plasma may produce more gaseous reactive oxygen species and may also reduce the intensity of plasma as it is an electronegative gas. When the oxygen ratio is too high, it consumes a large number of high-energy electrons and reduces the density of high-energy electrons in the discharge zone. On the other hand,the increase in reactive oxygen species will lead to a decrease in active nitrogen, because some oxygen active substances can react with nitrogen active substances and this is not conducive to the degradation of TIA.

Figure 13.Variation in the intensity ofN2 , N+2 andO with the concentration of oxygen.

4. Exploration of the degradation mechanism
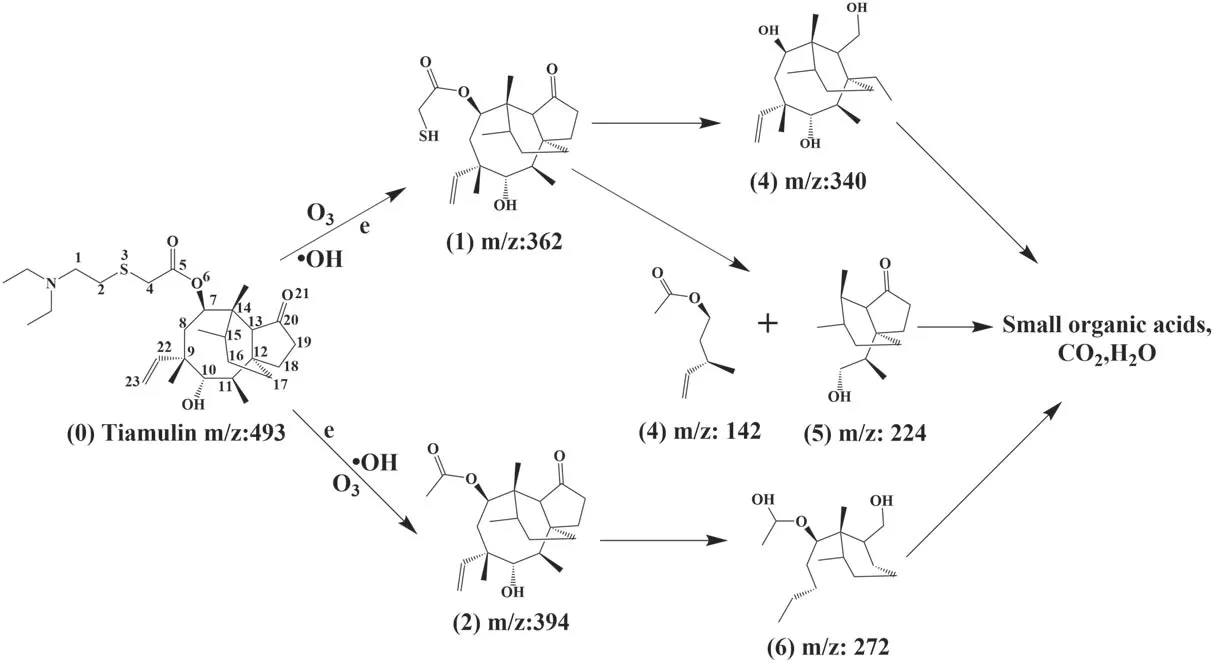
Figure 14.Derivation of possible pathways for TIA degradation.

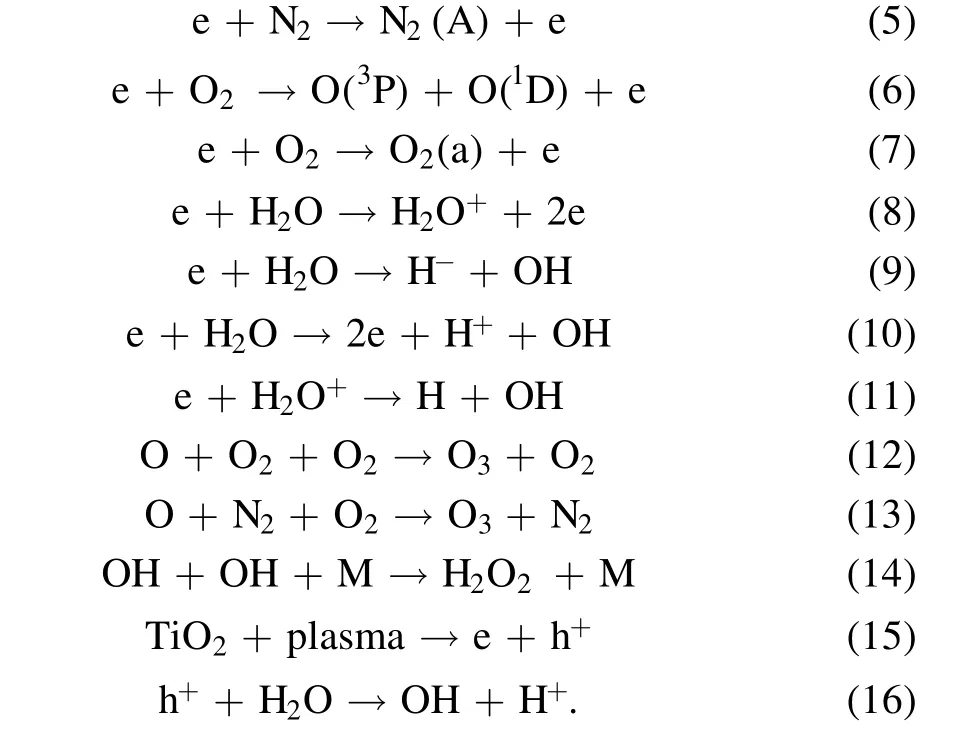
The experimental results show that the degradation efficiency for the sample with added TiO2catalyst is significantly higher than that for the sample without catalyst under the same experimental conditions, indicating that TiO2is excited to generate electron-hole pairs under plasma discharge, thereby producing more active materials.Whitehead and others believe that high-energy electrons are the main reason for the stimulation of TiO2to produce electron-hole pairs.At the same time,in the plasma discharge process gas molecules are ionized and excited under the action of a strong electric field. When the excited particles produced by ionization recombine or transition from the excited state to a lower energy level or ground state, a large amount of light energy radiates out, which also stimulates TiO2to generate electron-hole pairs [22]. Specifically, the working gas generally contains a small amount of moisture and various trace gases in addition to oxygen and nitrogen.After excitation of the electron-hole pairs on the TiO2attached to the surface of particles, the photon-generated electrons will react with oxygen in the water to form superoxide anion radicals, which interact with hydrogen peroxide and molecular oxygen species.At the same time,the holes will react with hydroxyl groups in the water to form hydroxyl radicals. Banaschik et al treated seven refractory drugs by a pulse plasma method. They studied the degradation kinetics and degradation pathways of dichlorobenzoic acid in detail and confirmed the important role of hydroxyl radicals and hydrogen peroxide in the decomposition of diclofenac [23]. The main reaction mechanisms of the plasma catalyst system are as follows [24-26]:
Spectroscopic and high-performance liquid chromatography-mass spectrometry (HPLC-MS) analyses were applied to analyze the feasible pathway for removal of TIA.The molecular formula of TIA is C28H47NO4S (m/z: 493),and it belongs to the class of macrolide antibiotics.Figure 14 proposes three possible reaction pathways for the reaction (numbers in brackets refer to the labeled processes in the figure). The molecular bonds of TIA are first bombarded by high-energy electrons. Due to the low bond energy (272 kJ mol-1), the S-C bonds break first [27].Under the action of active particles and excited molecules,including energetic electrons, neutral and excited molecules/atoms, (1) (m/z: 362) is produced by C-S bond breaking between C2and S3. Similarly, (2) (m/z: 394) is also formed by the rupture of the C-S bond between C4and S3. The esterification and reduction reaction of C5C6and the oxidation-reduction reaction of ketone at C20cause the rupture of C19and C20to form (3) (m/z: 340). The active particles in the solution release the ring tension of the eightmembered ring and break the C-C bond between C7and C14,C11and C12,forming(4)(m/z:142)and(5)(m/z:224).The C-S bonds continue to break and the C-C bonds between C9and C10and between C11and C12are broken with the opening of the eight-membered ring. After the opening of the five-membered ring,the side base of the short chain is removed and forms (6) (m/z: 272). With further interaction of these particles with the active oxidation groups, (3), (4), (5) and (6) are further degraded into small organic acids, CO2and H2O. The pathway of TIA degradation deduced above is clearly supported by the HPLC-MS results in figure 15.
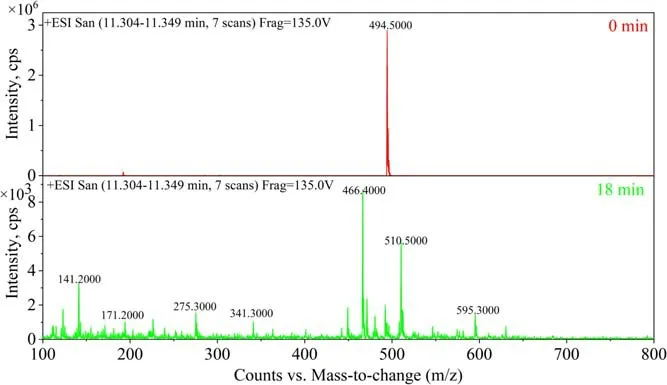
Figure 15.HPLC-MS for TIA degradation.
According to the characteristics of the TIA molecule and its interaction with high-energy electrons and active particles,the potential energy profile (PES) was calculated for the degradation path deduced above. This verified our speculations about the possible degradation path (figure 16).
5. Conclusion
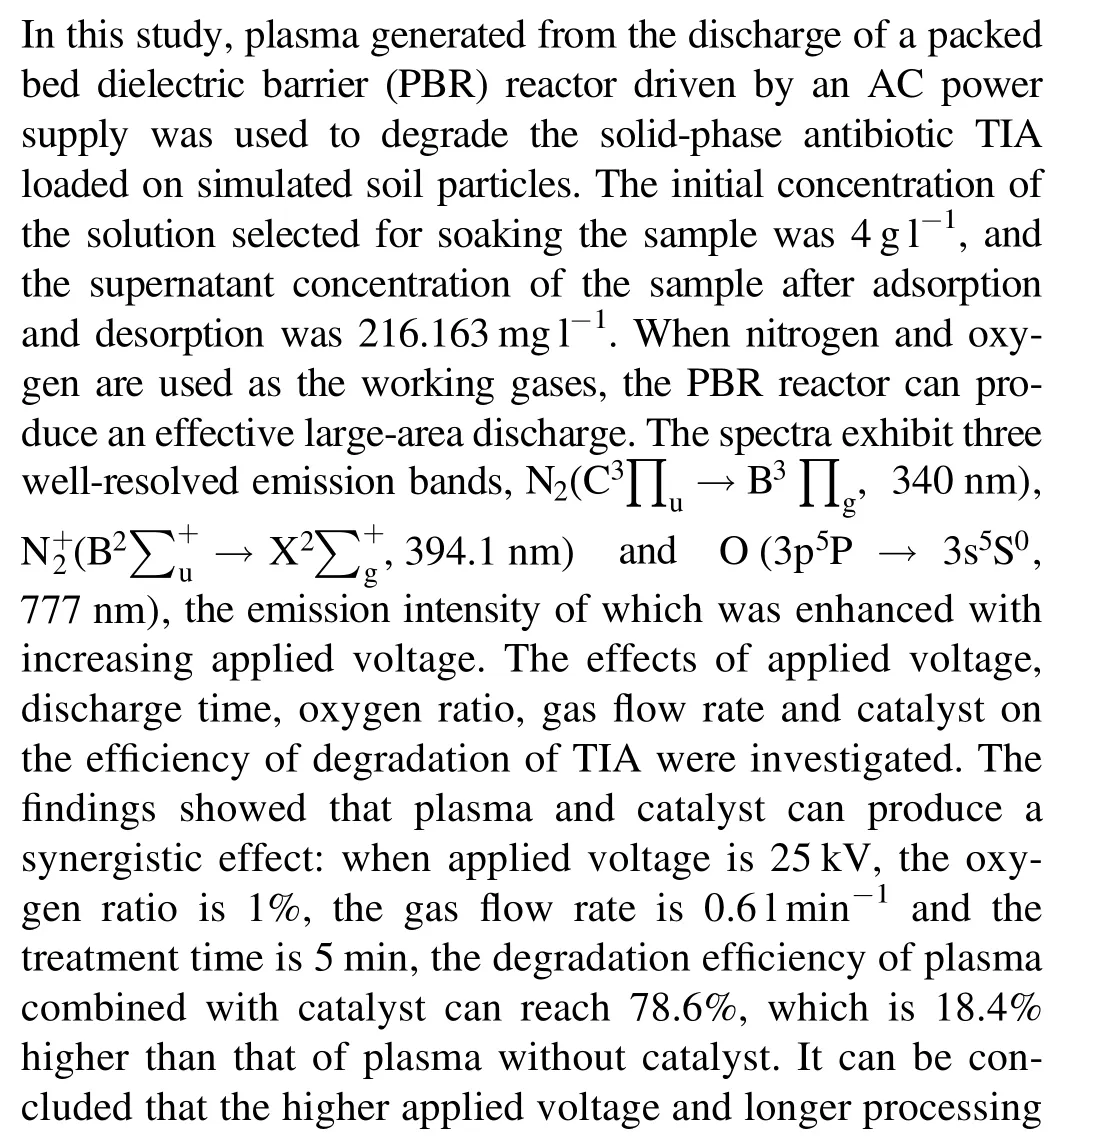
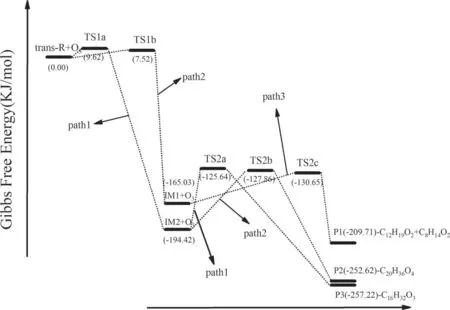
Figure 16.Profile of the potential energies of the reaction products.
Acknowledgments
This work is supported by National Natural Science Foundation of China (Nos. 51967018, 11965018 and 51967017),the Science and Technology Development Fund of Xinjiang Production and Construction (No. 2019BC009) and the Innovation and Development Special Project of Shihezi University (No. CXFZ202105).
 Plasma Science and Technology2022年9期
- Plasma Science and Technology的其它文章
- Implementation and application of PyNE sub-voxel R2S for shutdown dose rate analysis
- Microchannel cooling technique for dissipating high heat flux on W/Cu flat-type mock-up for EAST divertor
- Development of the pellet injection system on the J-TEXT tokamak
- Experimental study on surface arc plasma actuation-based hypersonic boundary layer transition flow control
- Efficient direction-independent fog harvesting using a corona discharge device with a multi-electrode structure
- Improvement of the spreading effect of atmospheric pressure microplasma jet treatment through shielding-gas-controlled focusing