Effects of moisture content and dry bulk density on the thermal conductivity of compacted backfill soil
2022-08-30 02:07:24YuhaoWUYanhaoFENGLiwuFANQingWANGXinSONGZitaoYU
Yu-hao WU ,Yan-hao FENG ,Li-wu FAN,2 ,Qing WANG ,Xin SONG ,Zi-tao YU,2
1Institute of Thermal Science and Power Systems,Zhejiang University,Hangzhou 310027,China
2State Key Laboratory of Clean Energy Utilization,Zhejiang University,Hangzhou 310027,China
3Institute of Soil Science,Chinese Academy of Sciences,Nanjing 210008,China
Data S1 Sampling sites and characterization methods
China has conducted two national soil censuses from 1958 to 1960 and from 1979 to 1985,which were generally based on townships and villages.On this basis,China’s soil classification system has been gradually established.According to the soil classification standard in China (AQSIQ and SA,2009),there are mainly ten typical soils in Zhejiang Province,including regosol,paddy soil,red soil,etcetera.Red soil accounts for about 70%,which is the most widely distributed (Wu et al.,2014).
Soils were sampled from ten different districts,counties or county-level cities in Zhejiang Province,including Anji,Lin’an,Yuhang,etcetera.The sampling sites were based on the second national soil census (NSISP,2019).Table S1 shows the specific differences of longitude and latitude between the second national soil census sites and the sampling sites.The current landform has undergone great changes compared to a few decades ago.In addition,soil sampling is required to avoid places that are difficult to excavate,such as paddy fields,mud pools and construction sites.Therefore,there are certain differences in longitude and latitude between the second national soil census sites and the sampling sites,and the absolute values of the differences do not exceed 0.04°.The appearance of the soil samplesis shown in Fig.S1.
Table S1 Comparison of longitude and latitude between the second national soil census sites and sampling sites
Table S2 Original measurement data of density and thermal conductivity of soil samples
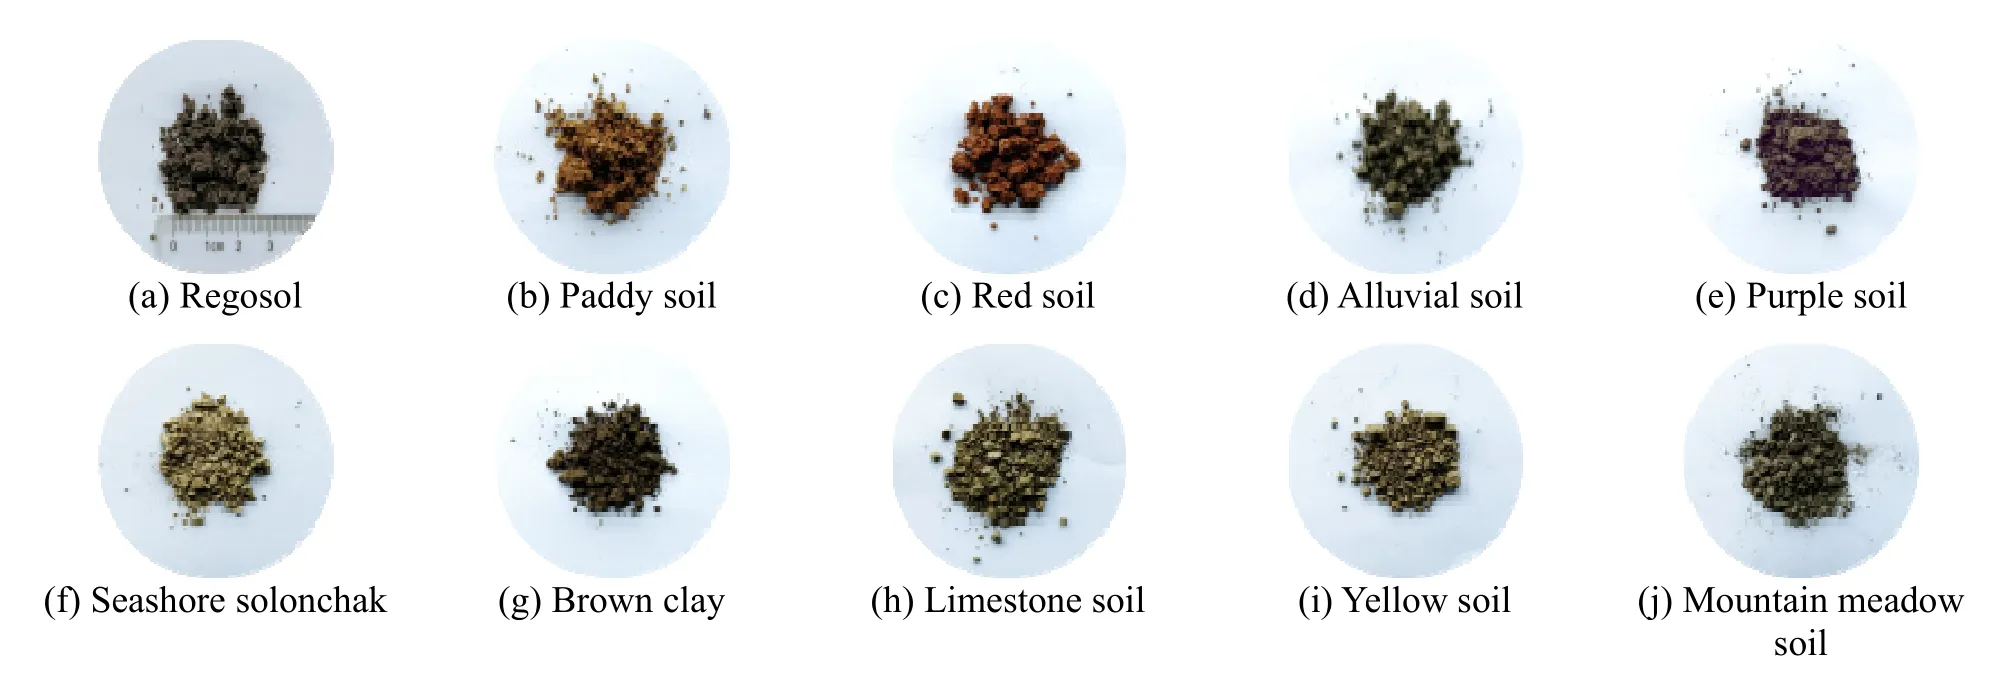
Fig.S1 Appearance of typical soil samples in Zhejiang Province,China
To classify the soils by texture,the particle size distribution was characterized by a TM-85 soil densitometer,which is based on the principle of soil layered deposition in water according to particle size(MOHURD,2019).To analyze the effect of chemical composition on soil thermal conductivity,the mass percentage of minerals and organic matters were characterized respectively by X-ray diffraction method and dichromate titration-external heating method.X-ray diffraction was used to obtain the diffraction pattern of soil samples by X-ray,followed by a comparison of the diffraction characteristics,such as peak type peak intensity and D-value,with the standard mineral types,so as to judge the mineral type and content in the samples (Xu et al.,2020).Dichromate titration-external heating method is to use excess potassium dichromate-sulfuric acid solution to oxidize soil organic carbon under heating conditions,titrate the excess potassium dichromate with standard ferrous sulfate solution,and then calculate the organic matter content in soil samples according to the amount of potassium dichromate consumed and a series of correction coefficients(MOA,2006).
Data S2 Definition of compaction degree
Compaction degree is divided into absolute compaction degreeC
and relative compaction degreeC
,and its definition is based on dry bulk densityρ
.Dry bulk densityρ
refers to the ratio of the mass of the soil solid phasem
to the total soil volumeV
,which reflects the compactness of the solid phase.The fully compacted dry bulk densityρ
of the soil is different at each moisture content.Soil samples could be fully compacted at each moisture content through the method of Proctor compaction test (MOHURD and AQSIQ,2019).Then the relationship curve between fully compacted dry bulk densityρ
and moisture contentθ
is drawn withρ
as the ordinate andθ
as the abscissa,which is also called Proctor curve(Menaceur et al.,2021).The ordinate and abscissa of the peak point on the curve represent the maximum fully compacted dry bulk densityρ
and the optimal moisture contentθ
of the soil,respectively.Geotechnical engineering defines absolute compaction degreeC
as the ratio of dry bulk densityρ
to maximum fully compacted dry bulk densityρ
(MOHURD and AQSIQ,2019).Similarly,relative compaction degreeC
is defined as the ratio of dry bulk densityρ
to fully compacted dry bulk density at the current moisture content.The definition formulae of the vital parameters mentioned in this paragraph are shown in Eqs.(S1)~(S3).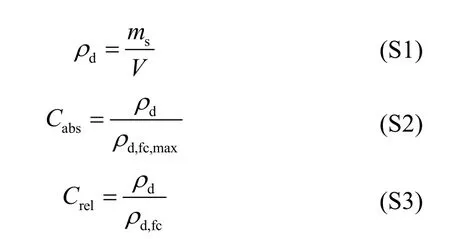
In order to make the research results significant to the engineering guiding,the relative compaction degree of soil samples was strictly controlled rather than the dry bulk density.Soil samples in this study were fully compacted by the provisions of the Proctor compaction test mentioned above.In other words,although the dry bulk density of each soil sample was different,the relative compaction degree reached 100%.Except for a few cases,the absolute compaction degree was greater than 85%,which basically met the provisions about the absolute compaction degree of subgrade backfill soil (MOT,2019).
Data S3 Apparatus and procedures of soil thermal conductivity measurement
The soil sample is filled in the cylindrical container,whose top cover has several position holes for probe insertion.The water bath case with a manageable temperature range 0~100 ℃ is used to control the temperature of the soil sample in the cylindrical container.The thermocouple connected with a temperature recorder is vertically inserted into the soil sample.The KD2 Pro thermal properties analyzer is based on the thermal probe technique of the transient measurement method,whose major advantages is effectively minimizing the effect of moisture migration on the temperature distribution of the soil sample (Xu et al.,2019).The principles of the thermal probe technique are detailed in references (Modi et al.,2014;Kim et al.,2014).
The TR-1 probe with 100 mm in length and 2.4 mm in diameter is suit for measuring the thermal conductivity of porous materials.The range of thermal conductivity measured by the TR-1 probe is 0.1~4.0 W/(m·K),and the errors are ±0.02 W/(m·K)at the range from 0.1 to 0.2 W/(m·K) and ±10% that from 0.2 to 4.0 W/(m·K) (DDI,2016).Note that the TR-1 probe should be fully contacted with soils since the thermal conductivity is calculated based on time and temperature of heat transfer process.In this sense,the length of the probe is a factor included in the thermal conductivity calculation of the KD2 Proinstrument.However,there is a stainless steel plate above the soil container as the top cover,which leads to a gap between the upper part of the probe and surface of the sample.The thickness of the plate is 1 mm,that is,the gap is only 1% of the length of the TR-1 probe.Therefore,compared to the systematic error (±10%) mentioned above,the error caused by the stainless steel plate could be ignored.When the moisture content is relatively high,moisture exchange will occur between the sample and the surroundings,which may cause an error even greater than the systematic error.In view of this,the stainless steel plate was utilized as the top cover to seal the cylindrical container and avoid moisture exchange.
The preparation of soil samples was carried out according to the steps as follows.(1) The soil was dried in an incubator at 105 ℃ for 8~12 h to evaporate all the natural water it contained.(2) The soil was ground thoroughly with a mortar.(3) Based on the target moisture content,a certain quality of water was added to the soil and then mixed evenly.(4) According to the provisions of Proctor compaction test,the soil was fully compacted with a compactor composed of a compaction casing with aninner diameter of 102 mm,a pile casing matching with the compaction casing and a cast iron hammer with a mass of 2.5 kg.Specifically,the soil in the compaction casing was compacted in three layers,and each layer was hammered 25 times.The hammer fell down freely from a height of 305 mm for each blow.
The measurement of soil thermal conductivity was carried out according to the steps as follows.(1)The soil sample was moved from the compaction casing into the cylindrical container carefully to avoid damaging its structure and changing its compaction degree.(2) The top cover was connected with the cylindrical container through the flange structure.(3) The TR-1 probe matched with the KD2 Pro and the thermocouple connected with the temperature recorder were both inserted into the soil sample through the position holes.(4) Waterproof tape was used to cover the gaps of apparatus connection to prevent moisture exchange,and also fix the position of the TR-1 probe and the thermocouple.(5) The container was placed in the water bath case and the temperature was set to the target value of 20 ℃.When the soil temperature measured by the thermocouple had been stable near the target temperature for more than 1 h,the thermal conductivity measurement could be carried out.(6)The time of each measurement was 5 minutes,and the interval between two adjacent measurements was supposed to be more than 15 minutes to ensure sufficient cooling of the probe,so as to reduce the measurement errors.In addition,errors were also reduced by measuring repeatedly,eliminating bad values,and changing the position hole where the TR-1 probe inserted in for each measurement.
Data S4 Original measurement data
Data S5 Procedures and results of regression analysis
First,a correlation analysis was adopted to screen out the main parameters affecting soil thermal conductivity.Under the condition that the significance levelα
equals to 0.05,the correlation analysis results between various parameters and the thermal conductivity of fully compacted soils are shown in Table S3.The coefficient Ris the Pearson product moment correlation coefficient.It is obvious that the moisture content and dry bulk density have a strong positive correlation with soil thermal conductivity,while texture and chemical composition have a relatively weak correlation with soil thermal conductivity.In addition,texture and chemical composition are the natural properties of soils and are not easy to change,while moisture content and dry bulk density are easy to change by external conditions.Then,on the basis of the above correlation analysis,a regression analysis based on moisture content
θ
and dry bulk densityρ
as theindependent parameters was adopted to summarize the prediction formulae.It should be noted that,due to the discrepancies of thermal conductivity among various types of soils,it is more meaningful to propose the prediction formula for the thermal conductivity of a certain category rather than for each specific soil for engineering involving soil backfilling.Thus,formulae for two categories of fully compacted soils were summarized.The formula for clay loam and loam was based on all the data of paddy soil,red soil,purple soil,seashore solonchak,brown clay and mountain meadow soil,while that for sandy loam and loamy sand was based on all the data of regosol,alluvial soil and limestone soil.The data of yellow soil was not involved in the regression analysis because of the huge discrepancy between its chemical composition and thermal conductivity with the other nine typical soils.It is considered that the confidence of the model reaches 95% when the P-value of all the regression coefficients in the fitting formula are less than 0.05.However,in the fitting formulae obtained by binary linear regression withθ
andρ
,the P-value of some regression coefficients is slightly greater than 0.05.Thus,the final formulae in Table S3 are based on the binary linear regression withθ
andρ
,that meet the confidence requirements and have a coefficient of complex determination Rexceeds 0.9.The formulae in Table S3 are applicable to compacted backfill soils which have the similar texture classification and chemical composition to the typical soils in this study.Other results of the binary linear regression analysis are shown in Table S4.Table S3 Results of correlation analysis between various parameters and soil thermal conductivity
Table S4 Results of binary linear regression analysis
 Journal of Zhejiang University-Science A(Applied Physics & Engineering)2022年8期
- Journal of Zhejiang University-Science A(Applied Physics & Engineering)的其它文章
- Copyright Information
- Activeflow co ntrol of S-duct by plasma synthhetic jet
- Active flow control of S-duct by plasma synthetic jet
- Experimental study of the bearing capacity of a drainage pipe pile under vacuum consolidation
- How fast is it to city centers?The average travel speed as an indicator of road traffic accessibility potential
- Flow control characteristics of the digital and mechanical redundancy control electric modulation valve