Computational simulation of ionization processes in single-bubble and multi-bubble sonoluminescence
2022-11-21 09:39:22JinFuLiang梁金福DeFengXiong熊德鳳YuAn安宇andWeiZhongChen陳偉中
Chinese Physics B 2022年11期
Jin-Fu Liang(梁金福) De-Feng Xiong(熊德鳳) Yu An(安宇) and Wei-Zhong Chen(陳偉中)
1School of Physics and Electronic Science,Guizhou Normal University,Guiyang 550025,China
2Department of Physics,Tsinghua University,Beijing 100084,China
3Institution of Acoustics,Nanjing University,Nanjing 210093,China
The most recent spectroscopic studies of moving-single bubble sonoluminescence(MSBSL)and multi-bubble sonoluminescence(MBSL)have revealed that hydrated electrons(e-aq)are generated in MSBSL but absent in MBSL.To explore the mechanism of this phenomenon, we numerically simulate the ionization processes in single- and multi-bubble sonoluminescence in aqueous solution of terbium chloride (TbCl3). The results show that the maximum degree of ionization of single-bubble sonoluminescence(SBSL)is approximately 10000 times greater than that of MBSL under certain special physical parameters. The hydrated electrons(e-aq)formed in SBSL are far more than those in MBSL provided these electrons are ejected from a bubble into a liquid. Therefore,the quenching of e-aq to SBSL spectrum is stronger than that of the MBSL spectrum. This may be the reason that the trivalent terbium [Tb(III)]ion line intensities from SBSL in the TbCl3 aqueous solutions with the acceptor of e-aq are stronger than those of TbCl3 aqueous solutions without the acceptor of e-aq.Whereas the Tb(III)ion line intensities from MBSL are not variational, which is significant for exploring the mechanism behind the cavitation and sonoluminescence.
Keywords: sonoluminescence,Tb(III)ion emission,hydrated electrons,ionization processes
1. Introduction
Single-bubble sonoluminescence (SBSL) is a phenomenon wherein light is emitted during the intense collapse of a single isolated gas bubble driven by a strong ultrasound wave.[1]In contrast,multi-bubble sonoluminescence(MBSL)is the light emission from the intense collapse of clouds of bubbles in liquids by high-intensity ultrasound.[2]At present,it is generally considered that both SBSL and MBSL result from extremely high temperature and pressure conditions that occur during the intense compression heat of gas and vapor in a collapsing bubble.[3–13]
Under such extreme conditions,chemical reactions occur at the inner of the bubble, that is, sonochemistry.[14]Further,the products of the chemical reaction are ejected into the solution from the bubble and may generate subsequent new products,which may affect the characteristics of the spectrum obtained from sonoluminescence (SL),[5,9]sonochemiluminescence(SCL),[15]and sonophotoluminescence(SPL).[16,17]


2. Theoretical model
2.1. SBSL theoretical model
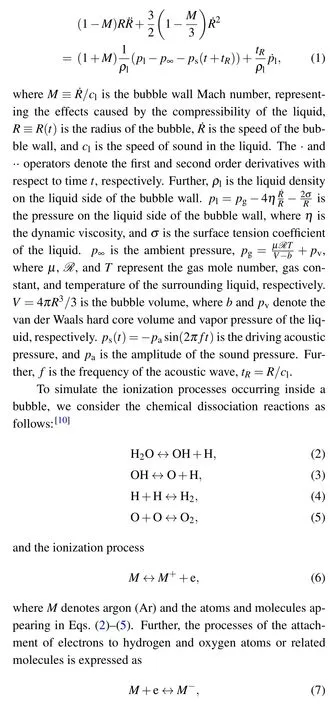
The SBSL model employed herein is similar to that reported in previous studies.[10,21–23]The dynamic computation of the sonoluminescent bubble motion involves solving the equation of radial motion of the bubble wall, which is referred to as Keller–Miksis(KM)equation,in conjunction with the fluid mechanics equation, the formula of water evaporation and vapor condensation at the bubble wall,and the energy equation in liquid for exterior temperature evaluation.
The KM equation describes the radiation motion of the bubble wall,[24,25]expressed as
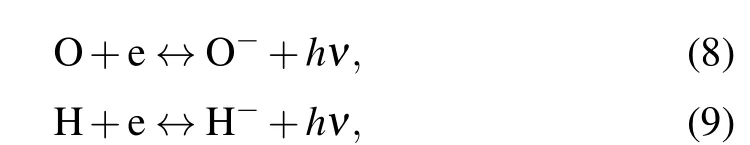
whereM-represents the negative ions O-,H-,O-2,and OH-.The law of mass action can be used to evaluate the number density of the products of the chemical dissociation and ionization electrons,as well as the positive and negative ions.The processes of the radiative attachment of electrons to atoms or molecules or ions are expressed as
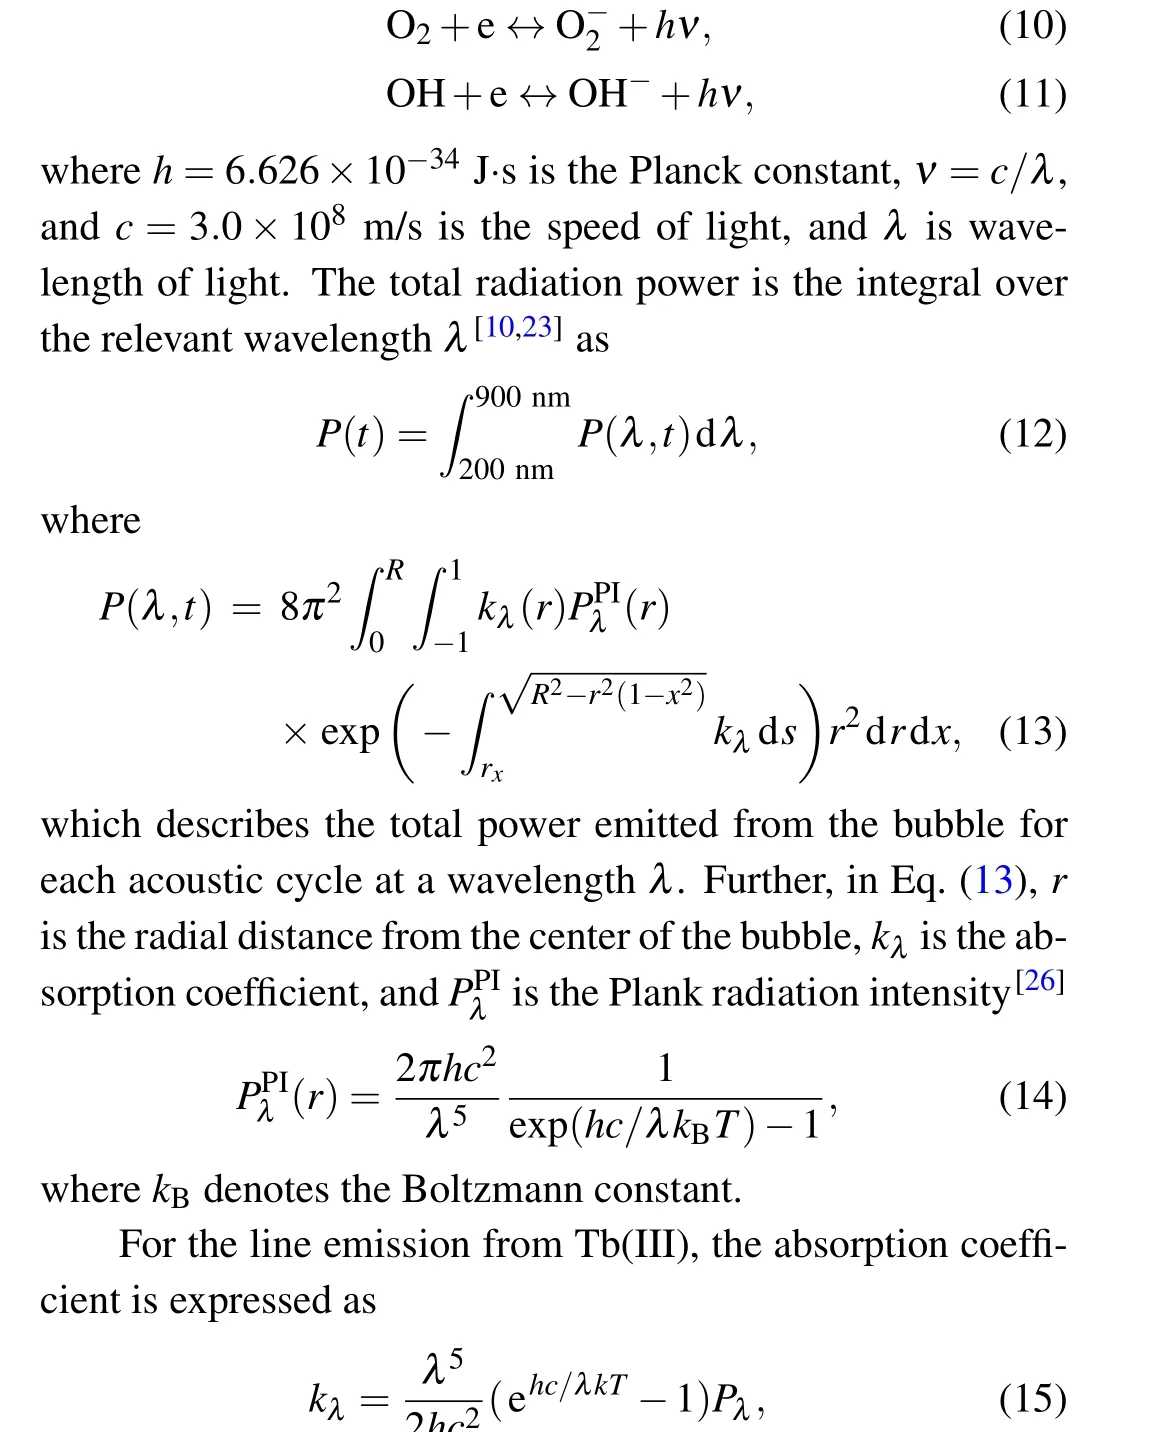
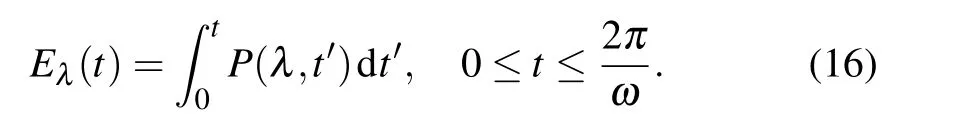
wherePλrepresents the radiation power per unit volume per unit wavelength interval of the line spectrum. Herein, we mainly consider the5D4→7FJ(J=6,5,4,...,0)transitions of Tb(III).
In addition, Eq. (16) expresses the cumulative radiation energy emitted from a sonoluminescent bubble over time 0 totwithin each acoustic period as
2.2. MBSL theoretical model
A bubble in the MBSL construct may pulse at one location over an acoustic period, even though it is subjected to the pressure from other bubbles. The wall of a bubble among dense cavitation bubbles is determined by using the modified KM equation[28]
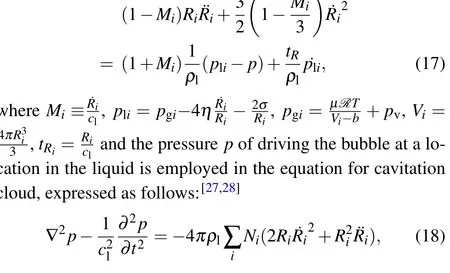
whereNiis the number density of cavitation bubbles with the initial radiusRi0. Based on the Eqs. (17) and (18), we can obtain the pressure distribution by numerical calculation. The pressure driving the bubble at a location in liquid is derived approximatively. In present paper,we consider that the MBSL and SBSL constructs have the same chemical dissociation reactions and ionization processes in a bubble.
3. Results and discussion
In the present study,certain parameters in the experiment conducted by Sharipov[20]were referenced in the numerical calculation. Table 1 lists the parameters used.

Table 1. Parameters used in the numerical simulation.
3.1. Plasma in a single sonoluminescent bubble
To understand the process of plasma formation in the SBSL bubble,we simulated the light emission pulse inside an Ar bubble in an aqueous solution of TbCl3at 0°C,driven by an acoustic pressure of 1.34 atm.
Figure 1(a) illustrates the total radiation power per flash of the simulated bubble. Five moments (points marked A–E) were selected on the cure to evaluate the temperature[Fig. 1(b)], corresponding pressure [Fig. 1(c)], radiation energy spectra [Fig. 1(d)], and the number density of various particles inside a bubble[Fig.2]. Figure 1 depicts that as the radiation power increases from A to D[Fig.1(a)],the temperature[Fig.1(b)]and pressure[Fig.1(c)]inside the bubble,as well as the intensity of the continuum background, increase;the OH, Ar+, and Tb(III) spectral peaks gradually disappear[Fig.1(d)].
Because the radiation energy spectrum accumulates over time,the total intensity increases at each moment. In addition,at every moment, the maximum temperature generates at the center of bubble, and intense decreases at the wall of bubble[Fig.1(b)]. While the pressure inside the bubble is almost uniform[Fig.1(c)]. The reason may be the effects caused by the thermal conductivity of gas and compressibility of the liquid.
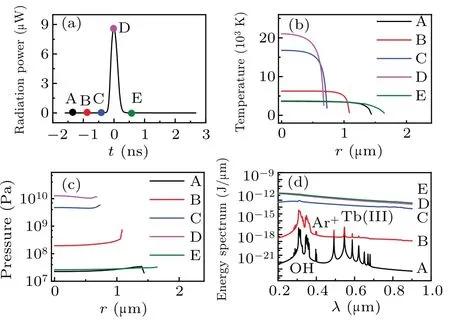
Fig.1. Simulation results for an Ar bubble in a TbCl3 aqueous at 0 °C,driven by an acoustic pressure amplitude of 1.34 atm. (a) Radiation power of the bubble versus time. (b) Temperature. (c) Pressure. (d)Energy spectrum.
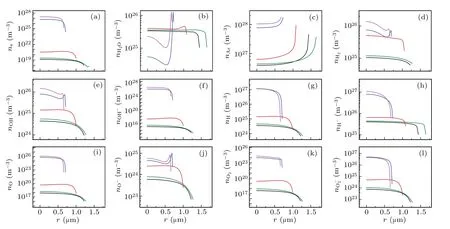
Fig.2. Spatial profiles of the calculated number densities of various particles filled circles in Fig.1(a). (a)e-,(b)H2O,(c)Ar,(d)H2,(e)OH,(f)OH-,(g)H,(h)H-,(i)O,(j)O-,(k)O2,and(l)O-2. The black,red,blue,megenta and olive lines corresponds to A,B,C,D,and E in Fig 1(a),respectively.
Figures 2 illustrates the spatial variations of the number densities of the various particles inside a bubble. Inside the bubble,except for those of the H2O molecules[Fig.2(b)]and Ar atoms[Fig.2(c)],the maximum number densities of other particles occur at the center of the bubble throughout the cycle,and subsequently decreases precipitously in the vicinity of the bubble wall.
To illustrate the generating in SBSL in TbCl3aqueous solution, the ionized electron density should be considered by assuming that the reaction process occurs during water sonolysis,[20]

The ionized electron density was positively correlated with temperature. When the bubble reached its maximum temperature of approximately 21000 K [corresponding to the D megenta line in Fig.1(b)],the ionized electron density reached approximately 2×1027m-3[Fig.2(a)].
3.2. Plasma in a bubble among sonoluminescencing multibubble
Firstly, we calculated the evolution of the pressure field and bubble radii with time[Fig.3]in the MBSL condition using Eqs. (17) and (18). For simplicity, we consider only one bubble, with an ambient radius ofRi0. The number density(Ni) of bubbles is homogeneous in the TbCl3aqueous solution. The calculation method was similar to that described in previous studies.[29,30]
Figure 3 presents the evolution of pressure and bubble radius with time at three locationsN1(r,z)=(0,0.2 cm),N2(0.5 cm, 0.2 cm), andN3(0, 0.7 cm) shown in Fig. 4. The pressure was periodically pulsed with an ultrasound frequency of 20 kHz[Figs.3(a),3(b),3(e),3(f),3(i),and 3(j)]. Further,the radius of the bubble in the MBSL exhibits period motion
wherein the bubble expands,intensely collapses,and bounces with an ultrasound frequency of 20 kHz[Figs.3(c),3(d),3(g),3(h), 3(k) and (l)]. Additionally, the pressure peak of each pulse corresponds to the minimum radius of the collapsing bubble, which is exhibited in the fluctuation of the pulsation of the bubble. This indicates that the same type of bubbles are in synchronous resonance near the horn tip(approximately 1 cm).
To determine the region of MBSL in the sound field, we estimated the light intensity of the sonoluminescent bubble by introducing a specific value,Rmax/Ri0. Here,Rmaxrepresents the maximum radius of a bubble driven by the sound field.Generally,SBSL can be observed by the naked eye whenRmax/Ri0≥5. However, in this study, we introduced this ratio to estimate the area of the MBSL.[29,30]Figure 4 illustrates that when 0≤z ≤0.6 cm,and 0≤r ≤0.5 cm,light emission can be observed from the bubbles in the acoustic field region.
We used an existing method[10,29,30]to illustrate the ionization processes in one sonoluminescent bubble among the cavitation bubbles. The light pulse, number densities of various particles, and degree of ionization (α) inside a bubble at different locations in the sound field were also calculated.
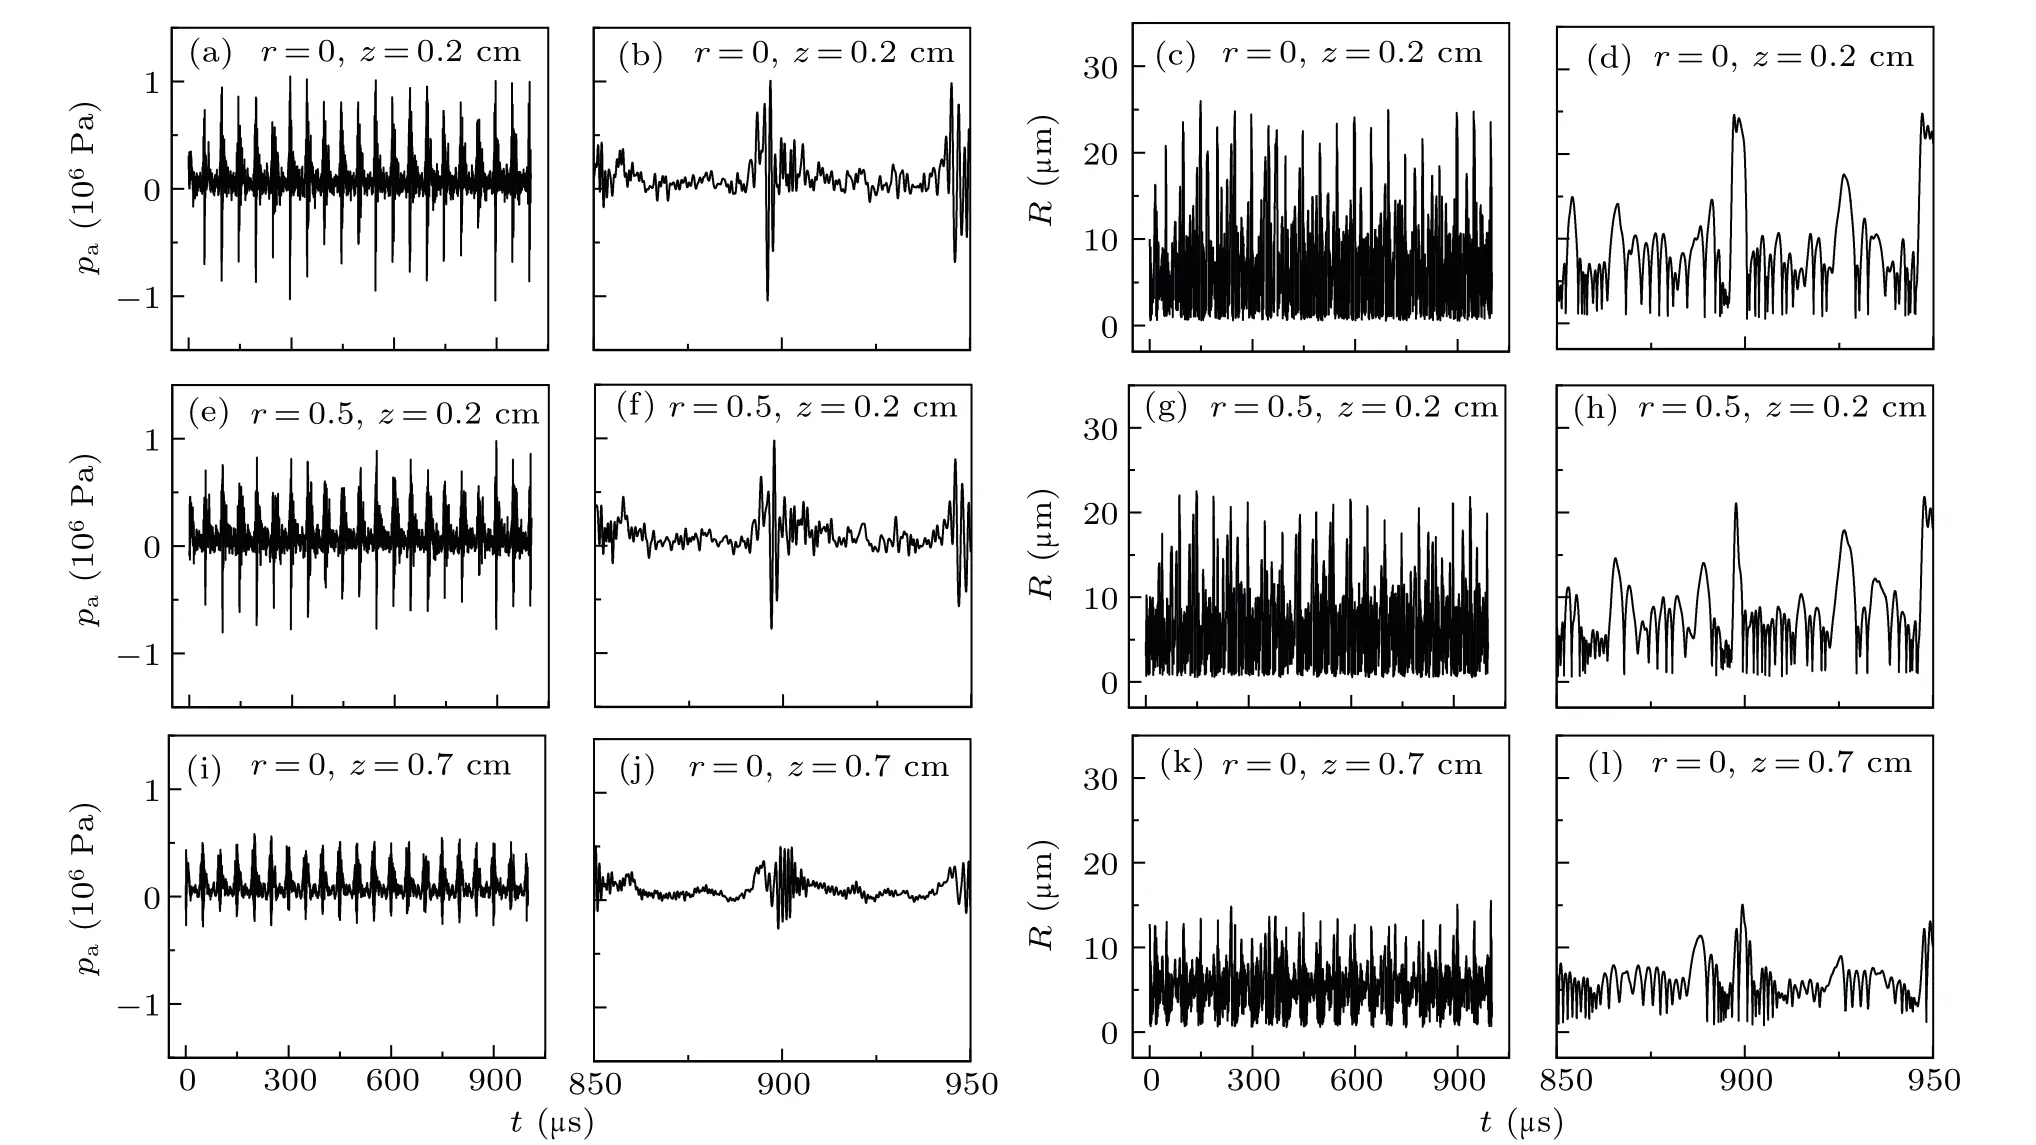
Fig. 3. Evolution of acoustic pressure and bubble radius with t. Results at location (a)–(d) N1 (r=0, z=0.2 cm), (e)–(h) N2 (r=0.5 cm,z=0.2 cm),and(i)–(l)N3 (r=0,z=0.7 cm).

Fig.4. Contour of close to the horn. The magenta cycles correspond to locations N1 (r=0,z=0.2 cm),N2 (r=0.5 cm,z=0.2 cm),and N3(r=0,z=0.7 cm).
Figure 5(a) illustrates the total radiation power per flash of the bubble at locationN1(r,z)=(0,0.2 cm) in the sound field, and five moments (points marked A–E) were selected to evaluate the temperature [Fig. 5(b)], pressure [Fig. 5(c)],radiation energy spectrum [Fig. 5(d)], and the corresponding number densities of various particles [Fig. 6]. In Fig. 6, except for those of the H2O molecules[Fig.6(b)]and Ar atoms[Fig. 6(c)], the maximum number densities of other particles occur at the center of the bubble throughout the cycle,and subsequently decreases precipitously in the vicinity of the bubble wall. SBSL also exhibited a similar phenomenon [Fig. 2].When the bubble reached its maximum temperature of approximately 21000 K [Fig. 5(b)], the ionized electron density reached approximately 2×1027m-3[D megenta line in Fig. 6(a)]. If these electrons are ejected into the solution to combine with H2O,e-aqis formed in the solution. However,in the experiment, the e-aqwas absent when analyzing the spectrum lines of Tb(III) ions. This is probably because most of the bubbles are broken when they cannot reach their minimum radii, and the temperature inside cannot attain a sufficient value to ionize more electrons. The experimental data presented in a previous study[31,32]concluded that the temperature inside the bubble in MBSL in water reaches approximately 5000 K, which approaches to the temperature at moment point C, as depicted in Fig. 5(a). At point B, the ionized electrons are approximately 6×1024m-3[red line in Fig.6(a)].
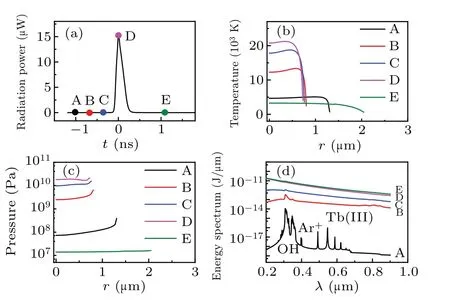
Fig. 5. Simulation results of an argon bubble at the location N1 (r = 0,z = 0.2 cm) during the 18th acoustic cycle (850–900 s) demonstrated in Fig. 3(b). The number density of Tb(III) ions is n×10-5. n is the total number density of particles inside a bubble. (a)Radiation power of the bubble versus time. (b)Temperature. (c)Pressure. (d)Energy spectrum.
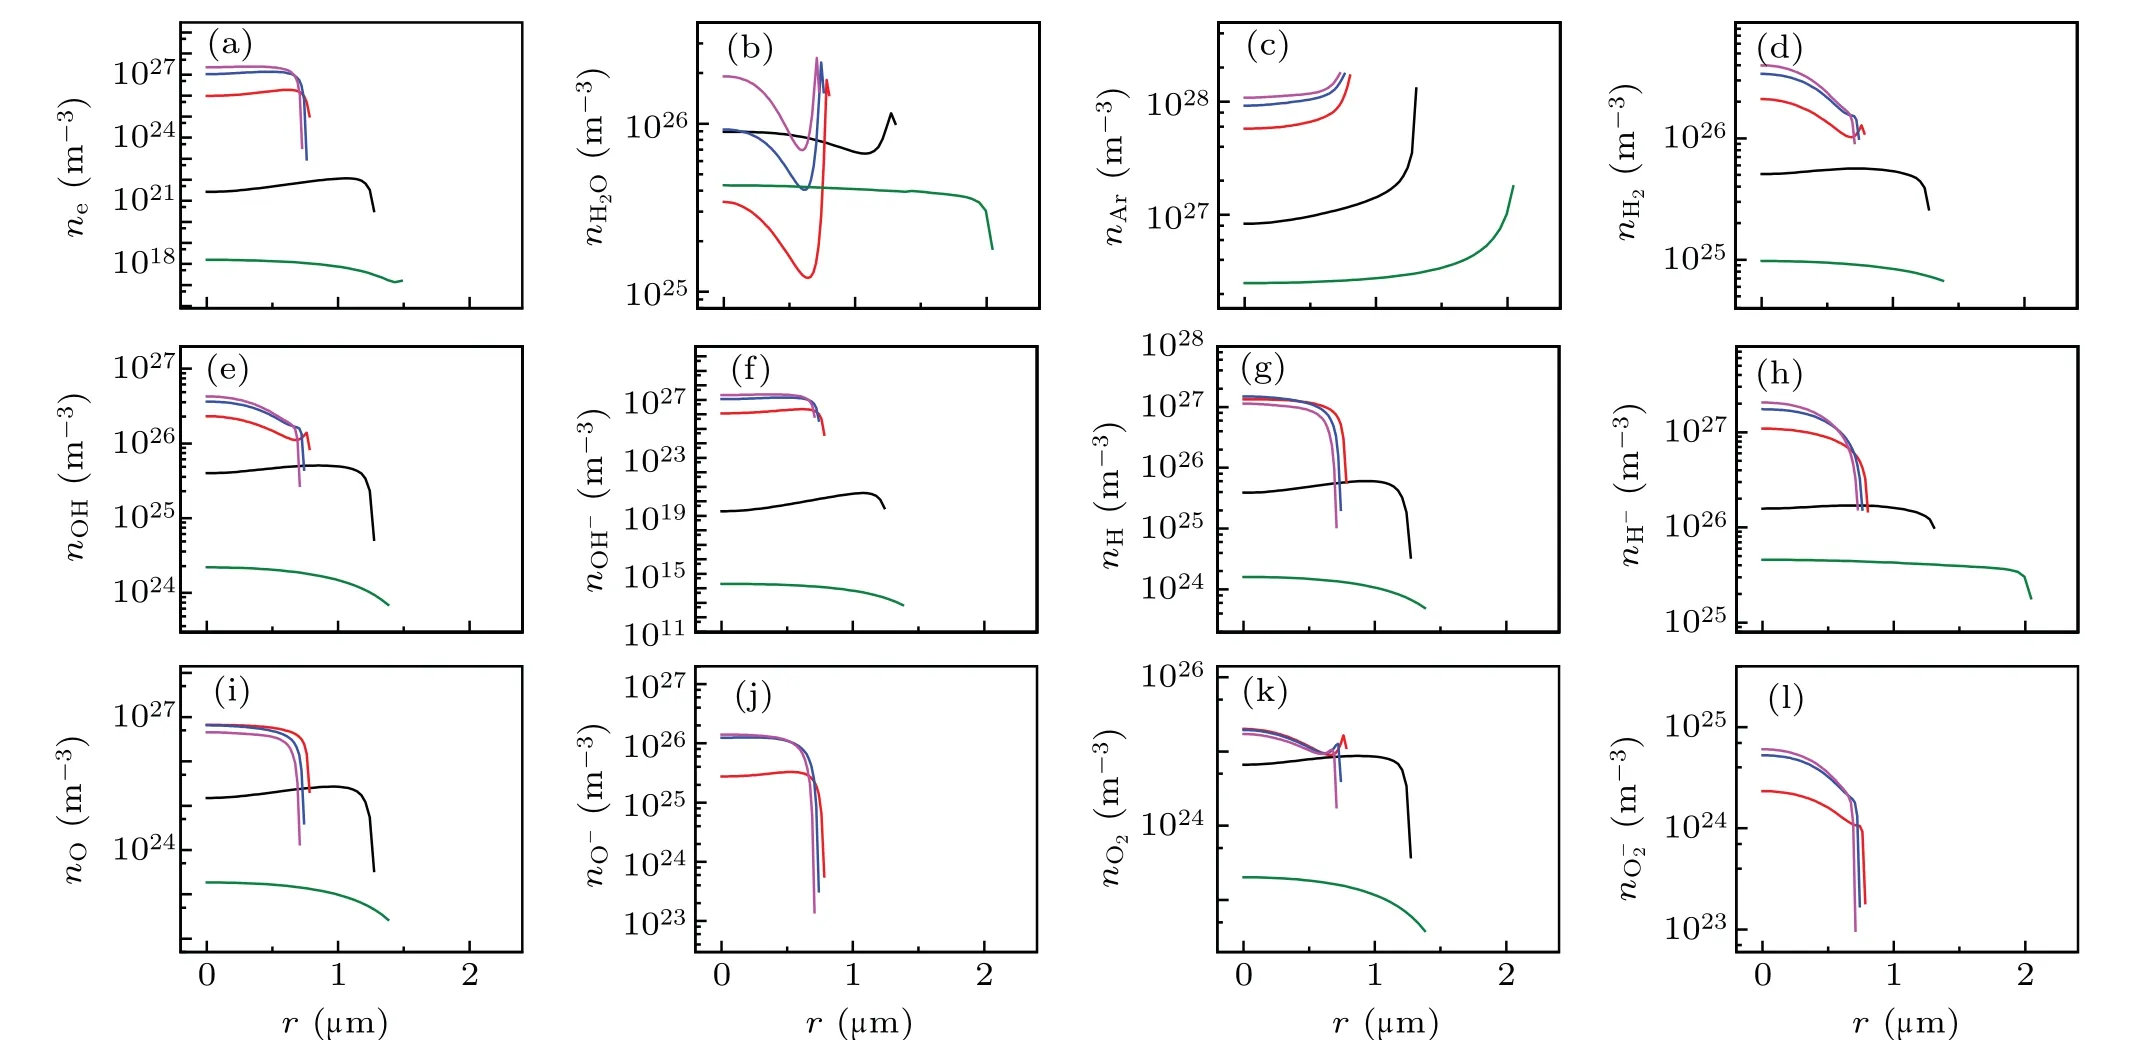
Fig.6. Spatial profiles of the calculated densities of various particles at the given points of A,B,C,D,E denoted by filled circles in Fig.5(a). (a)e-,(b)H2O,(c)Ar,(d)H2,(e)OH,(f)OH-,(g)H,(h)H-,(i)O,(j)O-,(k)O2,and(l)O-2. The black,red,blue,megenta and olive lines corresponds to A,B,C,D,and E in Fig 5(a),respectively.
To further explore the plasma inside a bubble at other locations in the sound field, we simulated the light emission pulse, temperature, pressure, radiation energy spectra, and the number density of various particles inside an Ar bubble at two locationsN2(r,z)=(0.5 cm,0.2 cm) andN3(0,0.7 cm). Figures 7 and 8 illustrate the case for the bubble atN2(r,z)=(0.5 cm,0.2 cm).
Figure 7(a) demonstrates the total radiation power per flash of the bubble, and five moments (points marked A–E)were selected to evaluate the temperature [Fig. 7(b)]), pressure[Fig.7(c)],radiation energy spectrum[Fig.7(d)],and the corresponding number densities of various particles [Fig. 8].Figure 7(b) depicts that the maximum temperature inside the bubble is approximately 5800 K,approaching the experimental value of 5000 K,as reported in previous studies.[31,32]The corresponding maximum ionization electrons were approximately 4×10²²m-3[megenta line in Fig. 8(a)], which is approximately 104times less than that in SBSL [bule line in Fig.2(a)].

Fig.7.Simulation results of an Ar bubble at the location N2(r=0.5 cm,z = 0.2 cm) during the 18th acoustic cycle (850–900 s) depicted in Fig. 3(f). The number density of Tb(III) ions is n×10-5. (a) Radiation power of the bubble versus time. (b)Temperature. (c)Pressure. (d)Energy spectrum.
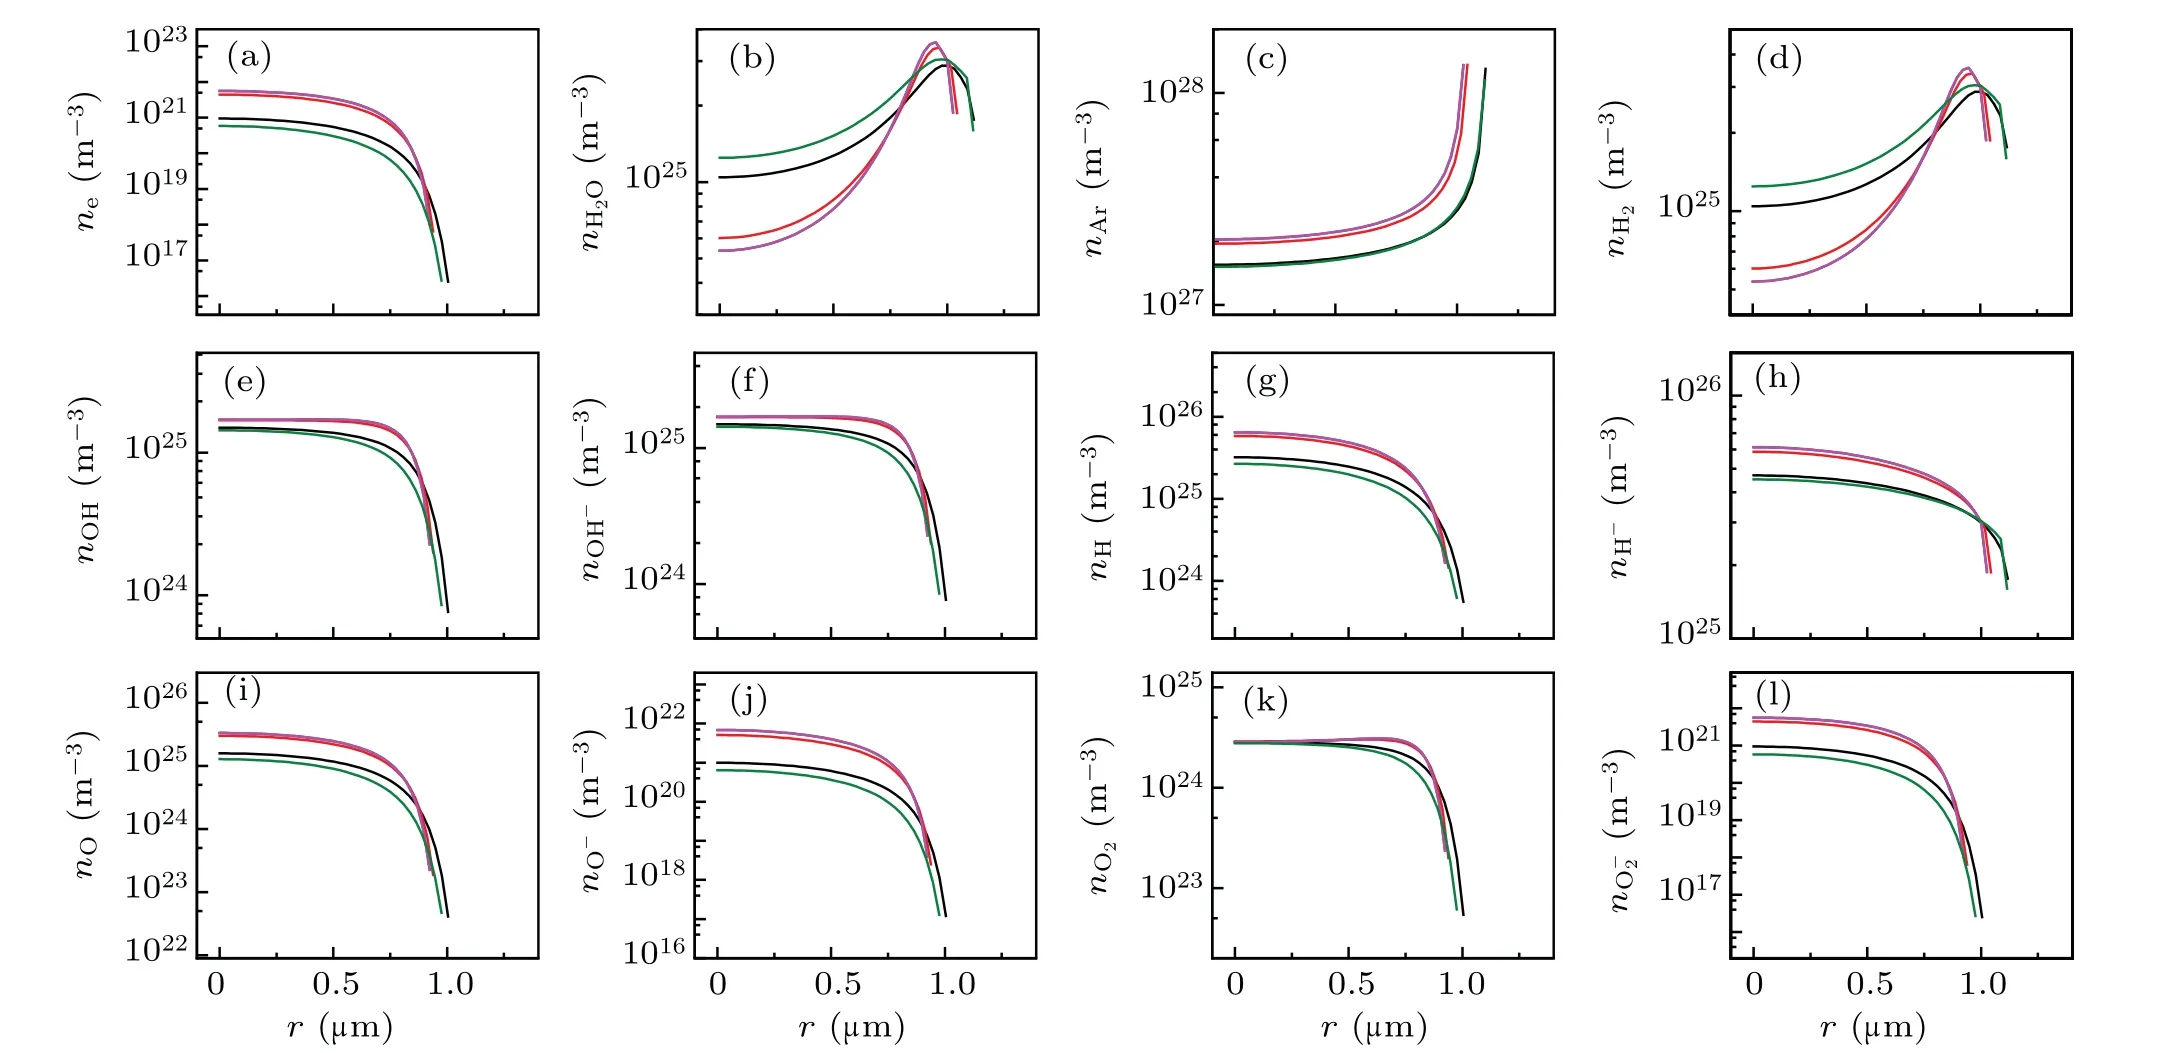
Fig.8. Spatial profiles of the calculated densities of various particles at the given points of A,B,C,D,E denoted by filled circles in Fig.7(a).(a)e-,(b)H2O,(c)Ar,(d)H2,(e)OH,(f)OH-,(g)H,(h)H-,(i)O,(j)O-,(k)O2,and(l)O-2. The black,red,blue,megenta and olive lines corresponds to A,B,C,D,and E in Fig 7(a),respectively.
Figures 9 and 10 illustrate the case where the bubble is at the locationN3(r,z)=(0,0.7 cm). Figure 9(a) shows the total radiated power per flash of the bubble,and five moments were selected (points marked A–E) on the curve to evaluate the temperature[Fig.9(b)],pressure[Fig.9(c)],radiation energy spectrum [Fig. 9(d)], and the corresponding number of densities of various particles, which is similar to the cases of the bubbles located at the pointsN1(0, 0.2 cm) andN2(0.5,0.2 cm). As depicted in Fig. 9(b), the maximum temperature inside the bubble was approximately 3800 K, less than the experimental value of 5000 K,[31,32]and the corresponding maximum ionized electrons were approximately 2×10²⁰m-3[megenta line in Fig.10(a)].
To further understand the ionization processes inside a bubble, we calculated the degree of ionization (α) in SBSL and MBSL. Figures 11(a) and 11(b) showαat different moments for SBSL and MBSL at locationN1(0,0.2 cm),respectively. The maximumαoccurs at the center of the bubble throughout the cycle,and subsequently decreases in the vicinity of the bubble wall.
Figure 12 illustrates the spatial profiles ofαat the maximum temperature corresponding to the minimum radius of the bubble for SBSL and at locationsN1(0,0.2 cm),N2(0.5,0.2 cm), andN3(0, 0.7 cm) in the sound field generating MBSL.As depicted in Fig.12,the maximumαinside a bubble at locationN1(0. 0.2 cm) was slightly more than that in SBSL.However,the temperature after fitting the experimental MBSL spectrum[30,31]was far less than the calculated temperature [Fig. 5(b)]. Further, the temperature obtained by fitting the experimental spectrum is close to the calculated temperature inside a bubble atN2(0.5, 0.2 cm). Therefore, we considerαinside a bubble at locationsN2(0.5,0.2 cm)as that in MBSL.
Figure 12 illustrates thatαin SBSL is approximately 10000 times greater than that in MBSL (only for the bubble at locationN2). Assuming thatαis generated similarly for both SBSL and MBSL by combining the ionized electrons with H2O, the number density of e-aqformed in the solution for SBSL is considerably higher than that for MBSL. Therefore,the quenching of e-aqto Tb(III)line emission from SBSL is stronger than that from MBSL,[20]which possibly explains the absence of e-aqin MBSL.

Fig. 9. Simulation results of an Ar bubble at the location N3 (r =0,z=0.7 cm) during the 18th acoustic cycle (850–900 s) illustrated in Fig.3(j). The number density of Tb(III)ions is n×10-5. (a)radiation power of the bubble versus time. (b) Temperature. (c) Pressure. (d)Energy spectrum.

Fig.10. Spatial profiles of the calculated densities of various particles at the given points of A,B,C,D,E denoted by filled circles in Fig.9(a). (a)e-,(b)H2O,(c)Ar,(d)H2,(e)OH,(f)OH-,(g)H,(h)H-,(i)O,(j)O-,(k)O2,and(l)O-2. The black,red,blue,megenta and olive lines corresponds to A,B,C,D,and E in Fig 9(a),respectively.

Fig.11. Variation of the calculated degree of ionization α with r inside a bubble. (a)Corresponds to the moments A,B,C,D,E marked in Fig.1(a).(b)Corresponds to the moments A,B,C,D,E marked in Fig.5(a).
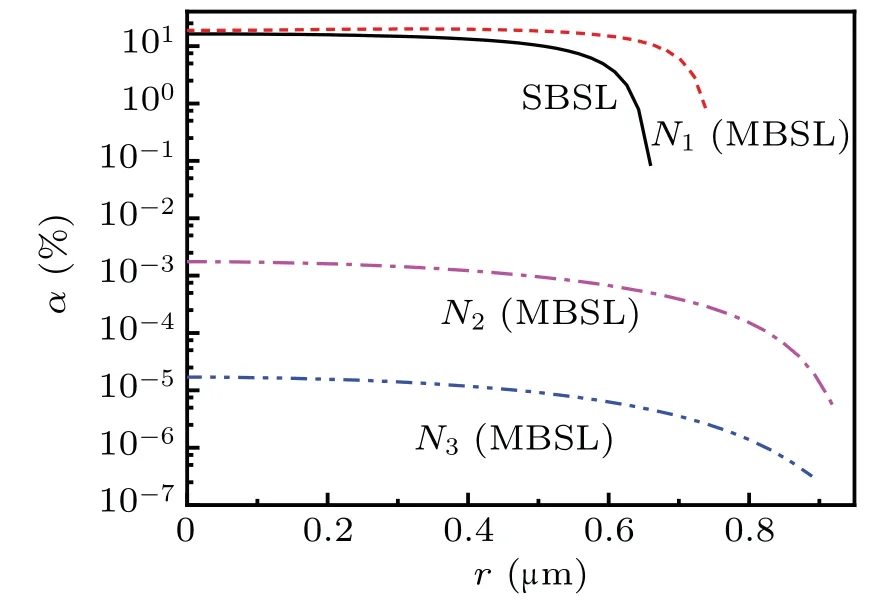
Fig.12. Comparison of the calculated degrees of ionization.
4. Conclusion
We obtained the total radiated power and energy spectra from SBSL and MBSL, respectively. The corresponding spatial profiles of temperature, pressure, number densities of various particles,and degree of ionization inside an Ar bubble were also obtained. Under certain special conditions, the degree of ionization in SBSL (generated bypa=1.34 atm andf=26 kHz)was approximately 10000 times greater than that in MBSL(generated bypa=2.5 atm andf=20 kHz). However,certain parameters in our calculations,such as the number density of bubbles(N)and type of bubble, were assumed instead of being calculated through experiments. In addition,we did not consider the contribution of SPL to Tb(III) ion line emission, which results in a slight difference in the profile between the experimental[17,33,34]and calculated spectra in SBSL.
Acknowledgement
Project supported by the National Natural Science Foundation of China(Grant Nos.11864007 and 11564006).

- Chinese Physics B的其它文章
- Microwave absorption properties regulation and bandwidth formula of oriented Y2Fe17N3-δ@SiO2/PU composite synthesized by reduction–diffusion method
- Amplitude modulation excitation for cancellous bone evaluation using a portable ultrasonic backscatter instrumentation
- Laser-modified luminescence for optical data storage
- Electron delocalization enhances the thermoelectric performance of misfit layer compound(Sn1-xBixS)1.2(TiS2)2
- TiO2/SnO2 electron transport double layers with ultrathin SnO2 for efficient planar perovskite solar cells
- Sputtered SnO2 as an interlayer for efficient semitransparent perovskite solar cells