Measurement of the relative neutron sensitivity curve of a LaBr3(Ce)scintillator based on the CSNS Back-n white neutron source
2023-11-02 08:39:56JianLiu劉建DongmingWang王東明YuechengFu甫躍成ZhongbaoLi李忠寶HanYi易晗andLongtaoYi易龍濤
Chinese Physics B 2023年10期
Jian Liu(劉建), Dongming Wang(王東明), Yuecheng Fu(甫躍成),Zhongbao Li(李忠寶), Han Yi(易晗), and Longtao Yi(易龍濤),?
1Institute of Nuclear Physics and Chemistry,China Academy of Engineering Physics,Mianyang 621900,China
2Spallation Neutron Source Science Center,Dongguan 523803,China
Keywords: relative neutron sensitivity, LaBr3(Ce), China Spallation Neutron Source(CSNS),white neutron source
1.Introduction
The absolute measurement of gamma radiation of pulsed n/γmixing radiation fields is of great importance to the inertial confinement fusion experiment, magnetic fusion experiment and other pulsed n/γmixing radiation fields.[1-5]It offers a way to explore the reaction process.LaBr3(Ce)scintillators,[6]with excellent scintillation time, high light yields and resilience to neutron damage,have been employed in the measurements of gamma-ray spectroscopy and gammaray flux in pulsed n/γmixing radiation fields.[7-9]
In pulsed n/γmixing radiation fields, gamma rays and neutrons are always mixed.Besides the calibration of the scintillator response to gamma rays, the calibration of the scintillator response to neutron irradiation also affects the accuracy of the absolute measurement of gamma radiation.Therefore,a detailed study of the scintillator response to neutron irradiation is required for the design of suitable lines of sight and neutron filters,and to aid in the interpretation of the measurements.[8]
Over the last few years, various studies focusing on the neutron response of the LaBr3(Ce)scintillator have been performed.Cazzanigaet al.[8-10]measured the response of LaBr3(Ce)scintillators to 2.5 MeV neutrons and 14 MeV neutrons at the Frascati Neutron Generator, respectively.The main contributors to the measured neutron responses were studied.Luet al.[11]studied the relative sensitivities of a LaBr3(Ce) scintillation detector to 1.25 MeVγ-rays, and 2.5 MeV and 14 MeV neutrons.Ebranet al.[12]reported measurement of the neutron detection efficiency in a LaBr3(Ce)scintillation detector in the energy range 0.1-2 MeV.Luet al.[13]studied the resistance to neutron irradiation of a LaBr3(Ce) scintillator.Kieneret al.[14]determined neutroninteraction yields in a 1.5-in.cylindrical LaBr3(Ce) crystal in the energy range 2.8-11.6 MeV.The energy spectra of the LaBr3(Ce) resulting from fast neutron interactions were obtained at four different neutron energies.Tainet al.[15]studied the neutron sensitivity of a Φ1.5 in.×1.5 in.LaBr3(Ce)scintillation detector using quasi-monoenergetic neutron beams at five different energies in the range from 40 keV to 2.5 MeV.Taggartet al.[16]studied the response of a LaBr3(Ce) scintillator to the fast neutrons produced by an Am-Be source.Neutron-induced charged-particle reactions were observed in the LaBr3(Ce) scintillator.However, there are some disadvantages in the above studies.First, there are few available energy points.In addition, the above studies mainly focused on the pulse height spectrum resulting from the neutron interactions and neutron detection efficiency.Only one paper[11]reported the neutron sensitivity of LaBr3(Ce) scintillation in current mode,[17]which was one of the key parameters of the detector for neutron flux measurement in the pulsed n/γmixing radiation fields.But the neutron energies in the pulsed n/γmixing radiation fields are continuous;the neutron sensitivity curve is thus needed.One solution is to simulate the neutron sensitivity curve.
However, the luminescence process of inorganic scintillators is very complicated and it primarily results from the energy deposition of secondary charged particles.The secondary charged particles produced by neutrons for LaBr3(Ce)scintillation were electrons, alpha particles, protons and deuterium particles,but there were no luminescence data for these secondary charged particles.The neutron sensitivity curve of the LaBr3(Ce) scintillator cannot be accurately simulated.Therefore, experimental study on the neutron sensitivity of the LaBr3(Ce)scintillator is crucial for its use in the absolute gamma measurement of pulsed radiation fields.This is also crucial for other inorganic scintillators.
The China Spallation Neutron Source (CSNS) produces neutrons by slamming 1.6 GeV protons onto a tungsten target with a 25 Hz repetition frequency.An associated Back-n white neutron source of CSNS was exploited for nuclear data measurement.It has a series of precise energy points and a wide energy range,which provides applicable conditions for experimental study on the neutron sensitivity of a scintillator.[18-20]The CSNS accelerator has two modes of operation, doublebunch and single-bunch modes, with the former mode being the primary mode.In this mode,the second proton bunch arrives approximately 410 ns after the first bunch, and the neutron intensity is double that of the single-bunch mode.However, because of time-of-flight dispersion, the energy resolution is lower than that in the single-bunch mode.Therefore,it may influence the measured results of the neutron sensitivity experiment.
In this work, a scintillator detector consisting of a LaBr3(Ce) scintillator and a photomultiplier tube (PMT) was used to study the neutron sensitivities of the LaBr3(Ce)scintillator at the CSNS Back-n white neutron source end station 2 in double-bunch and single-bunch operation modes,respectively.Under double-bunch and single-bunch operation modes, the relative neutron sensitivity curves of the LaBr3(Ce) scintillator in the energy regions of 1-20 MeV and 0.5-20 MeV were obtained for the first time.The results indicated that the two curves were nearly identical in the energy range of 1-20 MeV.But the single-bunch experiment’s neutron sensitivity curve has a lower minimum measurable energy and a smaller relative neutron sensitivity uncertainty than the double-bunch experiment.
2.Experimental setup
The experiments were performed at the CSNS Back-n white neutron source end station 2 (ES2#)[18]under doublebunch and single-bunch operation mode, respectively, as shown in Fig.1(a).The sizes of the neutron shutter, collimator 1 and collimator 2 during the two experiments are shown in Table 1.The beam spot sizes of ES#2 were Φ30 mm and Φ42 mm,respectively.The operating powers were 50 kW and 40 kW, respectively.The distances from the tungsten target to the front end of the scintillation detector were 74.70 m and 74.53 m,respectively.
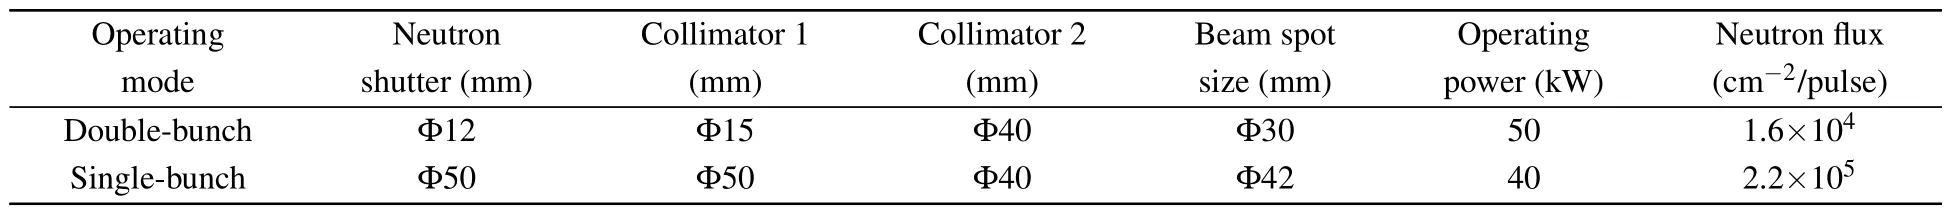
Table 1.Neutron beam conditions.
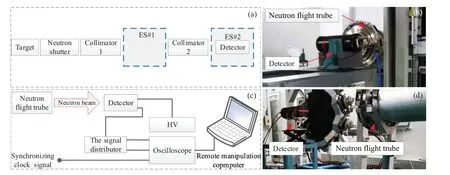
Fig.1.(a) A schematic diagram of the detector installation position.(b) The experimental setup of the double-bunch experiment.(c) A schematic diagram of the experimental arrangement.(d)The experimental setup of the single-bunch experiment.
As shown in Fig.1(c), the data record mode was the same in the two experiments.The detector signal was divided into two channels and recorded by an oscilloscope(Agilent, DSOX4154A).One channel was used to trigger the oscilloscope and record the gamma flash signals,[21]which were mainly generated in the detector by theγ-rays produced during the spallation process.Except for trigging the oscilloscope,the gamma flash signal was used to measure the neuron flight time.The other channel was used to record the neutron signal.The synchronizing clock signal was used to monitor the state of the neutron beam.In the double-bunch experiment,the detector was installed in a side view.As shown in Fig.1(b),the axis of the detector was perpendicular to the direction of the neutron beam.In the single-bunch experiment,the detector was installed in a front view.As shown in Fig.1(d), the axis of the detector was parallel to the direction of the neutron beam.
A schematic diagram of the scintillation detector is shown in Fig.2.It consisted of PMT (Hamamatsu, RC392) and Φ80 mm×20 mm LaBr3(Ce) (5%) scintillation, as shown in Figs.2(c)and 2(d).They were sealed in a carbon steel sleeve to shield them from light and electromagnetic interference.The thickness of the carbon steel in front of the scintillator was 1 mm and the carbon steel surrounding the scintillator and PMT was 2 mm.The scintillator was fixed in the detector by a group of polytetrafluoroethylene fixed collars.During the double-bunch experiment,the scintillator and PMT were coupled by silicone grease.The distance from the detector’s front window to the center of the scintillator was 40 mm,as shown in Fig.1(a).During the single-bunch experiment,the scintillator was fixed to the detector front window to reduce the signal intensity, as shown in Fig.1(b).The distance from the PMT photocathode to the center of the scintillator was 40 mm.
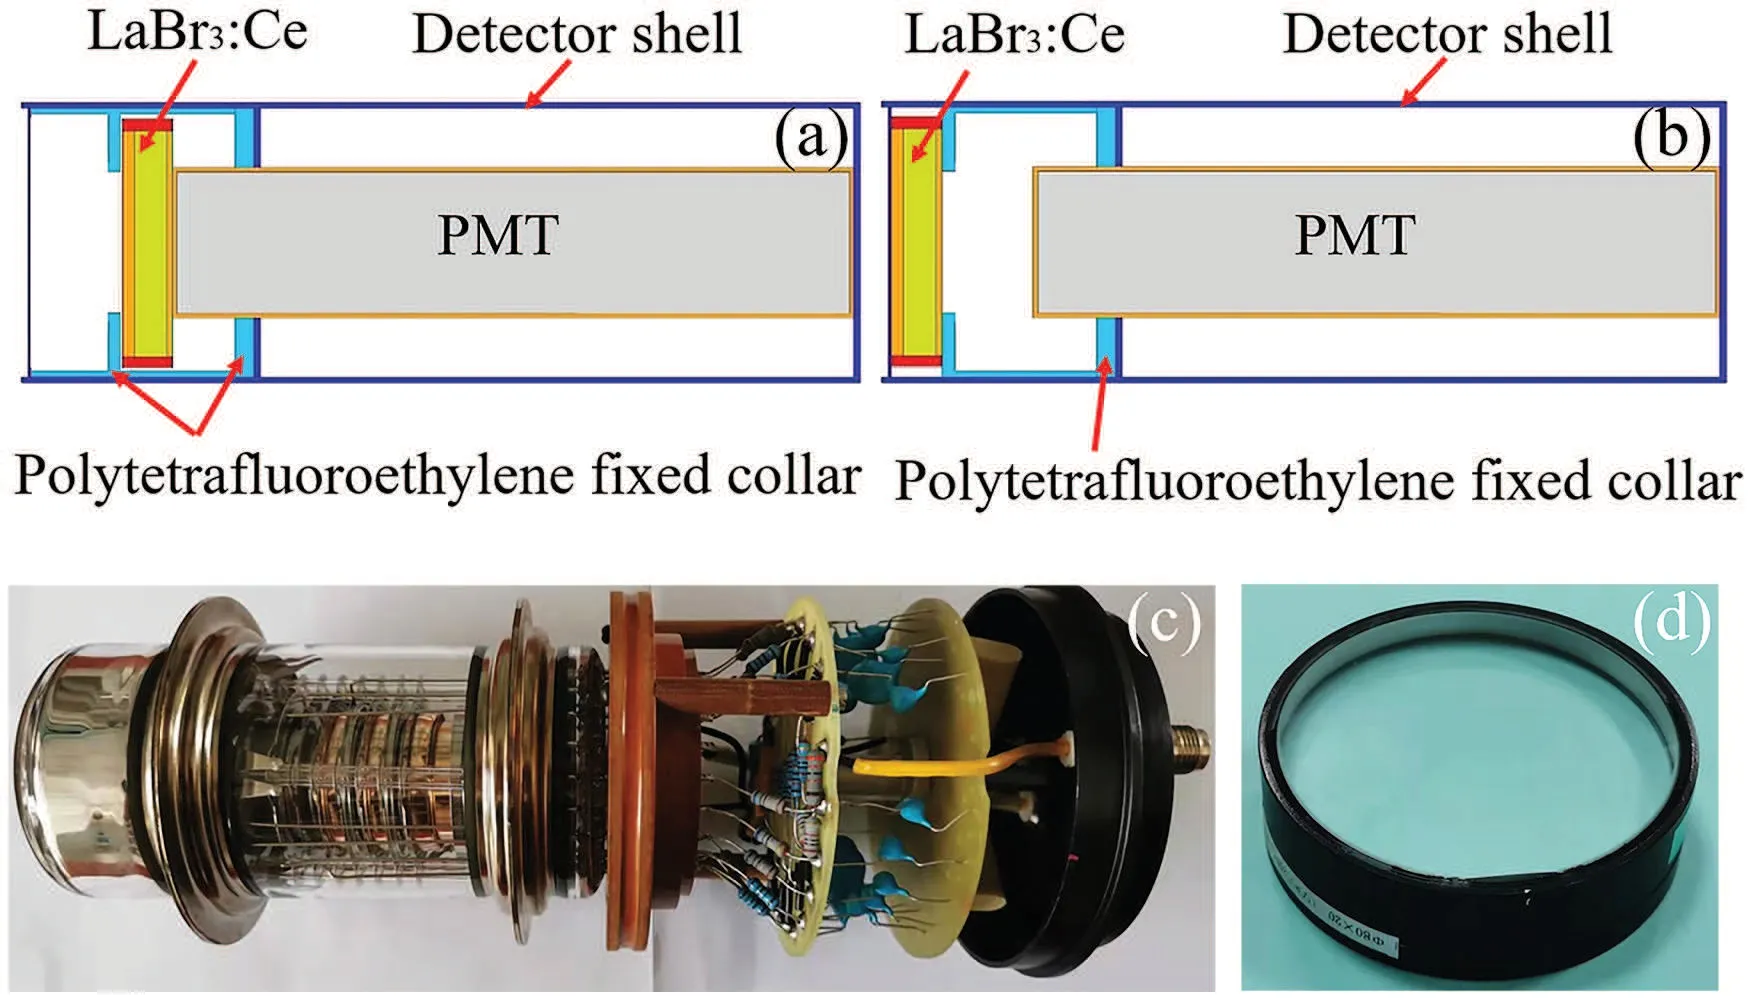
Fig.2.(a) A schematic diagram of the scintillation detector in the double-bunch experiment.(b) A schematic diagram of the scintillation detector in the single-bunch experiment.(c) CR392 PMT.(d)LaBr3(Ce)scintillation.
3.Results and discussion
3.1.Background signal analysis
Because of the high gamma and neutron sensitivities of the LaBr3(Ce)scintillator and the accompanying gamma background in the neutron radiation field, it is necessary to first measure the background signals to obtain an accurate neutron response signal from the LaBr3(Ce)scintillator.The primary background signals for this experiment were the scattered neutrons and gamma rays produced by structures of the scintillation detector, environmental background radiation and PMT photocathode response signals.
Geant4,[22,23]a Monte Carlo particle transport code,was utilized to simulate the signal-to-noise ratios of scattered neutrons and scattered gamma rays produced by the detector shell,fixed collar and other structures of the scintillation detector.High-precision neutron models and cross sections were used to describe elastic scattering and inelastic reactions for neutrons with energies below 20 MeV.The default physics list FTFP BERT was used for neutrons with energies exceeding 20 MeV.The G4EmStandardPhysics option4 physics list was used to describe the electromagnetic processes ofγ, e-, e+and heavy charged particles.As shown in Fig.3, the signalto-noise ratios of secondary neutrons and gamma rays in the double-bunch experiment were greater than 15 and 75,respectively.The signal-to-noise ratios of secondary neutrons and gamma rays in the single-bunch experiment were greater than 40 and 143, respectively.The results suggested a favorable measurement environment.
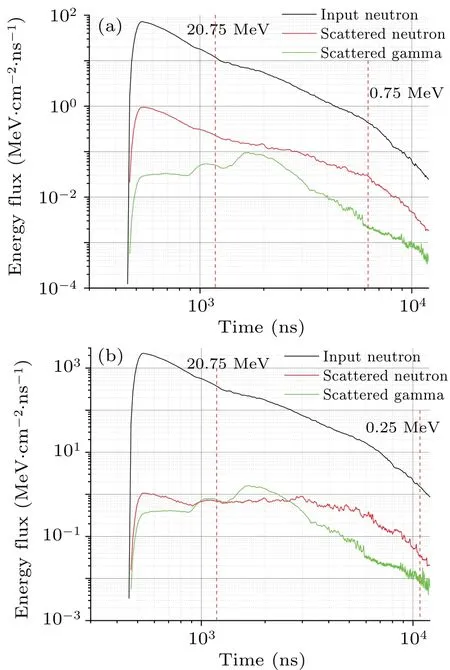
Fig.3.The energy flux of the scattered neutrons and gamma rays produced by structures of the scintillation detector.(a) Double-bunch experiment.(b)Single-bunch experiment.
The environmental background radiation was measured by placing the detector 10 cm away from the neutron beam.The results indicate that the oscilloscope contained only a baseline.This suggests that environmental background radiation can be ignored in this experiment.
To measure the intensity of the PMT photocathode response signal, a detector without a scintillator was installed with a frontal view in the single-bunch experiment.As depicted in Fig.4, the maximum neutron signal amplitude of the measured PMT photocathode response signal was 1.8 mV.Meanwhile,the maximum net neutron signal amplitude of the single-bunch experiment was 634 mV.The maximum PMT photocathode response signal amplitude was significantly less than the maximum net neutron signal amplitude.Because the neutron flux in the double-bunch experiment was only 1/20 of that of the single-bunch experiment,the maximum neutron signal amplitude of the measured PMT photocathode response signal was less than 0.1 mV in the double-bunch experiment.But the maximum net neutron signal amplitude of the doublebunch experiment was 200 mV.The maximum amplitude of the PMT photocathode response signal was also considerably smaller than that of the neutron signal in the double-bunch experiment.The above results imply that the PMT photocathode response signal in this experiment can be ignored.The preceding results demonstrated that the experiment’s background signals can be ignored.
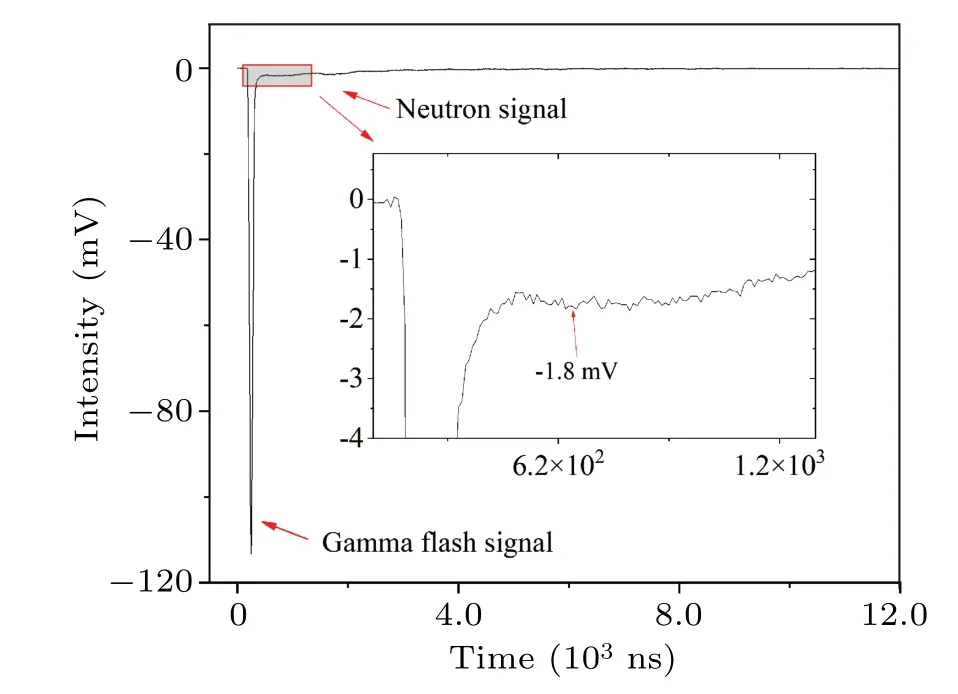
Fig.4.The measured PMT photocathode response signal.
3.2.Spectrum unfolding calculation
In double-bunch operation mode, the rapid cycling synchrotron accumulates two proton bunches separated by approximately 410 ns.[19]The two proton bunches in a single pulse have a substantial effect on the neutron pulse.The measured signal can therefore be considered the superposition of two identical signals, separated by approximately 410 ns.It can be expressed using the equation below:
whereF(t)is the measured signal,f1(t)andf2(t)are the signals of bunch 1 and bunch 2,respectively,Δtis the time lag of the two bunches,andw2is the intensity ratio of bunch 2 signal to bunch 1 signal.
As shown in Fig.5, two gamma flash signals were detected in the measured signal.Using Eqs.(1) and (2), signal bunches 1 and 2 were calculated.The time lag and intensity ratio were 409 ns and 0.998,respectively.As the signals from bunches 1 and 2 were nearly identical, the signal from bunch 2 was used to calculate the neutron sensitivity.
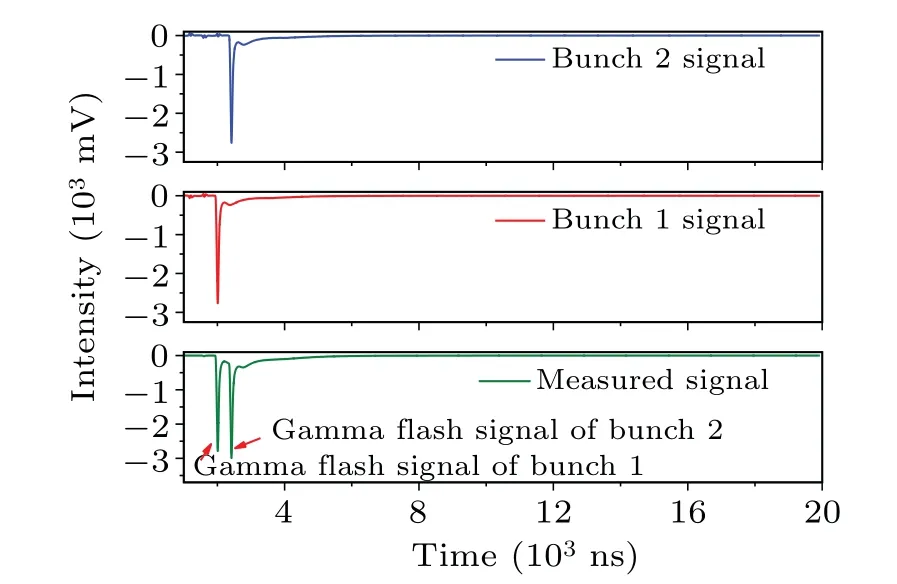
Fig.5.The measured signal of LaBr3(Ce) in double-bunch operation mode.
3.3.Relative neutron sensitivity analysis
In this experiment,the neutron energy was determined using the time-of-flight method.The peak moment of a gamma flash signal was used to measure the time-of-flight of the neutron.As 40 mm was considerably shorter than 74.53 m, it was ignored when measuring the neutron’s flight time.For a precise time-of-flight spectrum,the Monte Carlo method was used.Chenet al.[21]obtained the energy spectrum of the end station 2, and the full width half maximum (FWHM) of the source was 50 ns.[24]The calculated neutron time-of-flight spectrum produced by a bunch is shown in Fig.6.
Fig.6.The neutron time-of-flight spectrum produced by a bunch at the detector position.
As shown in Fig.7, the amplitude of the gamma flash signal was significantly greater than the neutron signal.The gamma flash’s trailing peak overlapped with the neutron signal.Since the gamma flash and neutron were generated simultaneously,[21]the gamma flash signal could not be detected independently.Before the trailing fall to the baseline,the neutron signal had appeared.The complete gamma flash peak and net neutron signal cannot be determined through experimentation.To obtain the net neutron signal, the trailing of the gamma flash peak should be subtracted from the measured neutron signal.The following equation was used to fit the gamma flash peak,which was an empirical formula:
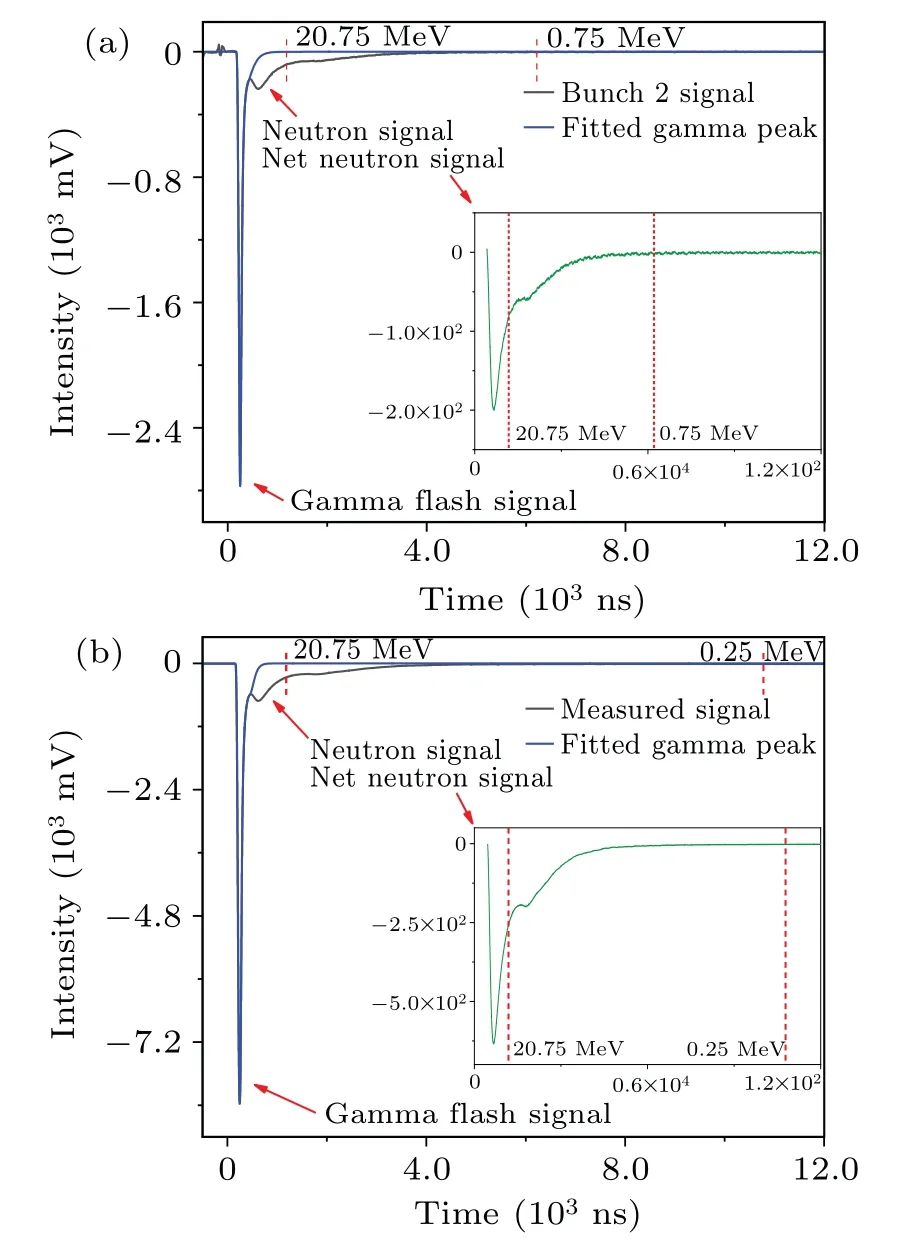
Fig.7.The measured signals,fitted gamma flash peaks and net neutron signals.(a)Double-bunch experiment.(b)Single-bunch experiment.
The measured signals and fitted gamma flash peaks of the LaBr3(Ce) scintillators are shown in Fig.7.The maximum net neutron signal amplitudes of the double-bunch and single-bunch experiments were 200 mV and 634 mV,respectively.The neutron signal shapes of the two experiments were almost the same.Because the bunch 2 signal was calculated,it was not as smooth as the measured signal of the single-bunch experiment and had a higher baseline.The net signal intensity of the double-bunch experiment was too small to calculate the neutron sensitivity when the neutron energy was below 0.75 MeV.Meanwhile,that of the single-bunch experiment result was less than 0.25 MeV.
To calculate the neutron sensitivity,[18]the net neutron signal wave was divided into multiple regions.The region’s range was determined by the energy interval of the neutron sensitivity curve.Here, the energy interval was 0.5 MeV in the range of 1-5 MeV,1 MeV in the range of 5-10 MeV and 1.5 MeV in the range of 11-20 MeV.The neutron sensitivity was calculated using
whereEiis the central energy of regioni,Vjis the amplitude of sampling sitejof the neutron response signal,Niis the total neutron counts in regioni, Δt(0.4 ns) is the sampling interval of the oscilloscope andR(50 Ω) is the impedance of the detector.
In addition to calculating the neutron sensitivity uncertainty, the neutron energy uncertainty was calculated, as the neutron source was not a delta source.Using the following equation,the neutron energy uncertainty and neutron sensitivity uncertainty were calculated:
The components ofujare listed in Table 1.
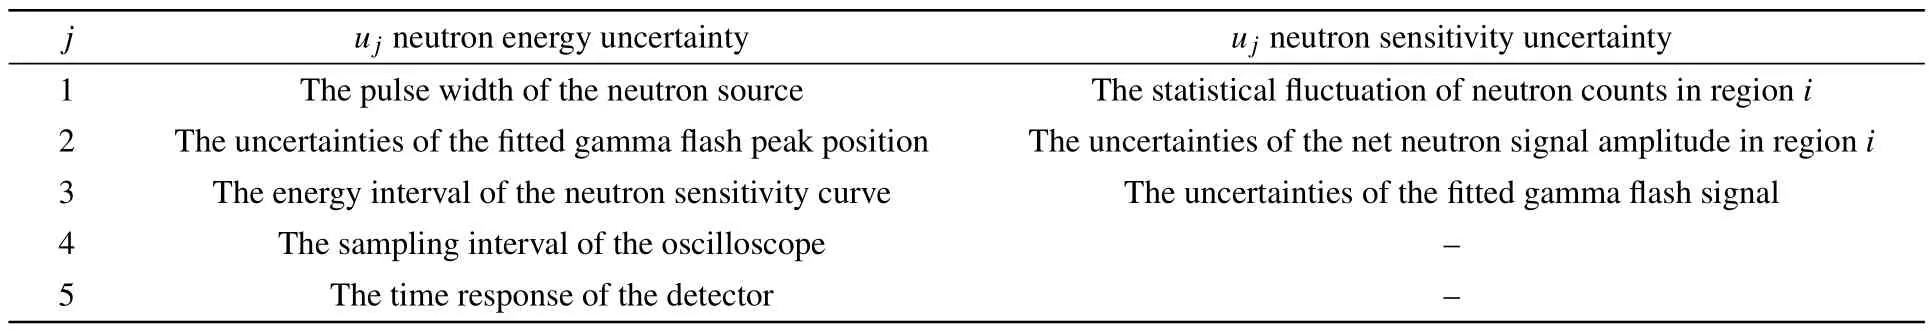
Table 2.The components of u j.
Since the neutron flux curve meeting the requirements of the absolute sensitivity calibration experiment cannot be measured, the relative neutron sensitivity curves were calculated in this experiment.Using some special energy points, such as 2.5 MeV and 14.1 MeV, the absolute neutron sensitivity curve of the LaBr3(Ce)can be calibrated.Using the absolute neutron sensitivity curve,the signal amplitude of the detector caused by scattered neutrons and secondary neutrons can be calculated.These data are the basic data of the effectiveness evaluation of the neutron collimator and filter,and can be used to analyze the measured data.
By normalizing the neutron sensitivity to the 14 MeV neutron, the relative neutron sensitivity curves of the LaBr3(Ce)scintillator in the energy regions of 1-20 MeV and 0.5-20 MeV were obtained for the first time using the doublebunch and single-bunch operation modes.The experimental method used herein has been verified in our previous study.[25]As shown in Fig.8,the two curves were nearly identical in the energy range of 1-20 MeV.Since a spectrum unfolding calculation was performed on the double-bunch experimental results,the FWHM of the neutron signal baseline was larger than that of the single-bunch experiment and the net neutron signal of the double-bunch experiment was rougher than that of the single-bunch experiment.The double-bunch experiment produced a neutron sensitivity curve with a minimum detectable energy of 1 MeV.In contrast, the value for the single-bunch experiment was 0.5 MeV.
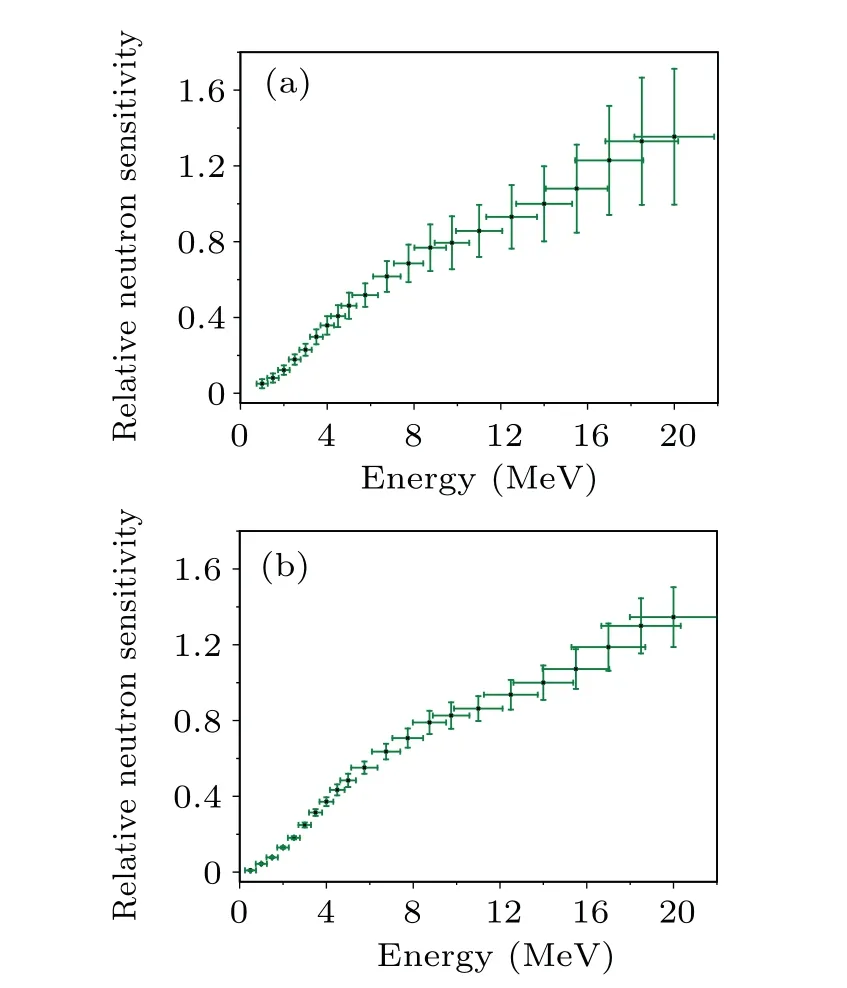
Fig.8.The relative neutron sensitivity curves of the LaBr3(Ce)scintillator.(a)Double-bunch experiment.(b)Single-bunch experiment.
The maximum and minimum expanded uncertainties(k=2)[26]of the relative neutron sensitivity of the double-bunch experiment were 47.4%and 13.2%at 1 MeV and 3.5 MeV,respectively.The maximum and minimum expanded uncertainties (k=2) of the relative neutron sensitivities of the singlebunch experiment were 47.4% and 11.8% at 0.5 MeV and 20 MeV,respectively.The spectrum unfolding calculation introduced computational noise into the calculated results, and the calculated neutron response signal of the double-bunch experiment was not as smooth as the measured neutron response signal of the single-bunch experiment.The uncertainties of the fitted gamma flash signal in the double-bunch experiment were significantly greater than in the single-bunch experiment.Thus, the relative neutron sensitivity uncertainties of the double-bunch experiment were greater than those of the single-bunch experiment.
The preceding results indicated that the single-bunch experiment’s neutron sensitivity curve has a lower minimum measurable energy than the double-bunch experiment.In the energy range of 1-20 MeV, there is little difference between the single-bunch and double-bunch experimental results of the LaBr3(Ce)scintillator.
4.Conclusions
In this paper, the neutron sensitivities of the scintillation detector were investigated at the CSNS Back-n white neutron source end station 2.Under double-bunch and single-bunch operation modes,the relative neutron sensitivity curves of the LaBr3(Ce)scintillator in the energy regions of 1-20 MeV and 0.5-20 MeV were obtained for the first time.In the energy range of 1-20 MeV, the two curves were nearly identical.However, the relative neutron sensitivity uncertainties of the double-bunch experiment were higher than those of the singlebunch experiment.
The single-bunch experiment’s neutron sensitivity curve has a lower minimum measurable energy than the doublebunch experiment.The higher the neutron response signal intensity,the lower the minimum measurable energy of the neutron sensitivity curve.Above the minimum measurable energy of the double-bunch experiment, there is little difference between the measured relative neutron sensitivity curves of the single-bunch and double-bunch experiments of the LaBr3(Ce)scintillator and those of other scintillators with a similar neutron response signal intensity.
Acknowledgements
Project supported by the National Natural Science Foundation of China(Grant No.11905196).The authors would like to thank their colleagues from CSNS for their support.
- Chinese Physics B的其它文章
- Corrigendum to“Reactive oxygen species in plasma against E.coli cells survival rate”
- Dynamic decision and its complex dynamics analysis of low-carbon supply chain considering risk-aversion under carbon tax policy
- Fully relativistic many-body perturbation energies,transition properties,and lifetimes of lithium-like iron Fe XXIV
- Kinesin-microtubule interaction reveals the mechanism of kinesin-1 for discriminating the binding site on microtubule
- Multilevel optoelectronic hybrid memory based on N-doped Ge2Sb2Te5 film with low resistance drift and ultrafast speed
- Investigation of Ga2O3/diamond heterostructure solar-blind avalanche photodiode via TCAD simulation