Remote sensing of air pollution incorporating integrated-path differential-absorption and coherent-Doppler lidar
2024-02-29 08:24:18ZehouYangYongChenChunliChenYongkeZhangJihuiDongTaoPengXiaofengLiDingfuZhou
Defence Technology 2024年1期
Ze-hou Yang , Yong Chen , Chun-li Chen , Yong-ke Zhang , Ji-hui Dong ,Tao Peng , Xiao-feng Li ,c, Ding-fu Zhou
a School of Physics, Beijing Institute of Technology, Beijing 100081, China
b Southwest Institute of Technical Physics, Chengdu 610041, Sichuan, China
c School of Optics and Photonics, Beijing Institute of Technology, Beijing 100081, China
Keywords: Differential absorption LIDAR Coherent Doppler lidar Remoting sensing Atmospheric pollution
ABSTRACT An innovative complex lidar system deployed on an airborne rotorcraft platform for remote sensing of atmospheric pollution is proposed and demonstrated.The system incorporates integrated-path differential absorption lidar(DIAL)and coherent-doppler lidar(CDL)techniques using a dual tunable TEA CO2 laser in the 9-11 μm band and a 1.55 μm fiber laser.By combining the principles of differential absorption detection and pulsed coherent detection, the system enables agile and remote sensing of atmospheric pollution.Extensive static tests validate the system’s real-time detection capabilities,including the measurement of concentration-path-length product (CL), front distance, and path wind speed of air pollution plumes over long distances exceeding 4 km.Flight experiments is conducted with the helicopter.Scanning of the pollutant concentration and the wind field is carried out in an approximately 1 km slant range over scanning angle ranges from 45° to 65°,with a radial resolution of 30 m and 10 s.The test results demonstrate the system’s ability to spatially map atmospheric pollution plumes and predict their motion and dispersion patterns, thereby ensuring the protection of public safety.
1.Introduction
As industry advances, air pollution becomes a more and more serious problem.The rapid expansion of industries, encompassing energy, chemicals, metallurgy, textiles, and pharmaceuticals, has led to the substantial emission of gas pollutants.These pollutants not only have a significant impact on the daily lives of residents but also pose serious threats to human safety [1,2].The detection and identification of atmospheric pollutant gases play a pivotal role in safeguarding the atmospheric environment as they provide valuable insights for tracing pollutant sources, categorizing hazard levels, and formulating effective control strategies [3-5].
Lidar, as an active remote sensing technology and tool, has unique advantages in the height, spatial resolution, time continuous monitoring and measurement accuracy of remote sensing detection, especially in atmospheric detection [6-9].And Laser detection ranges can be on the order of a few hundred meters to several kilometers and concentration levels on the order of parts per million to parts per billion [10].Given that the majority of pollutant gases exhibit characteristic spectra in the longwavelength range, which coincides with the output wavelength of CO2lasers, integrated-path differential absorption lidar (DIAL)systems based on mature and high-energy CO2lasers have been widely adopted [11-16].
In recent years, there has been a growing need for comprehensive three-dimensional monitoring of atmospheric pollution,encompassing the integration of pollution diffusion information and spatial location [17].This has propelled advancements in multifunctional complex lidar technologies.Around the year of 2000, the institute of Laser Technics and Technology in Russia developed a Mobile lidar Complex (MLC) system deployed on a mobile platform.Operating at infrared wavelengths of 9-11 μm,as well as 1064 nm and 532 nm,this system exhibited the capability to detect various atmospheric parameters, including aerosol concentration, gas-phase chemical compositions, wind, turbulence, etc.[18].Nevertheless, the aforementioned system has intricate structure and considerable physical dimensions.In 2017, the National Physical Laboratory (NPL) in the United Kingdom introduced a vehicle-mounted DIAL system tailored explicitly for monitoring methane emissions emanating from landfill sites.To acquire wind speed and direction data, a portable mast was deployed in close proximity to the DIAL system[19].However,it should be noted that this system exhibited limitations when it came to retrieving comprehensive wind field information across larger areas and at higher altitudes [20].In 2022, scholars from the University of Science and Technology of China and etc.presented and validated a lidar system that integrated the techniques of Differential Absorption lidar(DIAL)and Coherent Doppler lidar(CDL).Employing a wavelength of 1.55 μm,this system effectively captured the spatial distribution of both CO2concentration and wind fields, thereby facilitating the precise estimation of localized CO2emissions.Nevertheless, it is essential to acknowledge that the system’s wavelength constraints limited its applicability solely to the measurement of CO2concentration [21].
An innovative complex lidar system, deployed on an airborne platform, has been developed to facilitate remote sensing of atmospheric pollution.This system effectively combines the principles of integrated-path differential absorption and coherent Doppler laser detection.The system incorporates two small tunable TEA CO2lasers operating at a wavelength of 10.6 μm, along with a 1.55 μm fiber laser.By integrating the channels of DIAL and CDL,the system enables the comprehensive acquisition of multidimensional information pertaining to atmospheric pollutant gases concentrations, wind profiles and front distances.
2.Methods and apparatus
2.1.Methods
A conventional integrated-path DIAL utilizes dual-wavelength laser emission, wherein one laser pulse is precisely tuned to the on-line wavelength λoncorresponding to the absorption coefficient α(λon) of the target gas.Similarly, the other laser pulse is tuned to the off-line wavelength λoffassociated with the absorption coefficient α(λoff) of the gas under measurement.The emitted power of these two laser pulses is denoted asP0(λon) andP0(λoff), respectively,while the received power is represented byP(λon)andP(λoff).Minimizing the absolute difference between the on-line and offline wavelengths λonand λoffis crucial to mitigate the impact of transmission,reflection,reception,and photoelectric conversion on the intensity of the echo pulses.The disparities observed in the echo signals of the two wavelengths predominantly arise from the differential absorption of gases at distinct wavelengths, as
described by Eq.(1).
The product of the gas concentration and the optical path length(CL) can be derived by applying the lidar equation and the Beer-Lambert Law, as represented in Eq.(2) [22-24].
DIAL, relying on the utilization of tunable CO2laser, facilitates the identification of a wide range of atmospheric pollutant gases by leveraging the distinctive absorption line characteristics within the long-wavelength range(specifically,9-11 μm)[25].This technique utilizes two lasers that sequentially emit laser beams at preselected wavelengths, denoted as (λi,on,λi,off)i= 1,2,…,m.The received power in DIAL is determined in Eq.(3) [25,26].
In the equation provided,A0signifies the area of the receiving optical telescope.P0(λ) represents the emitted power of the laser at wavelength λ,whilerdenotes the distance to the lambertian target.ρ represents the reflectivity of lambertian target, η(λ) symbolizes the optical efficiency of the system,and β(λ)signifies backscattered coefficient for the 1st to nth substances.Moreover,αj(λ)denotes the absorption coefficient of thejth substance at wavelength λ,CLjrepresents the product of concentration and path length for thejth substance, and ε(λ) stands for the atmospheric extinction coefficient.
Applying the multi-wavelength DIAL algorithm, when the number of wavelengthsm≥n, the following relationship can be derived as follows [27]:
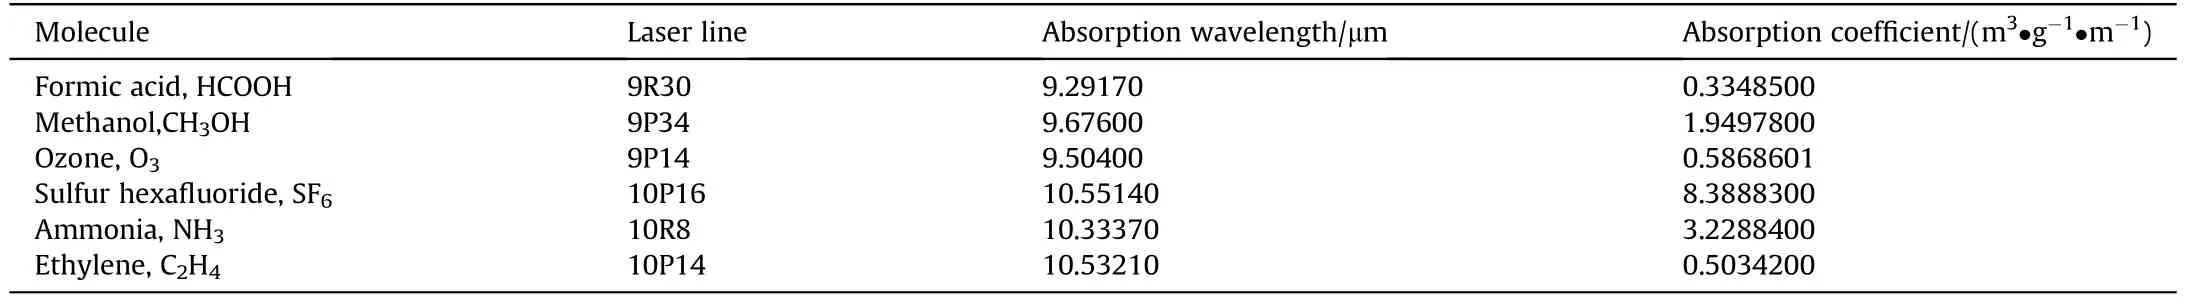
Table 1Pollutant gases absorption wavelength and its absorption coefficient.
whereCLj(j= 1, 2, …,n) represents the concentration-distance value for thejth substance.For each set of laser wavelength pairs(λi,on, λi,off) withj= 1, 2, …,m, the emission power is denoted asP0(λi,on) andP0(λi,off), while the received power is represented asP(λi,on,r) andP(λi,off,r).
Based on the spectral databases such as HITRAN and NIST, it is evident that the long-wave infrared spectral range of 9-11 μm does not encompass absorption lines for the majority of atmospheric gases, including oxygen (O2) and nitrogen (N2).However, as illustrated in Table 1, several common atmospheric pollutants, such as formic acid (HCOOH), methanol (CH3OH), ozone (O3), sulfur hexafluoride (SF6), ammonia (NH3) and Ethylene(C2H4), exhibit significant absorption characteristics within the wavelength range of 9-11 μm.By selecting suitable wavelengths according to the rule demonstrated in Eq.(4) within this range, it becomes feasible to perform precise measurements for these pollutants [28,29].
The CDL channel employs a coherent detection technique using laser pulses to accurately capture the spatial distribution information of pollutant clouds based on the intensity of reflected laser echo signals.Additionally,the motion parameters of these pollutant clouds are detected using the principle of Doppler velocity measurement.To generate a narrow linewidth continuous seed light,an Acousto-Optic Modulator (AOM) modulation is employed to produce a 200 ns pulse laser.Subsequently,the pulse laser undergoes amplification through MOPA (Master Oscillator Power Amplifier)fiber amplification technology.Then, using the transceiver telescope, the laser is emitted and the echo signals are received.The received echo signals are coherently detected using a coupler and a balanced detector.The information processing module conducts A/D conversion and Fast Fourier Transform (FFT) transformation on the echo signals.Through this transformation from time-domain signals to frequency-domain signals, the signals undergo processing steps such as incoherent accumulation.The lidar echo signal of the CDL channel is outputed from the balanced detector, and the intermediate frequency current signal obtained from the mixing of the signal light and the local oscillator light in the detector can be expressed as follows:
wherePLrepresents the power of the local oscillator signal,PSdenotes the power of the echo signal, 2R represents the detector responsivity,fdis the frequency difference, and Δφ represents the phase difference between the local oscillator and the signal light.
Efrepresents the energy in the signal frequency domain.By considering these parameters,the power of the echo signal(PS)in a coherent detection system can be obtained as follows:
The calculation of the signal energy from the spectral signal provides a valuable means for determining the power of the echo signal at different distances, thus enabling the estimation of the distance to the cloud cluster.
Furthermore, by evaluating the rate difference between the backscattered signal and the transmitted signal using Eq.(7), the derived radial wind speed data can be obtained.
where |v| denotes the radial wind speed, λ is the probing wavelength, and dφ/dtis the rate of phase change.
By employing the aforementioned equations and relevant signal processing algorithms, the CDL channel is able to obtain the echo intensity information with a distance resolution of 30 m,as well as the Doppler frequency shift information.This enables the inverse calculation of the spatial position,motion velocity,and direction of the pollutant cloud clusters.
2.2.Apparatus
The developed lidar system,as illustrated in Fig.1,encompasses an integrated structure that incorporates various components including the DIAL channel, CDL channel, Charge-Coupled Device(CCD) video monitoring unit, integrated control processor, inertial navigation, and system power supply.The DIAL channel operates on the fundamental principle of integrated-path differential absorption detection, facilitating the determination and measurement of different atmospheric pollutant gas types and their respective concentrations.On the other hand,the CDL based on the pulse coherent detection principle to effectively measure the radial wind velocity and accurately determine the distance to the cloud cluster.The utilization of a scanning device enables the measurement of radial wind speeds in diverse directions, thereby enabling the comprehensive acquisition of atmospheric wind field information within the designated measurement range.The key system parameters that play a crucial role in ensuring the system’s operational efficacy and performance are presented in Table 2.
The primary source of noise in the developed lidar systems is the combined effect of detector dark noise and received background radiation.In the infrared range, the contribution from solar and ground thermal radiation is negligible and can be disregarded.However, in the visible and near-infrared bands, the dark noise of high-quality detectors may be insignificant, whereas infrared detectors tend to exhibit significant dark noise.In a coherent detection channel with ample local oscillator power,the detector noise is limited by scatter noise.On the other hand, for differential absorption lidar channels with weak echo signals, the detector noise is constrained by dark current in the infrared spectral region.
The system error of Differential Absorption lidar (DIAL) is not only determined by the signal-to-noise ratios of the lasers,but also influenced by the correlation between the energy emitted and received by the two lasers.In DIAL,two lasers are employed to emit laser light separately at a target distance of 300 m.Due to the laser emitting at 5 Hz, the average ofandafter receiving signals 5 times per second can be obtained as follows:
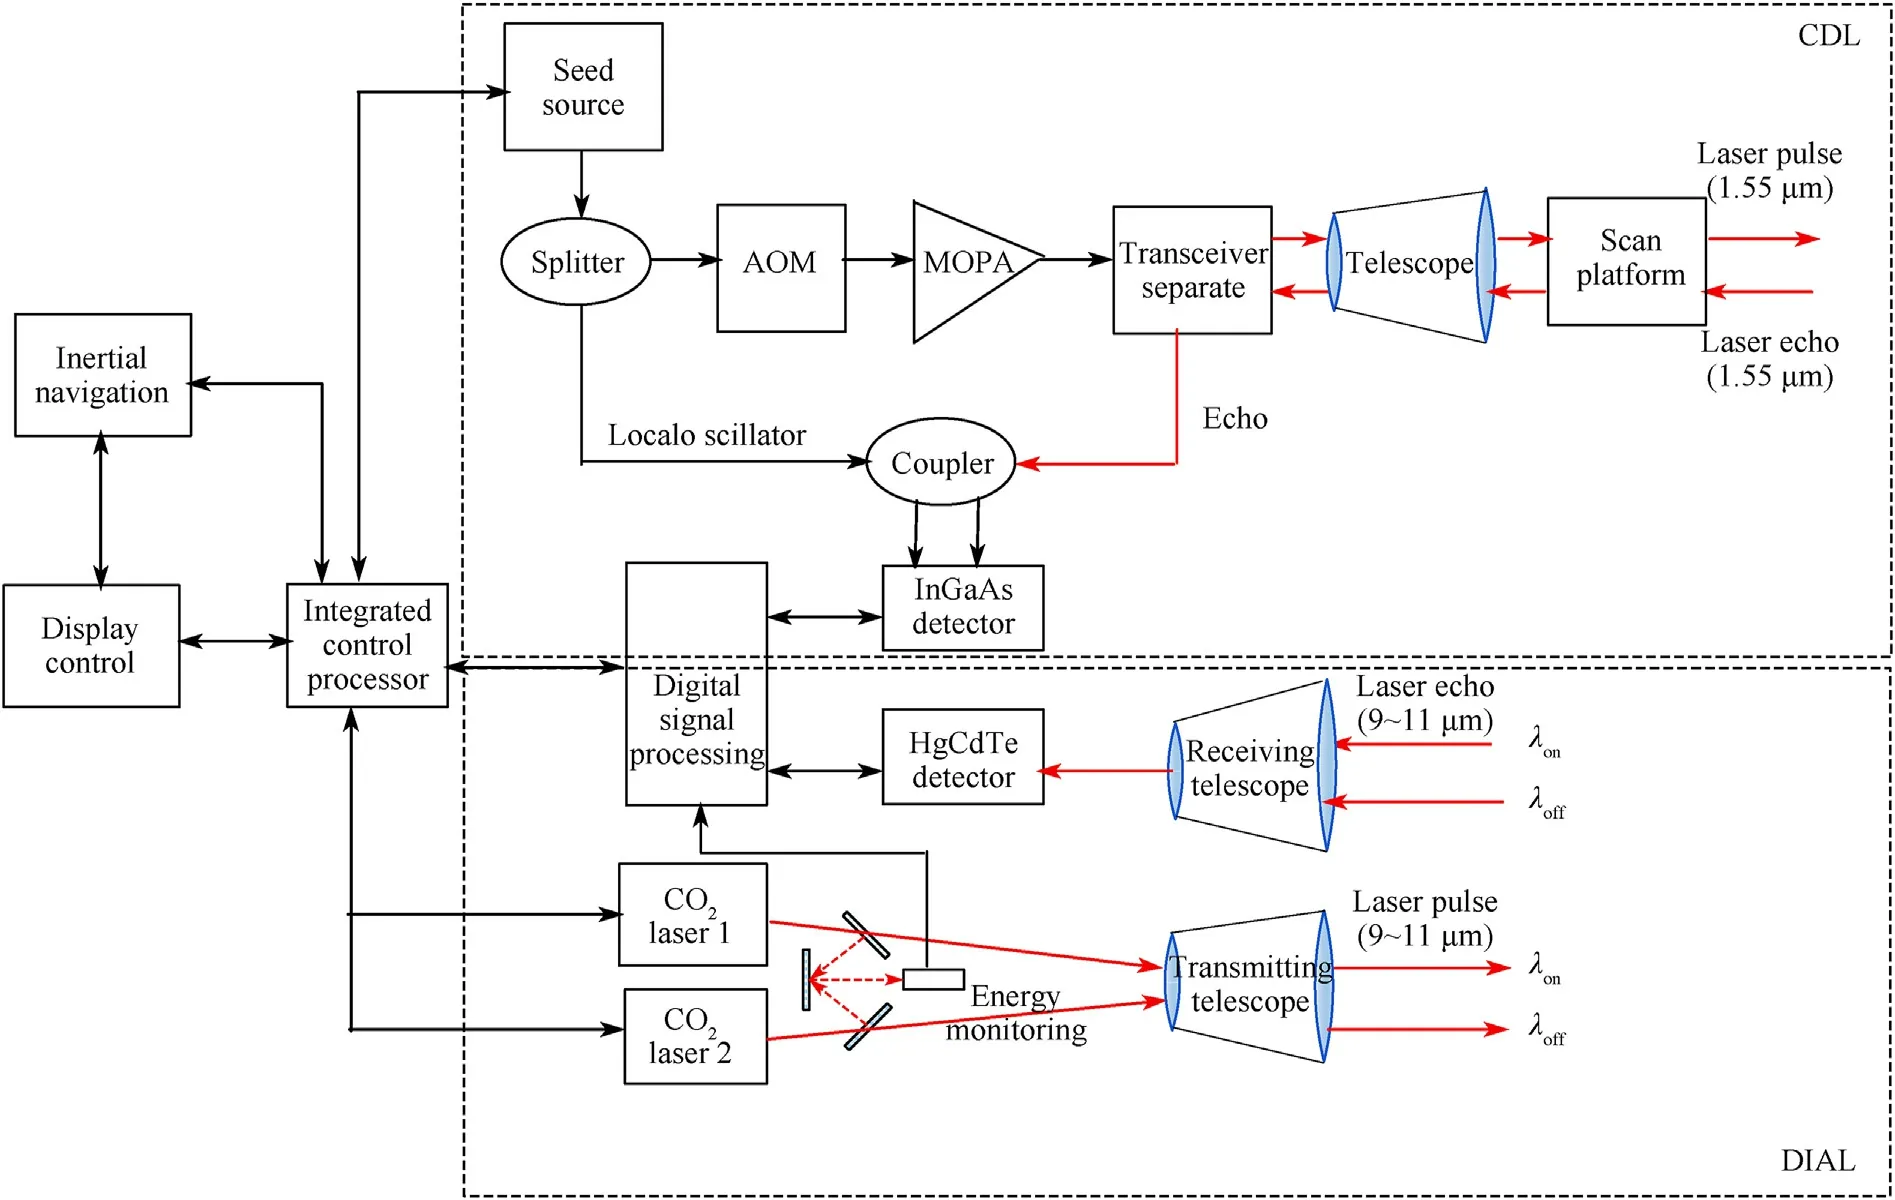
Fig.1.Configuration of lidar system for remote sensing of air pollution.
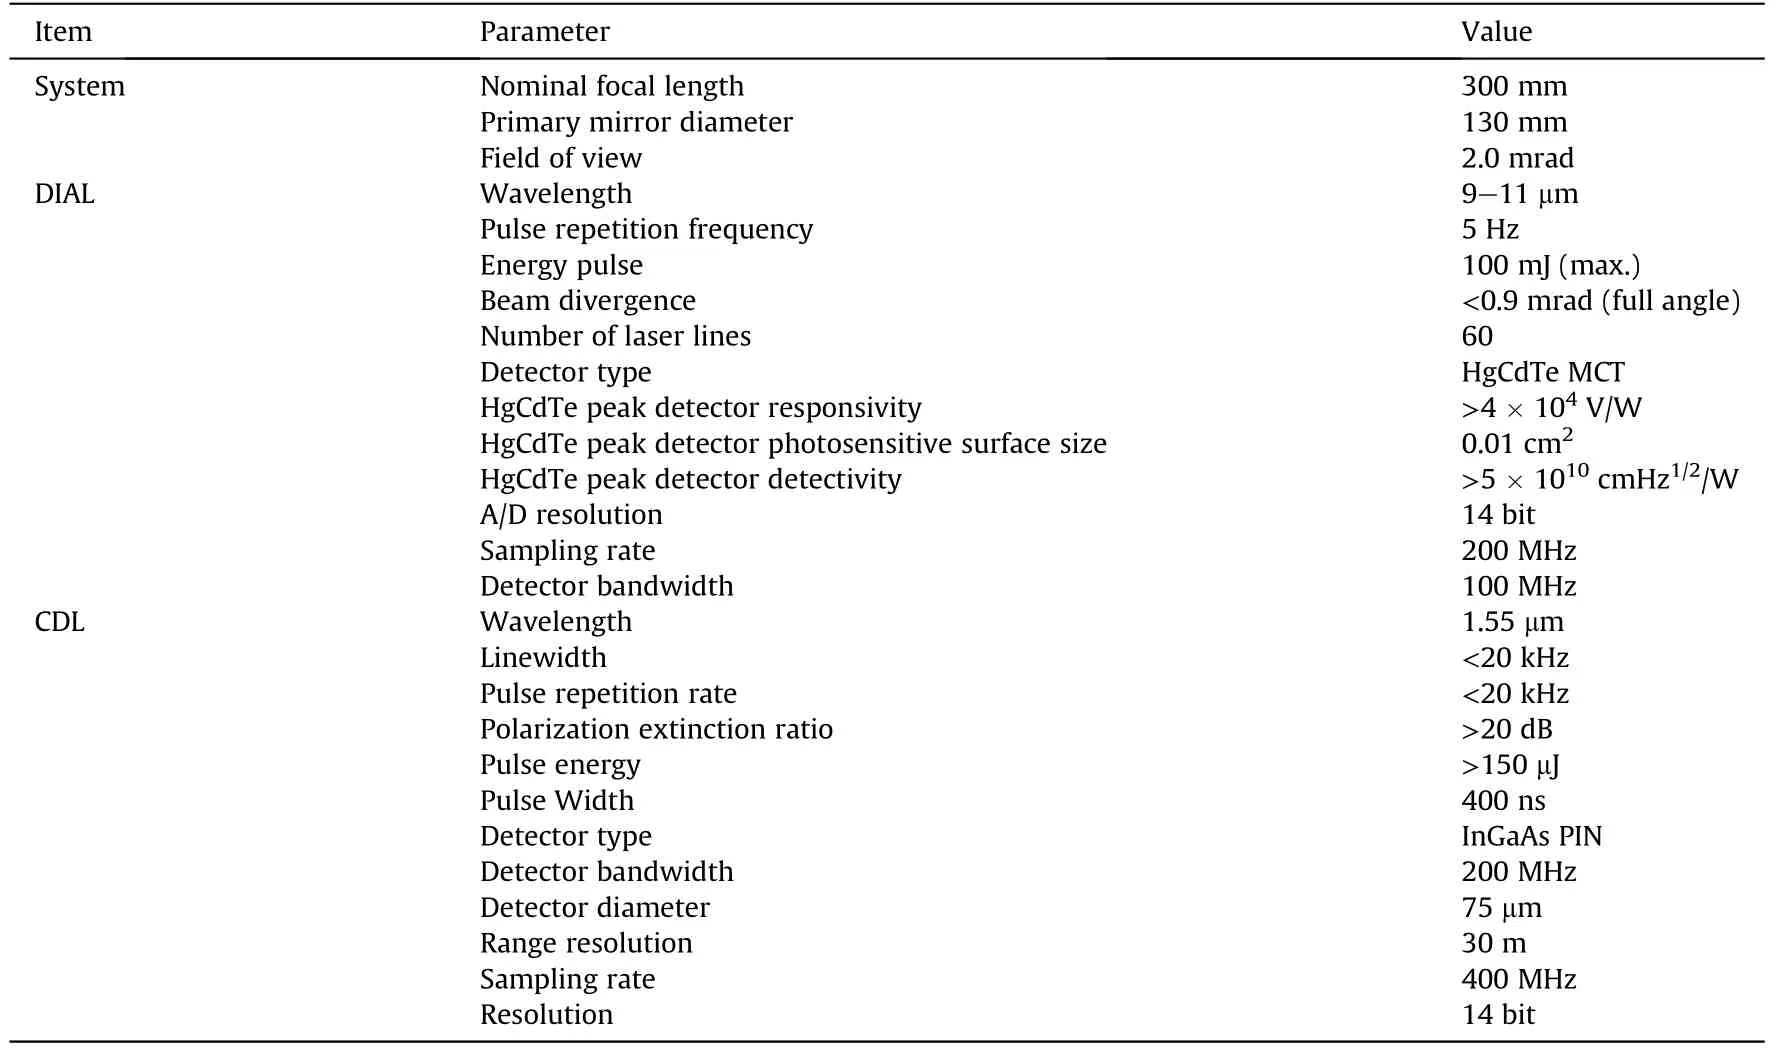
Table 2Main lidar system parameters.
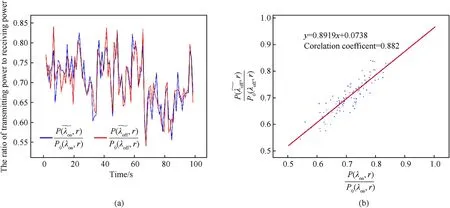
Fig.2.Comparison of the ratio of transmitting and receiving power between two lasers: (a) Time Series plot; (b) Regression plot.
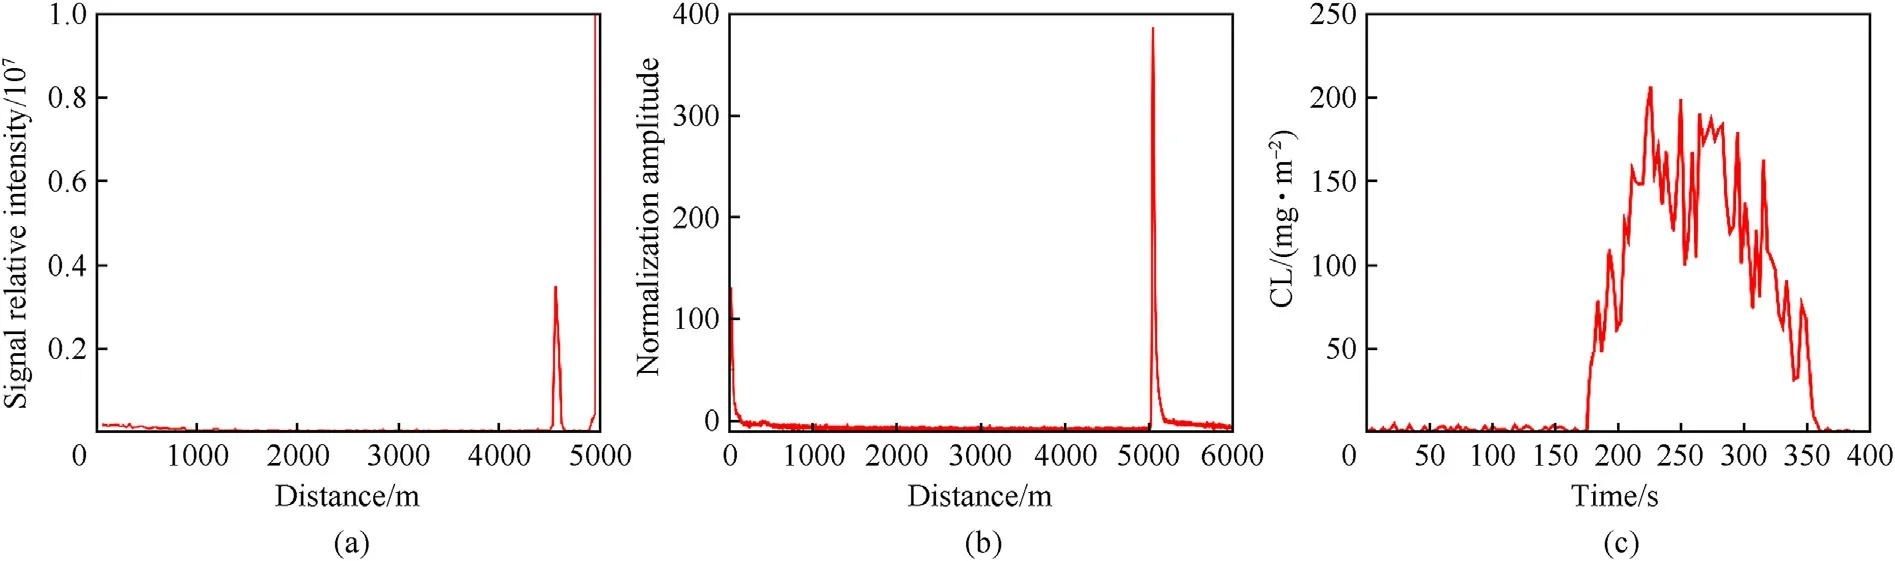
Fig.3.Analyzer measurements of NH3 based on DIA and CDL: (a) Echo-spectrum intensity curves by CDL; (b) Echo curves by DIAL; (c) Concentration-length product (CL) measurements of NH3.
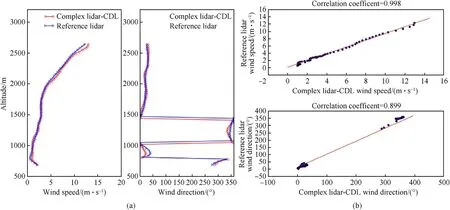
Fig.4.Comparison of the wind speed and wind direction data retrieved by the complex lidar-CDL and the reference lidar: (a) Comparison plot; (b) Regression plot.
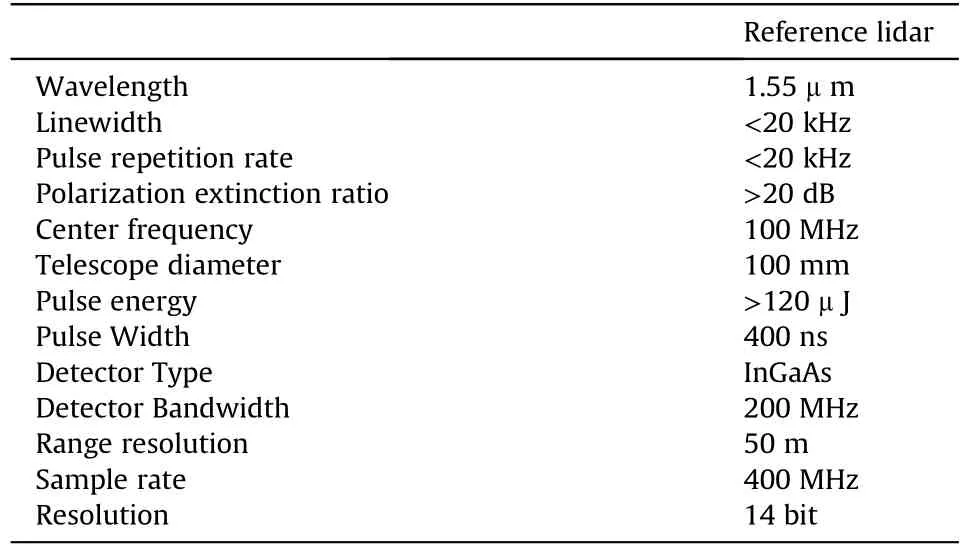
Table 3System parameters of the reference lidar.
where,Numis the total number of pulses repeatedly emitted by the laser per second.In the paper,Numis 5.In Fig.2, a comparison is presented between the ratio of received energy and emitted energy for wavelengths λonand λoff.Upon closer inspection, it can be observed that the trend ofaligns with the curve, exhibiting a correlation coefficient of 0.882.And their standard deviation is 0.063.
2.3.Advantages of the complex system
The complex lidar system encompasses numerous advantages.Firstly, through the utilization of a shared comprehensive control module, the DIAL and CDL can operate concurrently, enabling simultaneous measurements of wind profiles and concentrations of atmospheric pollutant gases.The long-wave infrared differential absorption lidar is capable of detecting atmospheric pollutant gases over long distances while effectively mitigating the influence of environmental background factors.This feature allows for highly sensitive detection of pollutant gases in aerosol form along the optical path.Furthermore,the 1.55 μm coherent detection channel provides integrated-path and high-resolution measurements of atmospheric wind fields.By combining these two channels, the complex lidar system acquires information on atmospheric wind fields while simultaneously assessing the concentration of atmospheric pollutant cloud clusters.This integrated approach enhances the traceability of atmospheric pollutant movement and facilitates the prediction of diffusion trends.As such, it contributes to decision-making for future protective measures.
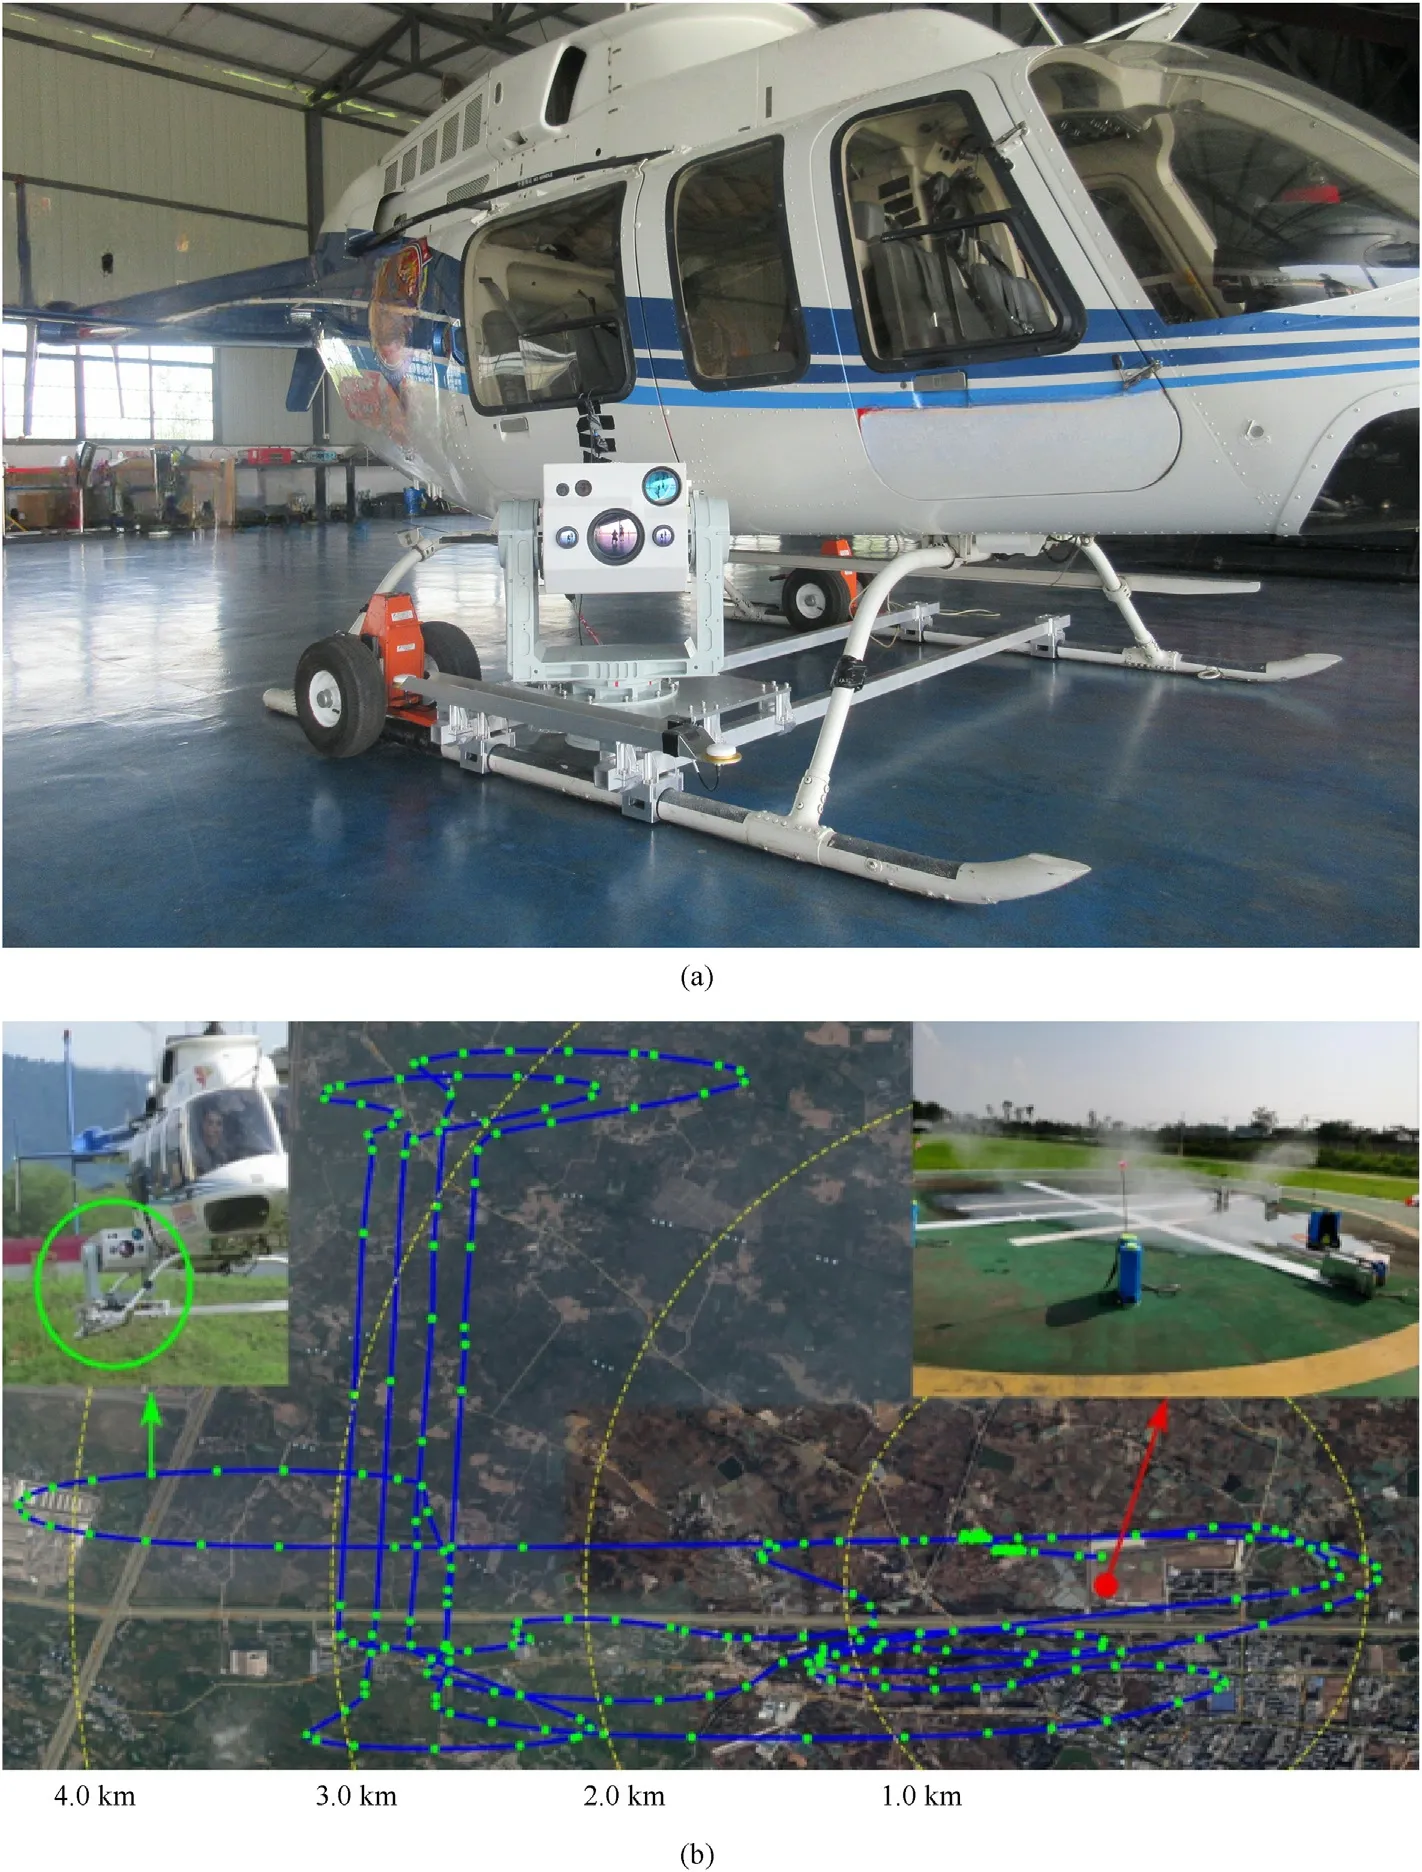
Fig.5.The liar and flight experiment: (a) the lidar system installed on the lower side of the aircraft; (b) Site and flight trajectory.
3.Results and discussion
3.1.Static experiment
The field test was conducted with the background object positioned approximately 5 km away from the lidar system.In order to measure the target gas, an ammonia cloud was intentionally released at a distance of approximately 400 m in front of the background object.During the experiment, the CL values (representing the product of concentration and path length) and the distance to the cloud cluster were determined and recorded.The obtained measurement results,as depicted in Fig.3,were obtained using the pollute analyzer integrated with the developed lidar system.The measurement from the CDL channel indicated a distance of 4560 m to the front of the pollutant cloud cluster,while the CDL channel provided a lambertian target distance of 4990 m,and the DIAL channel yielded a target distance of 5030 m.These variations in distance values can be attributed to the differences in calculation methods, accuracy, and the requirement for distance calibration between the two approaches.At approximately the 177th second,the lidar system was initiated,and the pollutant gas was released,forming a radius of approximately 1 m.Based on the estimated amount of spray,the average concentration of ammonia aerosol was approximately 55 mg/m3.Utilizing the multiwavelength DIAL algorithm, CL value for ammonia exceeded the threshold of 20 mg/m3,confirming the presence of ammonia as the target gas.The average CL value of the measured pollutant gas is 120 mg/m2, and the length of the cloud cluster is 2 m, so the measured concentration value of the pollutant gas is 60 mg/m3,and the relative error compared with the estimated value is 9.1%.Moreover,the CL value gradually increased over time.The spraying process was halted at approximately the 305th, and subsequently,the CL value of ammonia began to gradually decrease.The results obtained from the field test successfully provided both the distance to the front of the pollutant cloud and the CL values, which are achieved not achieved with conventional integrated-path DIAL systems.
Fig.4 shows the comparison between the CDL of the system and the wind field measurement of a reference wind lidar.Table 3 shows the basic parameters of the reference lidar.Through comparison,it can be found that the trend of wind profiles measured by the two lidars in the test is consistent,with a correlation coefficient of 0.998 for horizontal wind and 0.899 for wind direction.
3.2.Flight experiment
The field measurements reported in this study were carried out in Chengdu, China, marking the inaugural airborne evaluation of the developed lidar system.A Bell 407 helicopter was employed for the experiment,with the lidar system installed on the lower side of the aircraft, as depicted in Fig.5(a).Fig.5(b) shows site and flight trajectory.The flight test was conducted over a period of 12 h,from 6:20 a.m.to 6:20 p.m.Before takeoff, a sprayer was positioned before the designated lambertian target location.During the flight,the helicopter maintained a constant altitude of 300 m above ground level,with the maximum distance from the target reaching 4 km.While in flight, the lidar system was directed towards the target for evaluation,and the lidar’s orientation was adjusted using video tracking to precisely target the intended spray location.The lidar system automatically detected and recorded data related to ammonia concentration distances,radial wind measurements,and other pertinent parameters.Horizontal Plan Position Indicator(PPI)scans were conducted to capture the spatial distribution and diffusion patterns of ammonia.The lidar system was positioned at a distance of approximately 1 km above the ground, with the elevation angle ranging from 45°to 65°in 1°increments.Fig.5 illustrates the results of the horizontal scans at three distinct time points.Fig.6(a)depict the concentration of ammonia aerosol following ground spraying, while Fig.6(b) present the wind field data measured within the scanning range of the lidar.These figures provide insights into the movement patterns of the measured ammonia aerosol, which exhibit a correlation with the wind flow.The information obtained from these scans can be shared with relevant authorities to enhance their understanding of pollution trends and facilitate effective measures to safeguard public safety.
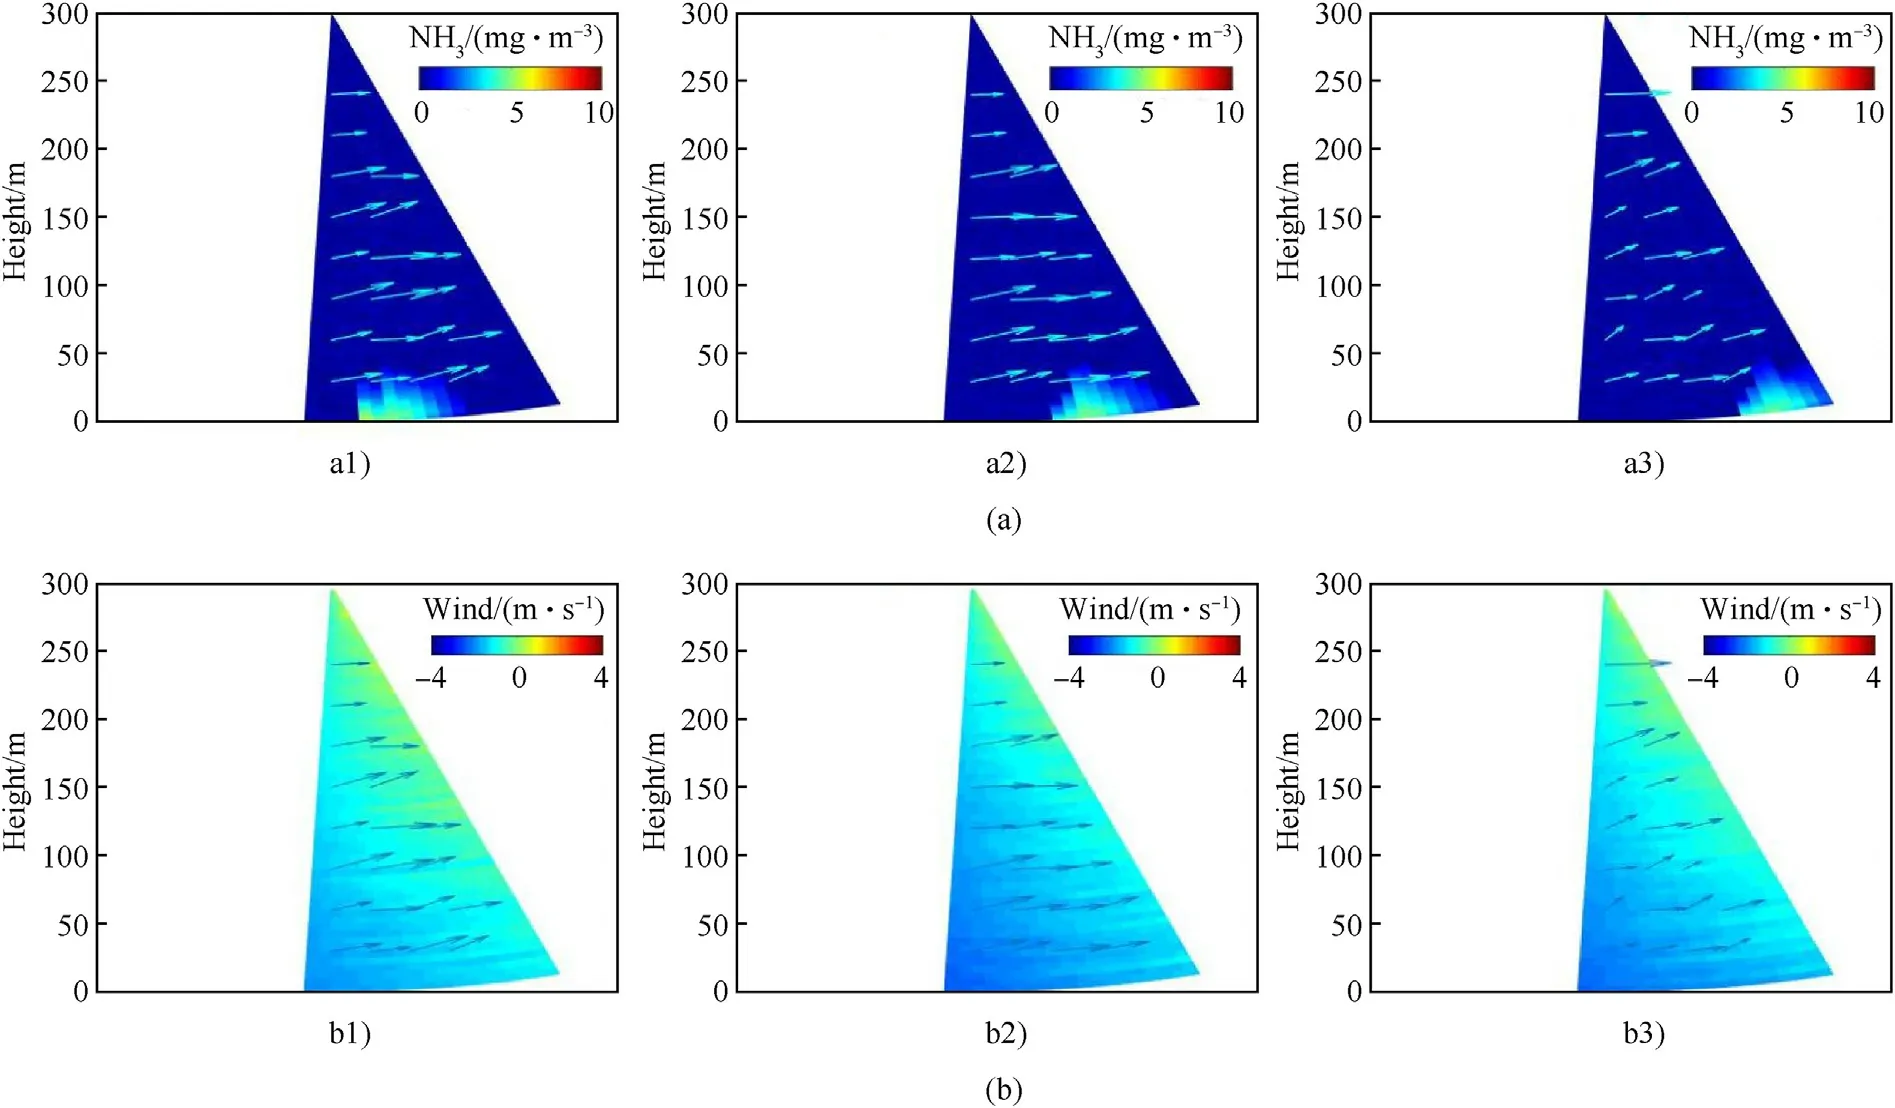
Fig.6.Horizontal scanning results at three time points: (a) presents NH3 Concentration; (b) presents wind field data.
4.Conclusions
The study culminates by introducing an airborne laser complex system that integrates DIAL and CDL techniques for remote sensing of atmospheric pollution.This advanced system demonstrates the capability to monitor gaseous pollutants,real-time,and accurately measure the distances of cloud clusters within a 4-km range.Flight experiments were conducted utilizing a Bell 407 helicopter equipped with the developed airborne lidar system.The results obtained from these experiments vividly illustrate the effectiveness of the system in monitoring atmospheric pollutants, issuing alerts when necessary, and detecting atmospheric wind fields.The system enables the retrieval of crucial information such as spatial distribution and diffusion trends of atmospheric pollutants.Future research should focus on further refining key algorithms,including the enhancement of the multi-wavelength DIAL inversion algorithm and the establishment and optimization of aerosol diffusion models.These advancements hold the potential to augment the system’s overall accuracy, ultimately contributing to the enhancement of public safety in relation to atmospheric pollution.
Declaration of competing interest
The authors declare that they have no known competing financial interests or personal relationships that could have appeared to influence the work reported in this paper.

- Defence Technology的其它文章
- Reply to the note by Li Piani et al.
- Book review:“Impact Engineering:Fundamentals,Experiments and Nonlinear Finite Elements”By Marcilio Alves(2020)Price at Amazon: US$ 85.67.www.impactbook.org
- Note on: “Ballistic model for the prediction of penetration depth and residual velocity in adobe: A new interpretation of the ballistic resistance of earthen masonry”
- Micro defects formation and dynamic response analysis of steel plate of quasi-cracking area subjected to explosive load
- Experimental and numerical study on protective effect of RC blast wall against air shock wave
- Predict the evolution of mechanical property of Al-Li alloys in a marine environment