響應(yīng)面優(yōu)化超聲提取苦蕎麥苗黃酮的研究
2010-03-24 09:04:43高云濤付艷麗張寶通
食品科學(xué) 2010年24期
高云濤,付艷麗,王 辰,馬 雷,張寶通
(云南民族大學(xué)化學(xué)與生物技術(shù)學(xué)院,云南 昆明 650031)
響應(yīng)面優(yōu)化超聲提取苦蕎麥苗黃酮的研究
高云濤,付艷麗,王 辰,馬 雷,張寶通
(云南民族大學(xué)化學(xué)與生物技術(shù)學(xué)院,云南 昆明 650031)
研究苦蕎麥苗黃酮超聲提取方法。采用三因素五水平的星點(diǎn)設(shè)計(jì)響應(yīng)面分析研究影響苦蕎麥苗黃酮超聲提取條件。最佳提取條件為:乙醇體積分?jǐn)?shù)76.2%、液固比28.5:1(mL/g)、超聲時(shí)間25min,在最佳提取條件下,苦蕎麥苗黃酮提取率為3.64%。結(jié)果表明,超聲提取具有簡(jiǎn)單、低成本和高效的特點(diǎn),可有效改善總黃酮的提取,苦蕎麥苗可作為健康食品和黃酮原料具有較好的應(yīng)用前景。
苦蕎麥苗;黃酮;超聲提取;響應(yīng)面分析
Buckwheat (Fagopyrum esculentum), belonging to fagopyrum of polygonaceae, is widely planted in China and many other countries of the world[1]. A number of studies[2-4]have found that buckwheat extracts have a strong antioxidative activity and could reduce the risk of age-dependent diseases, which have something to do with the high content of flavonoids. The commonly planted species of buckwheat are common buckwheat and tartary buckwheat[5]. Recently tartary buckwheat seedling, as a sprout vegetable, is extensive used in China and Japan as a natural food to promote good health owing to its high content of flavonoids[6-8].
In order to make full use of tartary buckwheat seedling, it is necessary to develop the efficient extraction techniques of flavonoids from tartary buckwheat seedling. Ultrasoundassisted extraction of flavonoids is an inexpensive, simple and efficient alternative to conventional extraction techniques[9], and has been proved to decrease extraction time and increase flavonoids extraction yield significantly for many plant materials[9-11].
In the present work, ultrasound-assisted extraction of flavonoids from tartary buckwheat seedling cultivated on high-cold area, southwest of China was investigated. The parameters were optimized using response surface methodology(RSM)[12], with a central composite design(CCD)[13], and the proposed method was also compared with conventional heating extraction method.
1 Material and Methods
1.1 Materials and Reagents
Tartary buckwheat seedling used in research was cultivated on Longhai Mountain, Yunnan Luoping, kindly supplied by Kunming Kamai Boi-Tech Co. Ltd., and was powdered to a particle size less than 0.5 mm before the experiment.
1.2 Instruments and Equipments
AS10200AD ultrasound cleaning bath (China Tianjin Autoscience instrument Co., Ltd.) with 330 cm×270 cm× 290 cm internal dimensions, a volume of 10.0 L, 40/60 kHz and 4 transducers was used in the experiment, operating at a frequency of 60 kHz with input power of 320 W. The extraction vessel was put at the center of the bath in the process of the experiment, The temperature was controlled and maintained at (35±1) ℃ by circulating external water from a thermostated water bath.
1.3 Methods
1.3.1 Ultrasound-assisted extraction
1.0 g dried tartary buckwheat seedling powder were accurately weighed and then soaked in a ethanol solution (varying ethanol volume fraction from 58.2% to 91.8%(V/V); varying liquid/solid ratio from 8.18 to 41.8)for 2.0 h, and then placed in ultrasound bath and sonicated at 35 ℃ for certain time(varying extraction time from 8.18 to 41.8 min). The solution was filtered off through 0.45μm microporous membrane. The filtrate was extracted by 25 mL of petroleum ether to get rid of fats oils and chlorophyll, and then taken for total flavonoids content analysis. The extraction yield of total flavonoids was defined by the ratio between the mass of total flavonoids in liquid and the mass of tartary buckwheat seedling added to the system.
1.3.2 Determination of total flavonoids content
The total flavonoids content was determined using a colorimetric method described by Jia, Tang et al[14]with slightly modified. To 1.0 mL diluted sample, 0.3 mL NaNO3solution (5%), 0.6 mL A1Cl3solution (0.1 g/mL and 2.0 mL NaOH solution (1.0 mol/L) were added. The final volume was adjusted to 10.0 mL with deionised water. The absorption was measured at 507 nm against the same mixture, without the sample as a blank. The amount of the total flavonoids was expressed as rutin(Sigma Chemicals Co.)quivalents (mg rutin/g sample). The calibration curve (Y=9.27X-0.0119, where Y is absorbance value, X sample concentration) ranged 0.75 -6.0 mg/mL (R2=0.9993).
1.3.3 Experimental design
Single-factor experiment indicated that the extraction yield increased with the increase of extraction time from 10 to 25 min, and ethanol volume fraction from 60% to 75% (V/V) and liquid/solid ratio from 10 to 25:1 mL/g , but, the extraction yield decreased slightly as extraction time increased above 25 min, ethanol volume fraction beyond 75% (V/V) and liquid/solid ratio beyond 25:1 mL/g. So, the central point of the central composite design was 25 min of extraction time, 75% (V/V) of ethanol volume fraction and 25 mL/g of liquid/ solid ratio.
The central composite design(CCD)with 3 factors and five levels was employed in this regard. The range and center point values of three independent variables in Table 1 were based on the results of single-factor experiment. The variables were coded according to Eq. (1):

where xiis the (dimensionless) coded value of the variable Xi, X0is the value of Xiat the centre point, and ΔX is the step change. The behavior of the system was explained by the following second degree polynomial equation:

Where Y is the response variable (extraction yield of total flavonoids in real value), A0is constant, and Ai, Aiiand Aijare coefficients estimated by the model. Xi, Xjare levels of the independent variables, they represent the linear, quadratic and cross-product effects of the X1, X2and X3factors on the response, respectively.

Table 1 Independent variables and their levels used for central composite design
Analysis of the experimental design and calculation were performed using DESIGN EXPERT software (version 7.0, Stat-Ease Inc., Minneapolis, MN, USA). Analyses of variance were performed by ANOVA procedure. Mean values were considered significantly different when P<0.05.
2 Results and Discussion
2.1 Optimization of ultrasound-assisted extraction for total flavonoids from tartary buckwheat seedling
The value of responses (extraction yield of total flavonoids) at different experimental combination for codedvariables is given in Table 2, the response variable and the test variables are related by the following second-order polynomial equation:

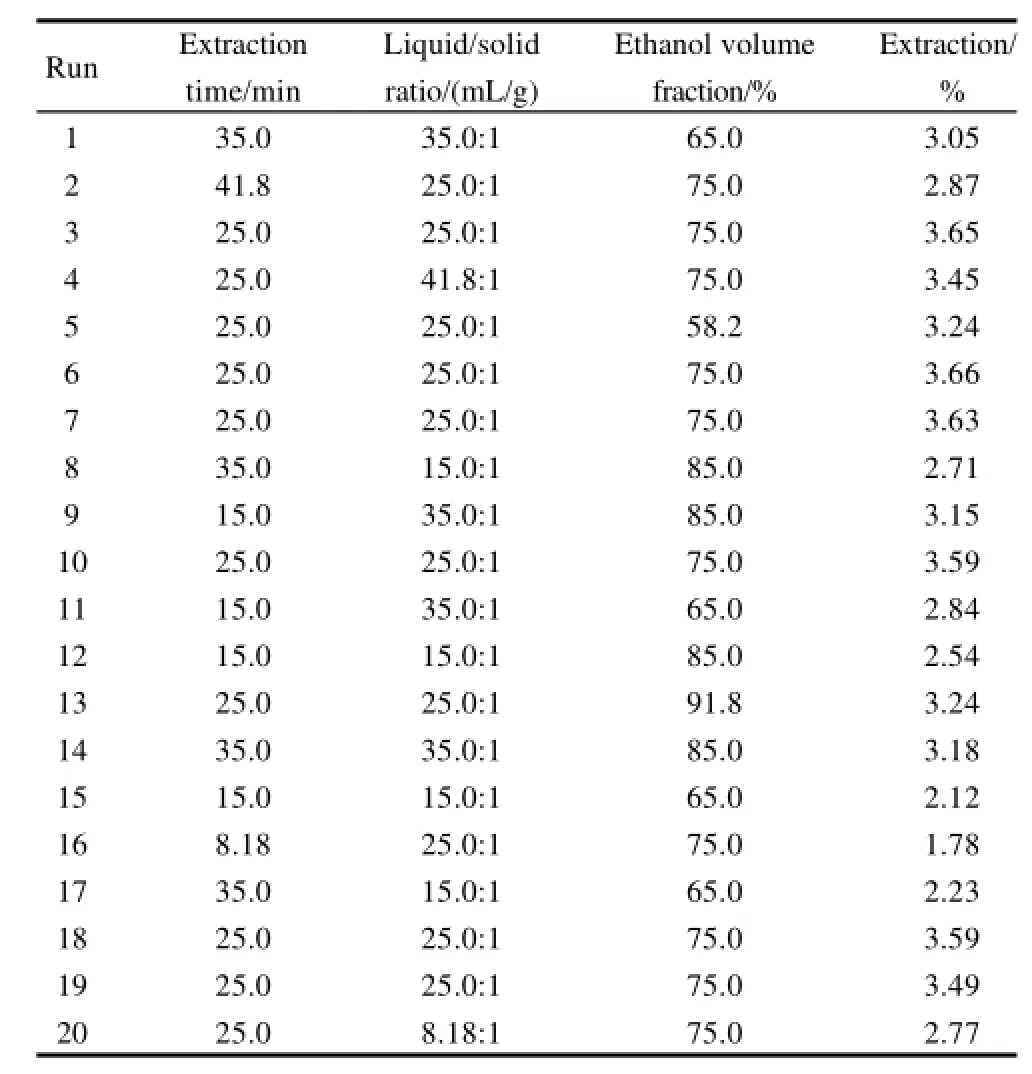
Table 2 Results of response surface analysis of total flavonoids from tartary buckwheat seedling with factors extraction time(X1), Liquid/ solid ratio(X2) and ethanol volume fraction(X3)
The data show a good fit with the Eq.(3) (R2=0.924) and statistically acceptable at P<0.001 level (P>F=0.000176) (Table 3). The statistical analysis gives that liner term as liquid/solid ratio (P=0.00068) and quadratic terms as liquid/ solid ratio (P=0.00482) and extraction time (P<0.0001) for extraction yield of total flavonoids are highly significant (P<0.01), and liner term as extraction time (P=0.0128) and quadratic terms as ethanol volume fraction (P=0.0197) are significant (P<0.05). The interaction between extraction time and liquid/solid ratio (P=0.961), extraction time and ethanol volume fraction (P=0.857), and ethanol volume fraction and liquid/solid ratio (P=0.466) are non-significant terms (P>0.05).
The three-dimensional response surfaces are shown in Figs. la-c. Fig.1a shows the simultaneous effect of extraction time and liquid/solid ratio on extraction yield, it could be seen that extraction yield increased with increase of extraction time from 8.18 to 28 min and liquid/solid ratio from 8.18:1 to 30:1. But, the extraction yield decreased with increasing extraction time beyond 28 min and liquid/solid ratio beyond 30. The effect of extraction time and ethanol volume fraction on extraction yield shown in Fig.1b demonstrates that the extraction yield increased with the increase of extraction time while an increase in ethanol volume fraction also leads to a increase in extraction yield, the initial increase of the extraction yield was followed by a decrease after extraction time more than 28 min at a ethanol volume fraction above 75%. Fig.1c shows the effect of liquid/solid ratio and ethanol volume fraction on the extraction yield, the extraction yield increases with increase ethanol volume fraction from 58.2% to 75% at liquid/solid ratio below 30. However, more than 75% ethanol volume fraction in liquid/solid ratio above 30% appeared to be disadvantaged on the extraction.
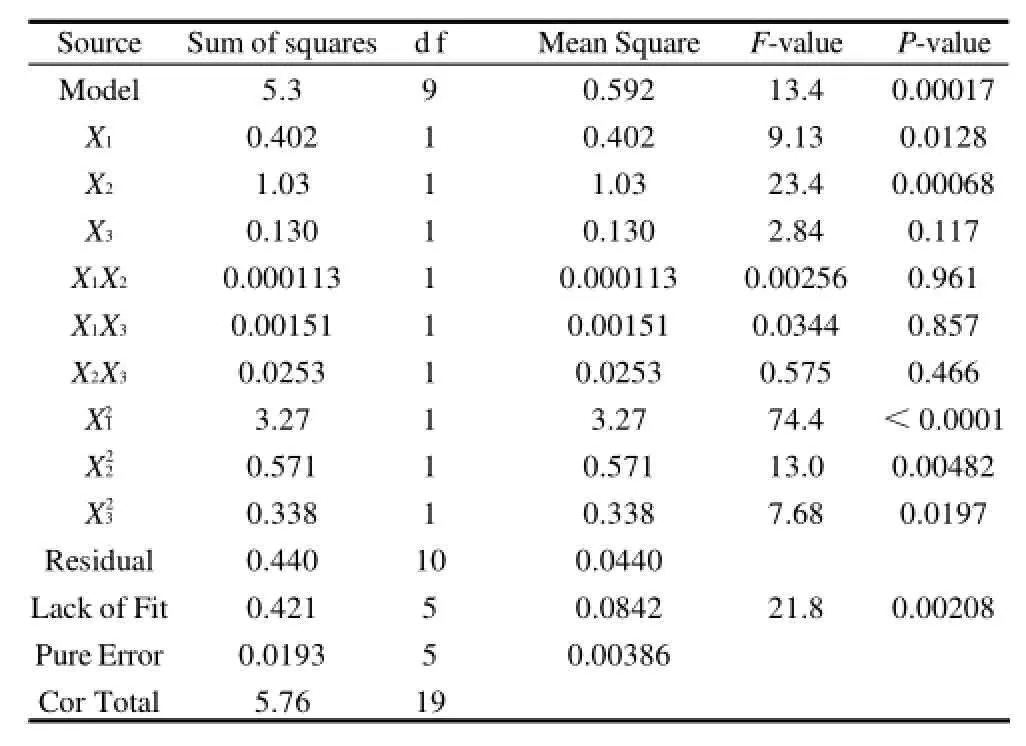
Table 3 Analysis of variance(ANOVA)for response surface quadratic model
From Figs.1b-c, it could be observed that increase of extraction time from 8.18 to 28 min enhanced the extraction, whilst at the extraction time more than 28 min shows a decreasing effect. This could be explained that as the extraction time prolongs, the chemical decomposition of flavonoids compound present in extract may occur, resulting in a decrease in extraction yield[15].

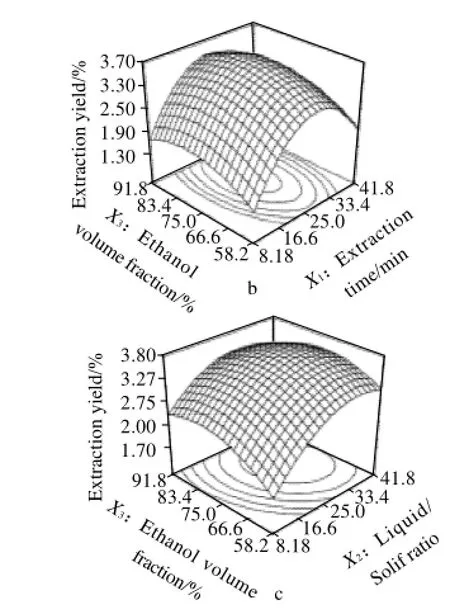
Fig.1 Response surface(3D)showing the effect of extraction time(X1), liquid/solid ratio(X2), and ethanol volume fraction(X3)on the response value of extraction yield
According to gradient of slope in the 3-D response surface plots(Fig.1)and P>F in table 3, the importance of the independent variables on the extraction yield could be ranked in the following order: liquid/solid ratio (X2)>extraction time (X1)>ethanol volume fraction (X3). The interactive effect of three factors on extraction yield is insignificant.
2.2 Optimization using the desirability function
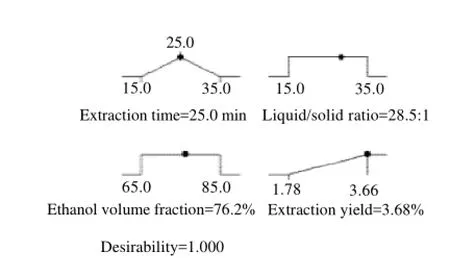
Fig.2 Desirability ramp for numerical optimization
Fig.2 shows a ramp desirability that was generated from 8 optimum points via numerical optimization; the best local maximum is found to be at extraction time 25.0 min, liquid/ solid ratio of 28.5:1 and ethanol volume fraction of 76.2%. The prediction value of extraction yield was 3.68%. The obtained value of desirability (1.000) shows that the estimated function may represent the experimental model and desired conditions.
2.3 Verification of predictive model and comparison with heating extraction
Experimental rechecking was performed using this deduced optimal condition. A mean value of 3.64±0.061(n=3), obtained from real experiments, was in agreement with predictive value, which confirms that the response model was validation and adequate for reflecting the expected optimization.
Table 4 shows that ultrasound-assisted extraction could produce 3.64% total flavonoids extraction yield, which is higher than that of heating extraction (3.52%), and ultrasound-assisted extraction could greatly shorten the extraction time and lower extraction temperature for total flavonoids extract. It can be also found that ultrasound-assisted extraction had higher flavonoids content in extract (33.1%) than that of heating extraction (26.4%).
It is also observed that tartary buckwheat seedling has much higher flavonoids content than common buckwheat seedling(1.056%[16]). This result confirms that tartary buckwheat seedling has the great potential as a health food and a resource of flavonoids.
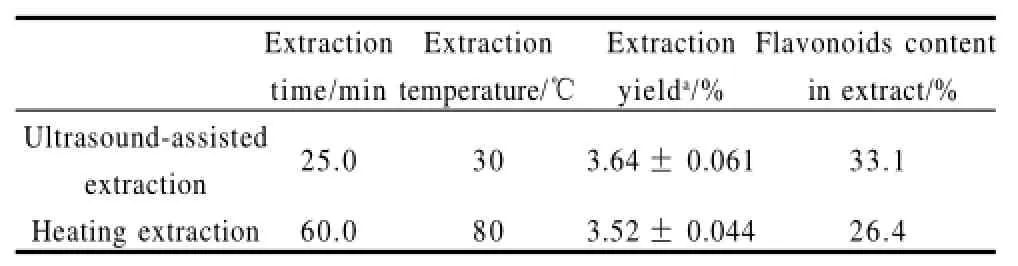
Table 4 Comparison of ultrasound-assisted extraction and heating extraction
3Conclusions
The statistical testing and the 3-D response surface plots indicated that the changes of liquid/solid ratio and extraction time on the response Y had a significant effect on total flavonoids extraction yield. The optimal prediction value of extraction yield was agreement well with the experimental result under the optimal extraction conditions of extraction time 25.0 min, liquid/solid ratio of 28.5:1 and ethanol volume fraction of 76.2% as Fig. 2 shown.
This study confirms the great potential of tartary buckwheat seedling as a health food and a resource of flavonoids for its high flavonoids content and the efficiency of ultrasound-assisted extraction as a simple, inexpensive and effective method to improve the extraction of flavonoids from tartary buckwheat seedling.
[1]ZHAO Guang, TANG Yu, WANG Anhu. Research of composition and function of tartary buckwheat and its development and application [J].Journal of Sichuan Agriculture University, 2001, 19 (4): 355-358.
[2]WATANABE M. Catechins as antioxidants from buckwheat (Fagopyrum esculentum Moench) groats [J]. Journal of Agricultural and Food Chemistry, 1998, 46 (3): 839-845.
[3]ZHANG Min, CHEN Haixia, LI Jinlei, et al. Antioxidant properties of tartary buckwheat extracts as affected by different thermal processing methods [J]. LWT-Food Science and Technology, 2010, 43(2): 181-185.
[4]LIN Liyun, LIU Hsiuman, YU Yawen, et al. Quality and antioxidant property of buckwheat enhanced wheat bread [J]. Food Chemistry, 2009, 112(4): 987-991.
[5]KIM Sunju, ZAIDUI S M l, TATSURO S, et al. Comparison of phenolic compositions between common and tartary buckwheat(Fagopyrum) sprouts [J]. Food Chemistry, 2007,110(4): 814 -820.
[6]YAO Yaping, TIAN Chengrui, CAO Wei. Anti-oxidative constituents of ethanol extract from buckwheat seeds by HPLC-electro-spray MS [J]. Agricultural Sciences, 2008, 7(9): 356-362.
[7]JAYAPRAKASHA G K, MANDADI K K, POULOSE S M, et al. Inhibition of colon cancer cell growth and antioxidant activity of bioactive compounds from Poncirus trifoliata (L.) Raf [J]. Bioorganic & Medicinal Chemistry, 2007, 15(14): 4923-4932.
[8]ZHAO Lixia, TAN Jun, PAN Siyi, et al. The utilization and good prospects for buckwheat seedling [J]. Food Science, 2006, 27(4): 267-269.
[9]KIMBARIS A C, SIATIS N G, DAFERERA D J, et al.Comparison of distillation and ultrasound-assisted extraction methods for the isolation of sensitive aroma compounds from garlic (Alliurn sativurn)[J]. Ultrasonics Sonochemistry, 2006, 13(1): 54-60.
[10]LEE M H, LIN C C. Comparison of techniques for extraction of isoflavones from the root of Radix Puerariae: ultrasonic and pressurized solvent extractions[J]. Food Chemistry, 2007,105(7): 223-228.
[11]ROSTAGNO M A, PALMA M, BARROSO, C G. Ultrasound-assisted extraction of isoflavones from soy beverages blended with fruit juices[J]. Analytica Chimica Acta, 2007, 597(2): 265-272.
[12]LIANG Renjie. Optimization of extraction process of glycyrrhiza glabra polysaccharides by response surface methodology[J]. Carbohydrate Polymers, 2008,74(4): 858 -861.
[13]MASMOUDI M, BESBES S, CHAABOUNI M, et al. Optimization of pectin extraction from lemon by-product with acidified date juice using response surface methodology [J]. Carbohydrate Polymers, 2008, 74(2): 185-192.
[14]JIA Zhishen, TANG Mengcheng, WU Jianming. The determination of flavonoid contents in mulberry and their scavenging effects on superoxide radicals[J]. Food Chemistry, 1999, 64(4): 555 -599.
[15]WANG Lu, LI Dan, BAO Changli, et al. Ultrasonic extraction and separation of anthraquinones from Rheum palmatum L. [J]. Ultrasonics Sonochemistry, 2008, 15(5): 738-746.
[16]LIU Renjie, LU Chengwen, GUO Zhijun, et al. Research on the change of total flavonoids content in different growing period of buckwheat seedling[J]. Journal of Jilin Agricultural Sciences, 2007, 36(6): 58-60.
O622.4
A
1002-6630(2010)24-0028-05
2010-02-25
云南省社會(huì)發(fā)展科技項(xiàng)目(2007B148M)
高云濤(1962—),男,教授,博士,研究方向?yàn)槭称坊瘜W(xué)。E-mail:yuntaogao@sohu.com
猜你喜歡
房地產(chǎn)導(dǎo)刊(2022年5期)2022-06-01 06:20:14
體育科技文獻(xiàn)通報(bào)(2022年3期)2022-05-23 13:46:54
遼金歷史與考古(2021年0期)2021-07-29 01:06:54
建材發(fā)展導(dǎo)向(2021年12期)2021-07-22 08:06:48
建材發(fā)展導(dǎo)向(2021年7期)2021-07-16 07:07:52
中學(xué)生數(shù)理化(高中版.高二數(shù)學(xué))(2021年12期)2021-04-26 07:43:48
科技傳播(2019年22期)2020-01-14 03:06:54
民用飛機(jī)設(shè)計(jì)與研究(2019年4期)2019-05-21 07:21:24
中成藥(2017年8期)2017-11-22 03:19:40
中成藥(2017年10期)2017-11-16 00:50:13