Tracking Submicron Particles in Microchannel Flow by Microscopic Holography*
2012-10-31 03:35:22LUORui羅銳andLIUShi劉石
LUO Rui (羅銳) and LIU Shi (劉石)**
1 State Key Laboratory of Control and Simulation of Power System and Generation Equipments, Department of Thermal Engineering, Tsinghua University, Beijing 100084, China 2 State Key Laboratory of Alternate Electrical Power System with Renewable Energy Sources, North China Electric Power University, Beijing 102206, China
Tracking Submicron Particles in Microchannel Flow by Microscopic Holography*
LUO Rui (羅銳)1and LIU Shi (劉石)2,**
1State Key Laboratory of Control and Simulation of Power System and Generation Equipments, Department of Thermal Engineering, Tsinghua University, Beijing 100084, China2State Key Laboratory of Alternate Electrical Power System with Renewable Energy Sources, North China Electric Power University, Beijing 102206, China
Three-dimensional tracking of submicron particles in flows in a micro-channel was carried out using in-line holographic microscopy. A fixed single 0.5 μm fluorescent particle was identified and isolated from dust particles or overlapped particle pair using the laser induced fluorescent (LIF) method. Then in-line microscopic holograms of the fixed single particle were obtained at different positions on the optical axis, i.e. the defocus distances.The holograms of the single particle were used as the model templates with the known defocus distances. The particles in the in-line microscopic holograms of flow in the microchannel were then identified and located to obtain their two-dimensional positions. The defocus distances of those particles were determined by matching each hologram pattern to one of the model templates obtained in the single particle test. Finally the three-dimensional position and velocity of each particle were obtained.
in-line hologram, microscopic holography, submicron particle, micro-channel laser induced fluorescence
1 INTRODUCTION
Digital in-line holography has been applied extensively to measure the particle field in the past decades[1, 2]. As microfluidic devices have been used in the lab-on-a-chip systems, micro chemical reactors, and so on, there is an urgent need for the three-dimensional tracking techniques for the measurements of micron and submicron particles. Using high numerical aperture(NA) microscope objective, movement and size of micro particles in a flow filed could be measured with high spatial and temporal resolutions by the digital microscopic holography [3]. In particular, it is capable of tracking moving particles through the complex optical path by reconstructing holograms in which the diffraction noise from optical distortions and non-moving objects has been removed by subtracting an averaged background image from them [4]. However, as the particle size decreases to below one micron, the diffraction pattern images of particles become very dim and may be obscured by optical noise. As a result, it is difficult to track the submicron particles in high accuracy particularly on the optical axes [5]. On the other hand, the laser induced fluorescence (LIF) method with a microscope objective under off-design condition is capable of tracking submicron fluorescent particles [6].The tracking accuracy on the optical positions of particles is better than 1%, but it requires a powerful laser to induce the fluorescence or a long shutter time to receive the weak fluorescence.
The in-line microscopic holography and the LIF method have similar optical principles. The diffraction patterns of particles are formed from either the particle forward scattering of laser beam or fluorescence emission of the particles which may be considered to be point sources. The diffraction patterns have been used to determine the particle positions along the optical axe and the sizes of the particles by matching the measured patterns to the calculated ones [5, 7-9]. In this way, in comparison with the direct reconstruction of particle holograms, not only the higher tracking accuracy can be achieved but also the dependence of the tracking accuracy on the axial position can be known. However, the verification of the matching requires the clear diffraction pattern images of submicron particles with known accurate axial positions. In other words, the diffraction pattern library, which will be used for matching, should be proved and modified by the measured pattern images.
In the present study, an in-line holographic system was setup to investigate three-dimensional tracking of moving submicron particles in a microchannel on a micro-fluidic chip. A laser induced fluorescence(LIF) system was used to identify and locate a 0.5 μm fluorescent particle. Then the in-line holograms of the single particle at different positions on the optical axis were obtained as the model templates. Then the axial positions of particles in flows in the microchannel were determined by matching the hologram image of each particle in the in-line holograms to one hologram pattern in the model templates rather than a direct reconstruction of the holograms.
2 EXPERIMENTAL SETUP
The holographic system is shown in Fig. 1. Aconventional epifluorescent microscope was used to observe the submicron particles in two different ways,i.e. the laser induced fluorescence and in-line holography, which allowed obtaining both LIF and in-line holographic diffraction patterns of an isolated 0.5 μm fluorescent particle at a fixed optical axial distance. In this way, the laser induced fluorescence diffraction pattern image could be compared with that of in-line holography of the same particle. The LIF and holography could not run simultaneously, therefore two different observations were done only for fixed particles in order to calibrate the relations between their diffraction patterns and optical axis distances. The fluorescent particles were excited with a 532 nm laser with a power of 300 mW and emitted fluorescence with a peak wavelength of 612 nm and a 30 nm waveband width. More details of the experimental setup and procedures can be found in [6, 9].
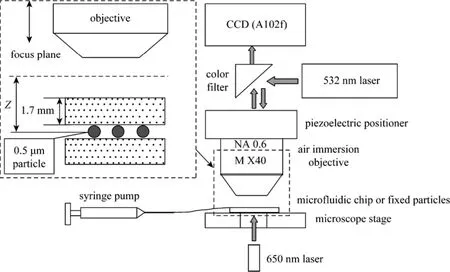
Figure 1 In-line holographic and LIF systems

Figure 2 Micro-fluidic chip and bright field pictures of the top view (right upper) and the cross section of the microchannel(right lower) taken using a microscope objective of M 60
The in-line holographic system was setup by simply replacing the backlight of the microscope with a 5 mW diode laser of 650 nm wavelength. The nearly collimated beam of the 650 nm laser was aligned vertically through the microchannel beneath. The laser beam scattered by the 0.5 μm fluorescent particles and micro-channel was collected by the same objective,which was also used for receiving fluorescence from the particles when LIF measurement was on-going.The distance between the fixed particles and the objective could be changed using a piezoelectric positioner (PI, Germany) mounted between the objective and the microscope body. The distance could vary over 100 μm with accuracy better than 10 nm. The fluorescent particles were fixed between two glass slides, and the upper slide between the fixed particles and the microscope objective was the same cover glass of the microchannel. The fixed particle was prepared in the same way as before [6].
The microchannel of 27 μm deep and 97 μm wide in Fig. 2 was fabricated on a piece of 1.7 mm thick glass with a refractivity of 1.515. The bottom surface of the micro-channel formed by the etching technique was not optically flat. A typical in-line hologram of the micro-channel showed that the microchannel had a non-uniform depth particularly in both of the lateral and longitudinal directions.
0.01 mol·L-1borax aqueous seeded with 0.01%volume fraction fluorescent particles was used as the working fluid to prevent the negatively charged particles from sticking on the positively charged surfaces of the micro-channel glass. The working fluid was forced to go through the micro-channel using a syringe pump with a 1 ml gas tight plastic syringe.
The whole experimental setup was placed on an air-borne optical platform of 1.2 m wide and 2.4 m long to minimize influence on the in-line holographic system from randomly environmental vibration and shake.
3 RESULTS AND ANALYSIS
3.1 In-line holograms of a single particle at various defocus distances
The fixed particles were observed by both of the in-line holography and LIF methods and the diffraction patterns were acquired using an A102f CCD camera (Basler, Germany). The fixed particle set was placed on the microscope stage. The microscope objective could be moved up and down by the piezoelectric positioner. As a result, the particle positions from the focus plane, i.e. the defocus distance, were changed.
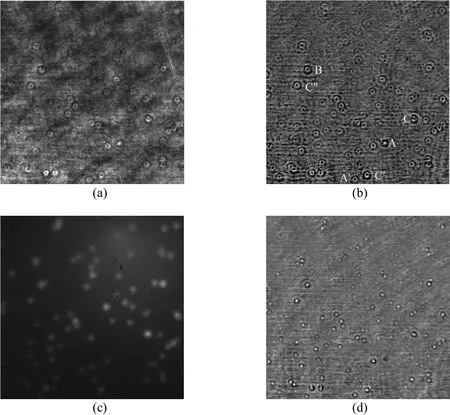
Figure 3 An original in-line hologram of the fixed particles at Z 20 μm (a), the same one with the noise removed (b), the LIF diffraction patterns at Z = 20 μm (c), and the hologram at Z 10 μm (d)
At first the microscope was focused on the particle using bright field illumination and made the particle image as clear as possible. Since the microscope objective was designed for air immersion and had a limited resolution about 0.5 μm, 1.7 mm thick glass piece actually aberrated the particle image and the particle on the focus might not be a real 0.5 μm fluorescent particle but something else, like a tiny dust. In order to check the particle, bright field illumination was turn off and it was observed using LIF. Once the particle was verified as a fluorescent particle, its diffraction pattern image of LIF was acquired and, then,the in-line hologram was also recorded at a much shorter shutter time while the path of 532 nm laser was closed to prevent photobleaching of fluoresceine.The particle was considered as on focus, i.e. its defocus distance is zero.
Then the defocus distance Z (see Fig. 1) of the particles was increased or decreased in a step of 1 μm.At each step, an in-line hologram and a LIF image were taken alternatively. Fig. 3 (a) shows an original in-line hologram of the fixed particle set with the defocus distance Z 20 μm. The LIF diffraction pattern image with the same defocus distance is shown in Fig.3 (c). The original hologram had heavy optical noise.The noise could be partially removed by the background subtraction. The background image was obtained by averaging all holograms with different defocus distances. Fig. 3 (b) shows the same hologram of Fig. 3 (a) with the noise removed. The hologram at Z 10 μm is shown in Fig. 3 (d). The holograms and LIF patterns were acquired with shutter times of 0.2 ms and 25 ms.
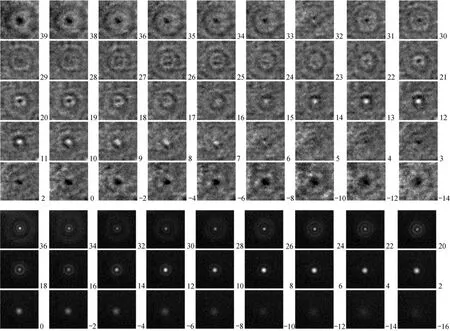
Figure 4 In-line holograms (upper) and LIF diffraction patterns (lower) of a fixed 0.5 μm fluorescent particle at different defocus distances Z (right-down corner, μm). A negative defocus distance is close to the objective
With the help of the LIF image, whether the holograms were generated from single fluorescent particles or from dust particles and overlapped particle pairs could be identified to obtain the real single particle hologram patterns. For example, holograms A and A′ in Fig. 3 (b) were generated from dust particles since they could not be found in the LIF image Fig. 3(c). In a similar way, holograms C, C′ and C″ were generated from particle pairs. The particle pairs, like B in Fig. 3 (b), not only generated the holograms with larger size and stronger image contrast but also might obscure other neighbor particles.
Figure 4 shows the in-line holograms (up) and LIF diffraction patterns of a fixed 0.5 μm fluorescent particle at different defocus distances Z. The defocus distance Z (μm) is given in the lower-right corner of each picture. A negative defocus distance means that the particle was close to the microscope objective.
Although each in-line hologram of the fixed particle was treated by subtracting an average background image over all holograms, it still contains some unwanted fringes and background noises because those noises might also change from one hologram to another. Since the holograms were not acquired in continuous shooting, the background subtraction could not remove the varying background noises. On other hand, the LIF diffraction patterns have much smaller noises and clearer images. However, the shutter time for the in-line holography was 0.2 ms and was much smaller than that for the LIF (25 ms). This implies that the fast moving particles could be tracked by the in-line holography instead of the LIF.
In addition, the in-line holograms of the particle change more dramatically with the defocus distance Z in the some range of Z than its LIF diffraction patterns.For example, the centers of the in-line holograms change from bright at Z 14-15 μm to dark at Z= 17-18 μm and, then, a similar change occurs in Z = 22-30 μm while the LIF diffraction patterns maintain bright centers. Therefore the defocus distance may be determined from the in-line hologram at a higher accuracy since a larger hologram pattern change with the defocus distance implies a better resolution of Z.
3.2 Tracking 0.5 μm particles in a micro-channel flow
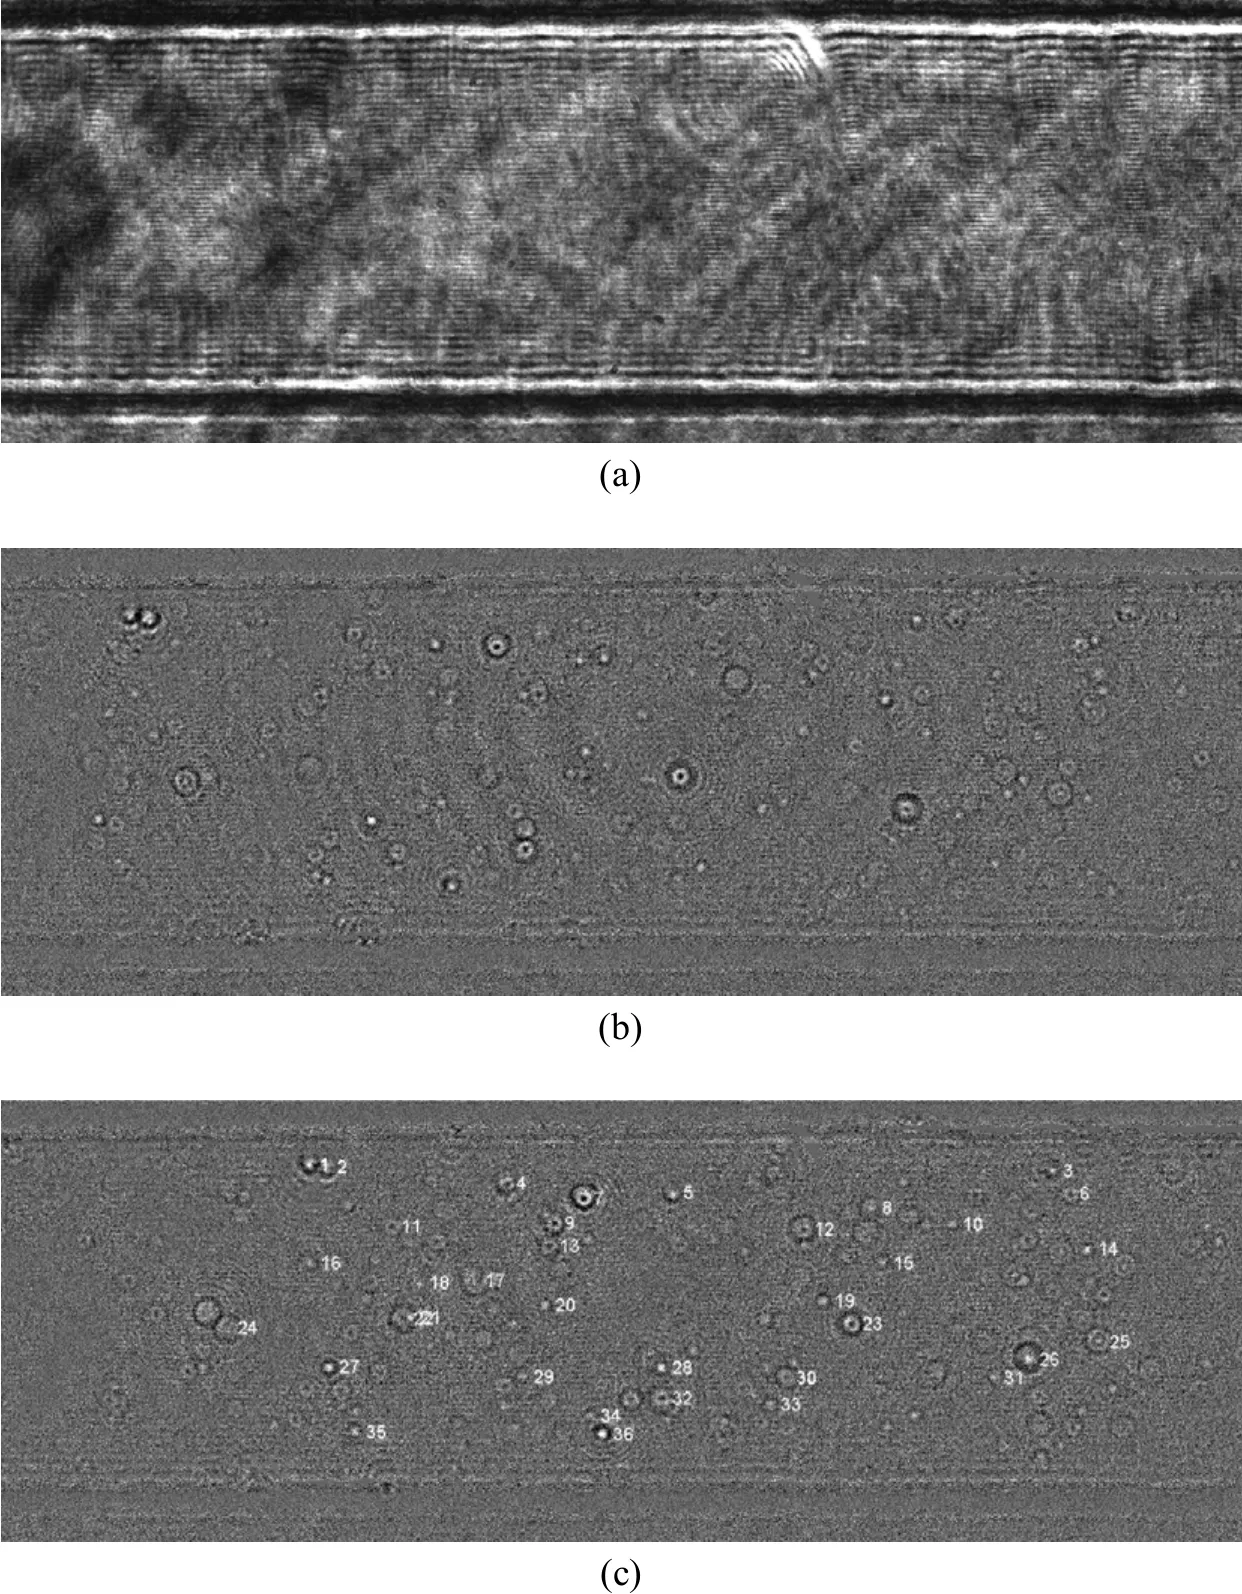
Figure 5 In-line holograms of the micro-channel and particles. A raw hologram shows that the diffraction fringes generated by two side walls of the micro-channel are overwhelming and cover all particles (a). After subtraction of average background hologram, the particles can be identified (b) and tracked (c)
Water seeded with 0.5 μm fluorescent particles of 0.01% volume fraction was driven by a syringe pump and flowed through the micro-channel. Flow-rate was 2.88 nl·s-1and the average velocity in the channel was 0.96 mm·s-1. The in-line holograms of particles and the micro-channel were taken at a frame speed of 25 frames per second and a shutter time of 0.2 ms.
Figure 5 (a) shows a raw in-line hologram of the microchannel with the flow seeded with the fluorescent particles. The diffraction fringes generated by the two side walls of the micro-channel and other background noise dominate and cover the diffraction pattern images of particles. Those unwanted fringes and background noises could be removed easily by the background subtraction method, as shown in Figs. 5(b) and 5 (c). Although the air-borne optical plate might minimize the influence of the environmental vibration and shaking, visible unwanted fringes and noises still exist on the images due to some temporally variable noises.
The particles in the holograms which had been preprocessed by the background subtraction were identified and located using an image processing program. A particle was found by edge detection and,then, its center was determined in the contour of particle diffraction image edge as done for the LIF diffraction patterns before [9]. The LIF diffraction patterns also had the bright centers as shown in Fig. 4. The centers were detected based on their Gaussian intensity profile. Therefore, for the holograms with dark centers, the images were inversed to change the dark centers into the bright ones. However, some particles could not be recognized and located due to heavy optical noise. Those particles were manually located,which was a tedious job. As a result, some particles still remained to be located.
Then each particle hologram was matched to one pattern in the hologram model templates that was obtained from the single particle test discussed above in order to determine its axial position in the z-direction,i.e. the defocus distance Z. Fig. 6 shows the radial intensity profiles of hologram images of some particles in Fig. 5 (c) in comparison with those obtained in the single particle test. The intensity profiles normalized with the maximum grey level were modified by subtracting their averaged values to eliminate the influence of different lighting or image preprocessing [9].Although the holograms from the single particle test were used as the model templates, their intensity profiles had more uncertainties than those in Fig. 5 (c)since the hologram patterns obtained in the single particle test, unlike the flow test, were not acquired from a continues camera shooting, then the optical noise in Figs. 3 and 4 could not completely be removed as discussed before in Section 3.1. In contrast, the holograms in Figs. 5 (b) and 5 (c) had less optical noise and, then,had smoother intensity profiles as shown in Fig. 6.
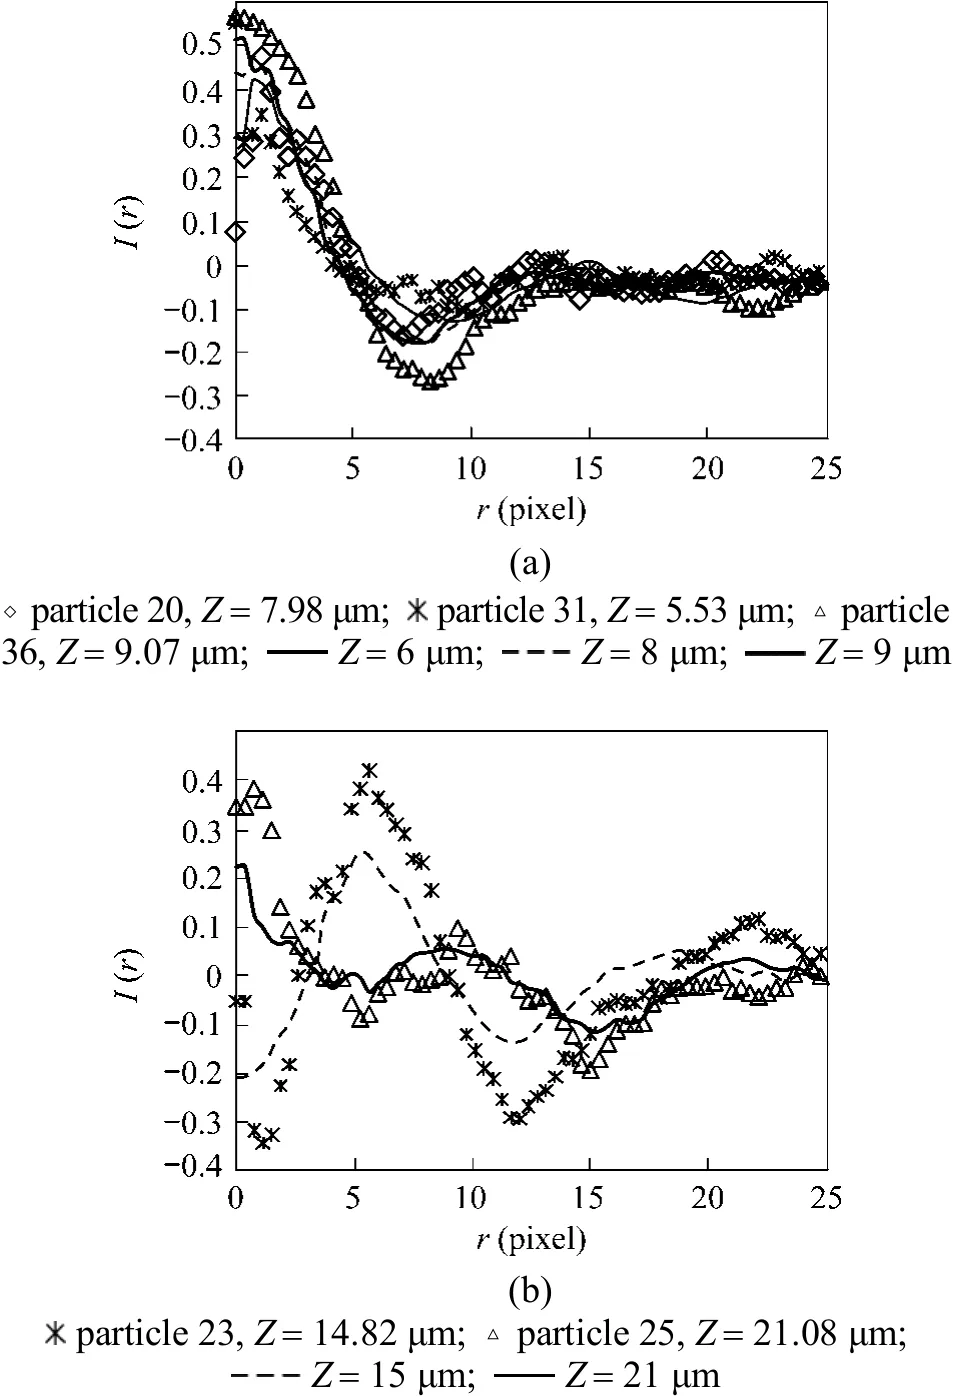
Figure 6 Radial intensity profiles (dots) of some particles in Fig. 5 (c) in comparison with the holograms (lines) of the single particle in Fig. 4 and their defocus distance Z
Some particle holograms in Fig. 5 (c) might not be generated from single particles. For example, the holograms of particles 23 and 36 had larger sizes and stronger interference fringes than those of the single particle. This implies that the holograms might be generated from larger particles or probably pairs of fluorescent particles stuck together. In addition, the calculated hologram patterns, which should be verified by the single particle test, may be suitable for the pattern matching to determine the defocus distances and sizes of particles.
After all particles were located and their defocus distances were determined, the three-dimensional velocity distributions of particles in the microchannel were obtained by a particle tracking velocimetry (PTV)algorithm developed previously [10]. Fig. 7 shows the velocity distribution in the centerline of micro-channel along the axial z direction for the particles within?y 6 μm around the central x-z plane. The experimental results are in comparison with the theoretical prediction, which was obtained by fitting the measured particle velocity to the velocity distribution of the fully developed Poiseuille flow in a rectangular channel [10].The holograms at different axial z positions are given to show the defocus distance and single hologram relationship. In comparison with the LIF method, a much higher velocity flow could be measured by the in-line microscopic holography method since the shutter time was 0.2 ms and the hologram images of the fast moving submicron particles could be clearly recorded.
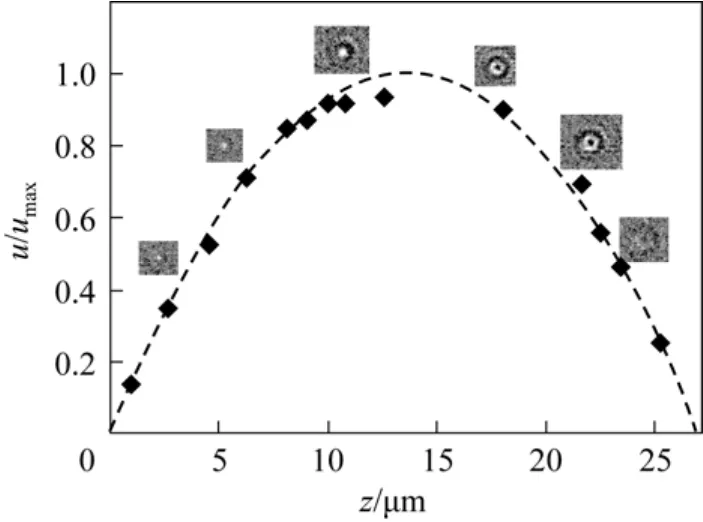
Figure 7 Velocity profile on the centerline of microchannel cross section along the z-directioncal.; ◆ exp.
4 CONCLUSIONS
Digital microscopy in-line holography was used to track submicron particles in flows in a microchannel in three dimensions. Using the laser induced fluorescence technique, a single fixed 0.5 μm fluorescent particle was found and located to provide a calibrating particle for the microscopy holographic measurement. In-line holograms of the fixed particle at different positions on the optical axis, i.e. defocus distances, were obtained as the hologram model templates with the known defocus distances, which were used to match the hologram of each particle in the microchannel flows to one of the model templates and to determine its positions on the optical axis. In this way, the particles in flows in the micro-channel can be tracked in three dimensions without a direct reconstruction of the in-line holograms.
1 Sheng, J., Meng, H., “A genetic algorithm particle pairing technique for 3D velocity field extraction in holographic particle image velocimetry”, Exp. Fluids, 25, 461-473 (1998).
2 Sheng, J., Malkiel, E., Katz, J., “Digital holographic microscope for measuring three-dimensional particle distributions and motions”,Appl. Opt., 45, 3893-3901 (2006).
3 Satake, S., Kunugi, T., Sato, K., Ito, T., Taniguchi, J., “Threedimensional flow tracking in a micro channel with high time resolution using micro digital-holographic particle-tracking velocimetry”,Opt. Rev., 12, 442-444 (2005).
4 Ooms, T.A., Lindken, R., Westerweel, J., “Digital holographic microscopy applied to measurement of a flow in a T-shaped micromixer”, Exp. Fluids, 47, 941-955 (2009).
5 Wu, X.C., Gréhan, G., Meunier-Guttin-Cluzel, S., Chen, L.H., Cen,K.F., “Sizing of particles smaller than 5 μm in digital holographic microscopy”, Opt. Lett., 34 (6), 857-859 (2009).
6 Luo, R., Yang, X.Y., Peng, X.F., Sun, Y.F., “Three-dimensional tracking of fluorescent particles applied to micro-fluidic measurements”, J. Micromech. Microeng., 16 (8), 1689-1699 (2006).
7 Ovryn, B., “Three-dimensional forward scattering particle image velocimetry applied to a microscopic field-of-view”, Exp. Fluids, 29,S175-S184 (2000).
8 Zhang, Z.P., Meng, C.H., “Best linear unbiased axial localization in three-dimensional fluorescent bead tracking with subnanometer resolution using off-focus images”, J. Opt. Soc. Am. A, 26 (6),1484-1493 (2009).
9 Luo, R., Sun, Y.F., “Pattern matching for three-dimensional tracking of sub-micron fluorescent particles”, Measur. Sci. Tech., 22, 0454002(2011).
10 Luo, R., Wang, L., “Liquid velocity distribution in slug flow in a microchannel”, Microfluid. Nanofluid., 12, 581-595 (2012).
2011-12-02, accepted 2012-01-03.
* Supported by the National Natural Science Foundation of China (50736002, 61072005) and Changjiang Scholars and Innovative Team Development Plan (IRT0957).
** To whom correspondence should be addressed. E-mail: liushi_ncepu@yahoo.com.cn
 Chinese Journal of Chemical Engineering2012年2期
- Chinese Journal of Chemical Engineering的其它文章
- Optimization for Production of Intracellular Polysaccharide from Cordyceps ophioglossoides L2 in Submerged Culture and Its Antioxidant Activities in vitro*
- A Pilot-scale Demonstration of Reverse Osmosis Unit for Treatment of Coal-bed Methane Co-produced Water and Its Modeling*
- ECT Image Analysis Methods for Shear Zone Measurements during Silo Discharging Process*
- Temperature-triggered Protein Adsorption and Desorption on Temperature-responsive PNIPAAm-grafted-silica: Molecular Dynamics Simulation and Experimental Validation*
- Adsorptive Thermodynamic Properties and Kinetics of trans-1,2-Cyclohexandiol onto AB-8 Resin
- Oxidation of p/o-Cresols to p/o-Hydroxybenzaldehydes Catalyzed by Metalloporphyrins with Molecular Oxygen*