Research on multi-axial multi-excitations road simulation test method for AMT actuator*
2014-06-09 14:44:40XihongZOUFengXIONGYongYUShuanqiLIUJigangPENG
機(jī)床與液壓 2014年3期
Xi-hong ZOU,F(xiàn)eng XIONG,Yong YU,Shuan-qi LIU,Ji-gang PENG
1Key Laboratory of Manufacture and Test Techniques for Automobile Parts,Ministry of Education,Chongqing U-niversity of Technology,Chongqing 400054,China;2Chongqing Academy of Science and Technology,Chongqing,400054,China;3Chang’an Automobile Group Chongqing Qingshan Transmission branch,Chongqing 400054,China
Research on multi-axial multi-excitations road simulation test method for AMT actuator*
Xi-hong ZOU?1,F(xiàn)eng XIONG1,Yong YU2,Shuan-qi LIU3,Ji-gang PENG1
1Key Laboratory of Manufacture and Test Techniques for Automobile Parts,Ministry of Education,Chongqing U-niversity of Technology,Chongqing 400054,China;2Chongqing Academy of Science and Technology,Chongqing,400054,China;3Chang’an Automobile Group Chongqing Qingshan Transmission branch,Chongqing 400054,China
Vibration fatigue reliability of AMT actuator is one of the most significant performance of AMT.For accurate and efficient analysis and evaluation of AMT actuator vibration fatigue reliability,multi-axial multi-excitations road simulation test method for AMT actuator based on time-frequency domain error-weighted remote parameter square matrix control(RPC)was put forward.AMT actual road load spectra acquisition method was established and AMT actuator actual driving road load spectra were collected in Dongfeng automobile testing field.The collected load spectra were conducted with pretreatment and repeatability inspection and thus expected response signals for indoor road simulation test were obtained.AMT multi-axes road simulation test bench was designed and developed based on the AMT actuator actual road vibration load characteristics.Combined with the collected real road load spectra and developed AMT actuator multi-axes road simulation test bench,load spectrum simulation iteration method based on remote parameter square matrix control with time-frequency domain error weighting coefficients 0.5 respectively succeeded in achieving accurate and efficient reproducing of AMT actuator actual driving road load spectra,therefore muti-axial multi-excitations road simulation test method for AMT actuator was established and thus provided an accurate and efficient new method for vehicle AMT actuator vibration fatigue reliability assessment.
AMT actuator,Multi-axial multi-excitations,Road simulation,Time-frequency domain error weighting
1.Introduction
Vehicle electronic-controlled automatic mechanical transmission(AMT)consists of an original manual transmission(MT)and a new installation of electronic-controlled automatic shifting actuator(actuator for short).Vehicle AMT and its actuator long-termly worked under severe vibration and shock conditions,therefore fatigue reliability of the newly-installed actuator had become one of the most significant properties of AMT transmission.However,fatigue reliability test method for the AMT actuator is very deficient at present,current fatigue reliability tests worldwide mainly use road test and testing ground test,which are time-energy consuming and of poor reproducibility[1-2].Indoor bench tests occasionally use singleaxial single incentive mode,it is also difficult to accurately verify vibration fatigue reliability of the AMT actuator due to its complex load characteristics.
Therefore in this article,AMT and its actuator actual road load spectra acquisition method was established and road load spectra were collected,AMT actuator multi-axes road simulation test bench was developed and combined with the load spectrum simulation iteration method based on time-frequency domain error-weighted remote parameter square matrix control,AMT actuator actual road load spectra were efficiently and accurately indoor reproduced,thus AMT actuator multi-axial multi-excitations road simulation test method was established,therefore provided an efficient and accurate new method for AMT actuator vibration fatigue performance test,experiment and assessment.
2.AM T and its actuator’s road load spectra acquisition and analysis
AMT actuator key components’acceleration time history signals basically reflect the shifting comfort of AMT transmission assembly while strain time history signals of concerned weak areas provide true and reliable data source for vibration fatigue characteristic analysis of transmission assembly.So select acceleration and strain as collecting load signal types.Combining with the AMT force analysis and comprehensive consideration,5 three-dimensional acceleration sensors(No.AC1~AC5)and 6 strain sensors were arranged,the collected acceleration signals could be treated as expected response signals of indoor road simulation test and the collected strain signals as the simulation iteration monitoring signals and reliable input signals for actuator fatigue CAE analysis.Acceleration sensors(Accelemeters)should be installed in the place of larger structure stiffness,vibration sensitive and could reflect AMT vibration condition well,while the strain measuring points should select concerned local weak areas where stress or strain were larger.Therefore,acceleration sensors were installed around the AMT actuator,the transmission assembly suspension and other key positions more sensitive to vibration,strain gauges are mainly distributed around the transmission assembly suspension and the joints between AMT actuator and transmission box in this test in order to achieve a comprehensive collection of AMT actual driving load spectra Figure 1 displays the AMT acceleration measuring points arrangement.
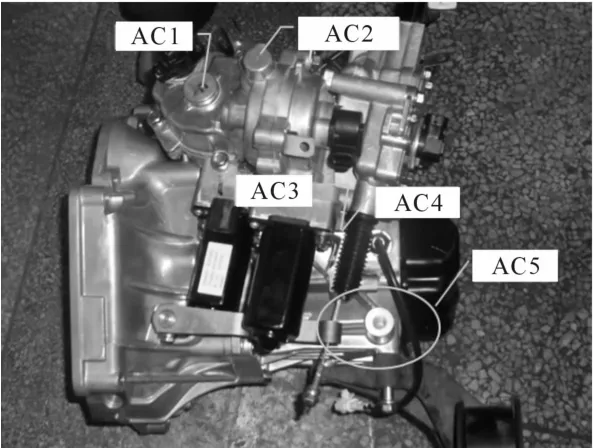
Figure 1.Acceleration measuring points arrangement
Arrange well the strain gauges and acceleration sensors,connect the cable,then calibrate and debug the system to assure normal transmission of signals. Choose high-speed ring road,comprehensive road,work condition road of Dongfeng automobile test field as load spectra acquisition roads and loading mass,tire pressure are in strict accordance with the Road Test Method(GB/T 12534—90),travel speeds on various road are strictly in accordance with the fatigue durability test method of a certain enterprise,use GPS speed meter to monitor real-time vehicle speed,sample 2 cycles each kind of road Figure 2 displays the test system.

Figure 2.Test system
There may exist some non-real signals in original collected response signals such as zero drift,trend term,and high frequency noise,in order to ensure the reliability and authenticity of load spectra,necessary analysis and processing need to be done with the collected signals[3].Filtering,eliminating mean and removing bias are commonly used methods for eliminating spurious signals.Curve 1 in Figure 3 represents the original collected strain time history signal of a strain measuring point,the zero drift is typical,conduct filtering to the original signals with 0~1.5 Hz and 1.5~50 Hz bandwidth respectively,ob-tain the filtered signal curve 2 and curve 3 as shown in Figure 3.It can be found that amplitude of0~1.5 Hz bandwidth filtered signal just approach about 5% that of the original real signal and therefore it belongs to a normal noise signal.However,amplitude and trend of 1.5~50 Hz bandwidth filtered signal almost accord with that of the original signal while the zero drift has been completely eliminated,thus 1.5~50 Hz bandwidth filtering is a reliable process for original signals preprocessing.
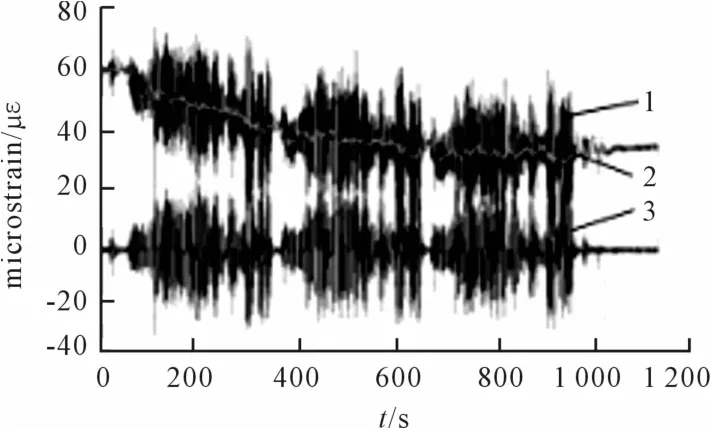
Figure 3.Strain signal comparison before and after process
Do repeatability verification for collected road load spectra data to verify reliability.Firstly,extract the original collected load spectra time history data of each sampling cycles and complete power spectra density analysis.As the article takes the remote parameter matrix controlled(RPC)load spectra simulation iteration method,select3 acceleration measuring points close to the suspension of AMT transmission assembly as shown in Figure4,extract their collected load spectra signals and complete repeatability verification.Due to limited article space,just select perpendicular vibration acceleration signal of measuring point1 under comprehensive road condition as example,complete power spectra density analysis to the two sampling cycles’data and make comparison as shown in Figure 5.It can be seen that in frequency range of 0~100 Hz,PSD curve amplitude and trend of two sampling cycles under the same road condition accord well with each other,therefore the collected road load spectra are of good repeatability and reliability.Select any cycle of the signal and make it as the indoor expected response signal of the corresponded measuring point after pretreatment such as removing the pseudo signal.Figure 6 displays the obtained indoor expected response signals in perpendicular direction long for 50 seconds of the aforementioned selected three measuring points through the method.
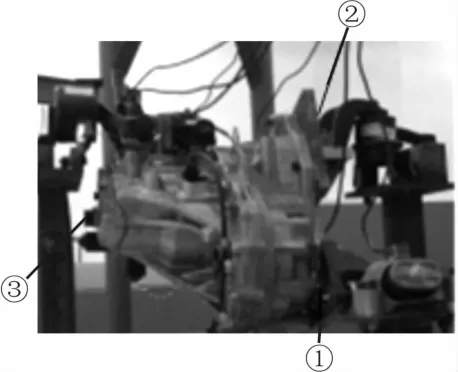
Figure 4.Indoor expected response signal measuring points
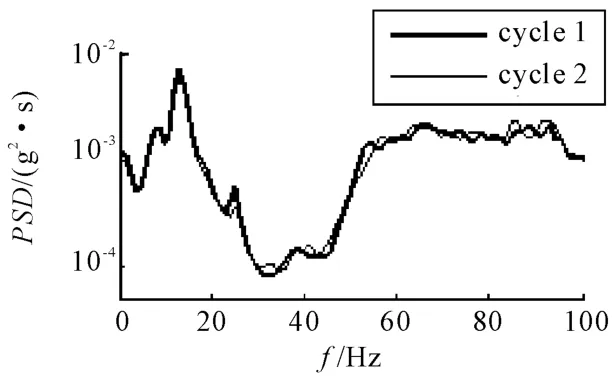
Figure 5.Perpendicular vibration acceleration signal PSD of measuring point 1 under comprehensive road condition
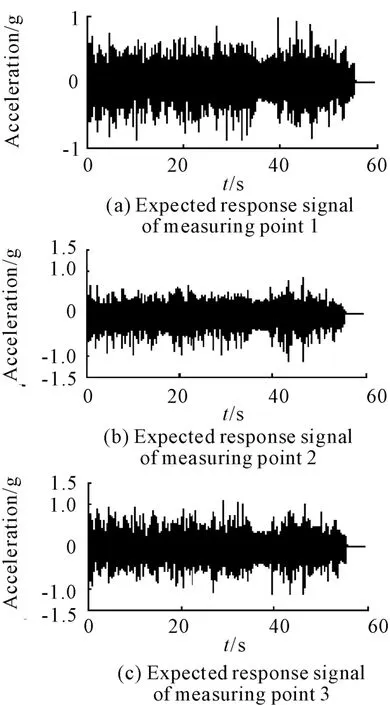
Figure 6.Expected response signal of the selected 3 measuring points
3.AM T actuator multi-axes road simulation test
3.1.Multi-axes road simulation test bench
Indoor road simulation test for vehicles and theirparts proves to be an effective way to speed up product development and improve product quality[4-5]. Figure7 displayed a multi-axes road simulation test bench built with American MTS hydraulic servo actuators.The test bench arranged three axial hydraulic actuators,they cooperated their excitations with each other and can be accurate to simulate the corresponding movement of lifting,pitch and roll of AMT actuator under actual driving road condition.For high precision of reproducing AMT actual road load spectra,the indoor installation of AMT should try to accord with actual vehicle installation mode,by retaining the transmission assembly suspension and design fixtures to install AMT on the simulation test bench.
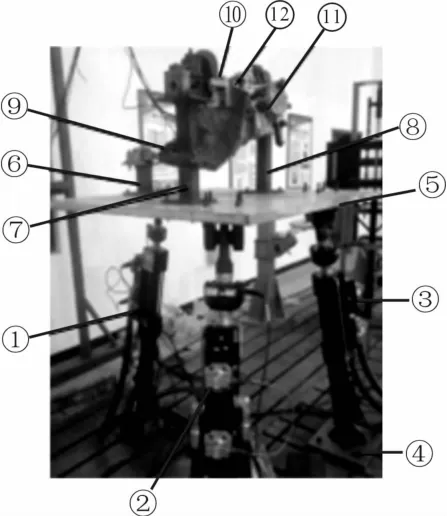
Figure 7.Physical model of multi-axes road simulation test bench
3.2.Load spectrum simulation iteration method based on time-frequency domain errorweighted square matrix control
AMT multi-axes road simulation test system is a multiple input multiple output system,as shown in Figure 8,take remote parameter square matrix control strategy to iterate and reproduce actual driving load spectra.Select three points exactly the same place as that of actual road load spectra acquisition measuring points(Figure 4),arrange acceleration sensors and treat them as expected response signal simulation iteration measuring points,as shown in Figure 7,moreover,take other load spectra acquisition measuring points into consideration,arrange acceleration sensors or strain gauges and treat them as monitoring measuring points.The three measuring points are close to hydraulic actuator of the same number respectively,they correlate well with their input channels and have nice input sensitivity,therefore could decrease the inter-channel coupling influence and increase signal-to-noise ratio.Take remote parameter square matrix controlled load spectrum simulation iteration method with time-frequency domain error weighting coefficients 0.5 respectively to simulate and iterative actual collected load spectra according to the following steps.
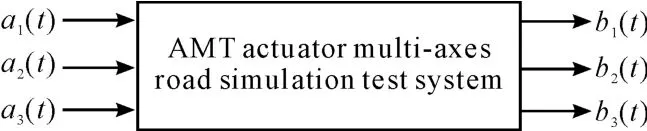
Figure 8.AMT actuatormulti-axes road simulation test system
Firstly,generate digital broadband white noise signals as the hydraulic actuators input drive signals and transform them to A(f)through FFT,collect response signals of measuring point.1,measuring point 2,measuring point 3 and transform them to B(f)through FFT,calculate and achieve the system frequency response function H(f)according to formula(1)[6-7].
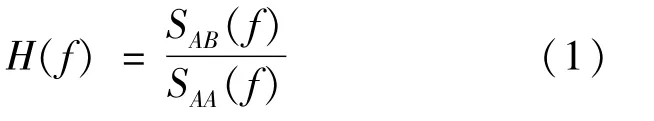
SAB(f)—cross power spectral density of input and output signals
SAA(f)—auto-power spectral density of input signals
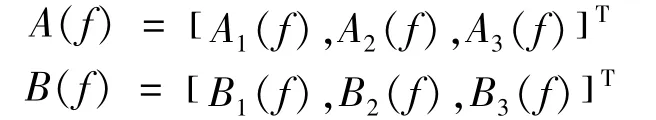
A1(f),A2(f),A3(f),B1(f),B2(f),B3(f)—fourier transform of a1(t),a2(t),a3(t),b1(t),b2(t),b3(t)individually.
FRF1,F(xiàn)RF2,F(xiàn)RF3 in Figure 9 stands for measured frequency response function between measuring point1,measuring point 2,measuring point 3 and their corresponding actuators of the same serial number individually.As the figure shows,in the frequency range of 0~30 Hz,frequency response function curves appears peaks near frequency value of 13 Hz and 17 Hz.
Using the edited expected response signals(Figure 6)and frequency response function inverse matrix H-1(f),we calculate and obtain the initial drivesignals according to formula(2),(3).
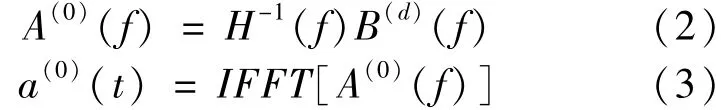
H-1(f)—inverse matrix of H(f)
b(d)(t)—desired response signal
B(d)(f)—Fourier transform of b(d)(t)
a(0)(t)—initial drive signal
A(0)(f)—Fourier transform of a(0)(t)
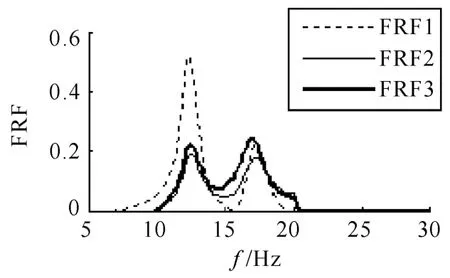
Figure 9.System frequency response function
Using the initial drive signals as input,and collect the output response signal of each channel at the same time,we calculate the time domain error,frequency domain error and average error respectively between the expected response signal and the actual output response signal with formula(4)~(7),calculate error-corresponding input revision signal with formula(8)~(9).
b(0)(t)—output signal with initial drive signal as input
B(0)(f)—Fourier transform of b(0)(t)
e(0)(t)—time domain error response signal
Ef(f)—frequence domain error response signal
ef(t)—inverse Fourier transform of Ef(f)
e(t)—average time-frequence domain error response signal
E(f)—Fourier transform of e(t)
ae(t)—error-corresponding input revision signal
Ae(f)—Fourier transform of ae(t)
Revise the input drive signals with the acquired error-corresponded input revision signals ae(t)according to formula(10),and achieve the revised input drive signals as follows:

δ—attenuation coefficient
a(1)(t)—revised input drive signal
Use the revised input drive signals as new input,constantly repeat the ahead simulation iteration and calculate the average time-frequency domain error enbetween the actual response signal and expected response signal according to formula(11)after each simulation iteration.When en≤10%,record the final input drive signals and establish the drive signal documents.
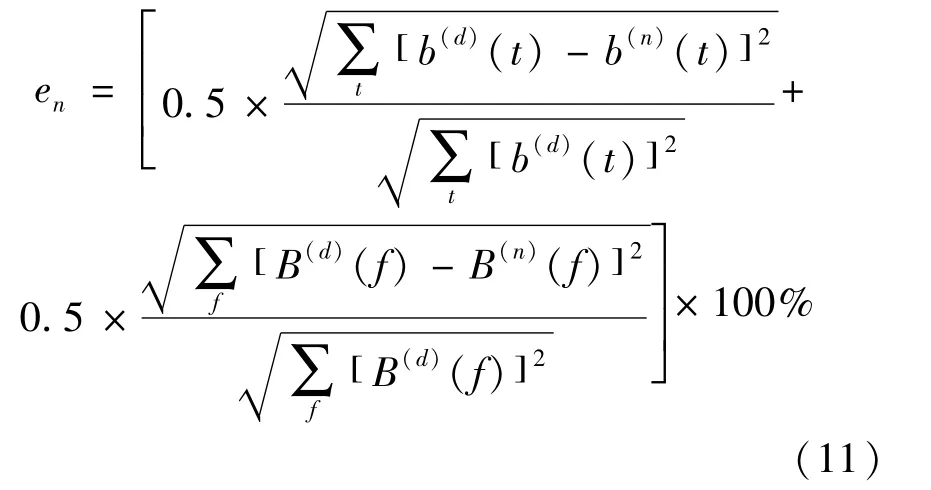
en—The Nth iteration error value
b(n)(t)—The Nth acquired output signal after iteration
b(n)(f)—Fourier transform of b(n)(t)
Conduct simulation iterations according to formula(4)~(11),the AMT actuator actual driving load spectra were accurately and efficiently reproduced after multiple simulation iterations.Figure 10 displays the results comparison between simulation response signal and expected response signal.Due to the application of time-frequency domain error-weighted load spectrum simulation iteration method,the selected three measuring points,whatever in time domain or in frequency domain,simulation response signal basically coincide with that of expected response signal,with result curves close to amplitude and consistent in phase,small amplitude deviation only exist in small local areas,AMT actuator actual driving load spectra are well reproduced.
Detailed observation of power spectral density curves of the three measuring points indicates that simulation-expectation results simultaneously appear peak power spectral density near frequency value of 13 Hz,along with a bit of amplitude deviation in the reasonable error range.The results deviation in some degree was due to frequency response characteristics of test system through frequency response function curve analysis in Figure 9,therefore the frequency response characteristics of the system near frequency value of 13 Hz could be improved through adjusting the suspension parameters,thereby improving the vi-bration status of AMT actuator.
4.AMT actuator multi-axial multi-excitation road simulation test method
Combined with the aforementioned square matrix control RPC iteration technology,collected the actual road load spectra,selected appropriate expected response signal and conducted multiple iterations[8-10].Extract the road simulation excitation spectrum finally for the three hydraulic actuator input channels while achieving high precision retrieval of AMT actuator actual road load spectra.Figure11 displays an intercepted excitation spectrum long for a minute of the 3 hydraulic actuators.
Take the same approach to simulate and iterate collected AMT actuator road load spectra on various road conditions and obtain the individual final road simulation excitation spectrum,integrate them and obtain final road simulation test drive signals.Use the achieved final road simulation test drive signals as input to construct AMT actuator vibration fatigue durability test and take real-time monitoring of all measurements,therefore provides a new idea and method for efficient and accurate fatigue reliability assessment of AMT actuator.
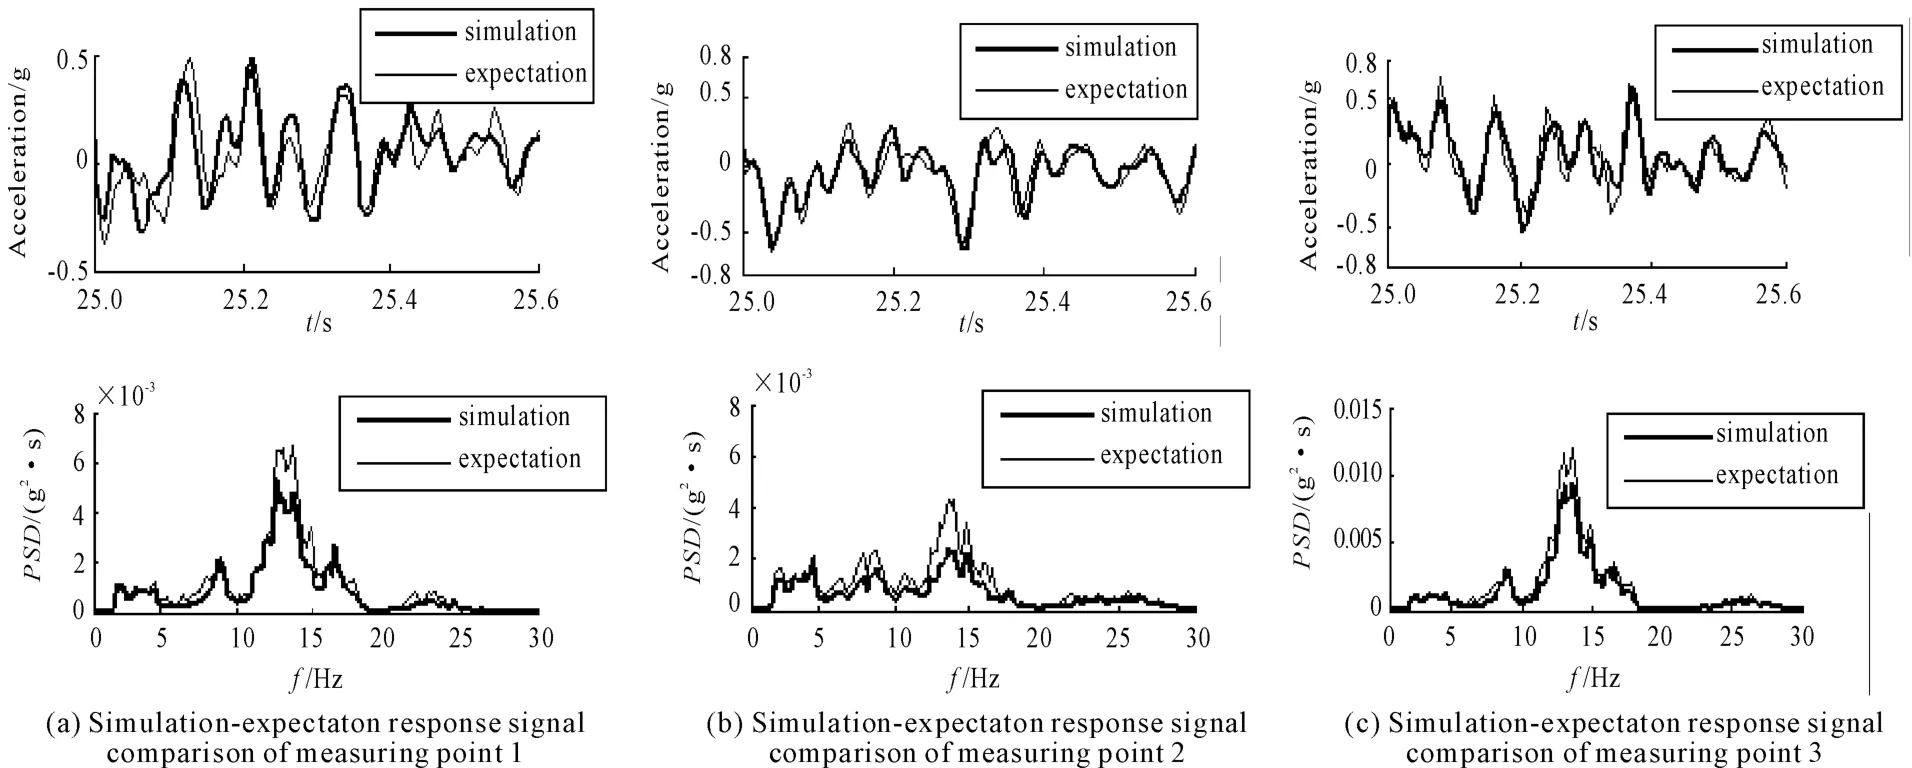
Figure 10.Response signal comparison in time-frequency domain of measuring points
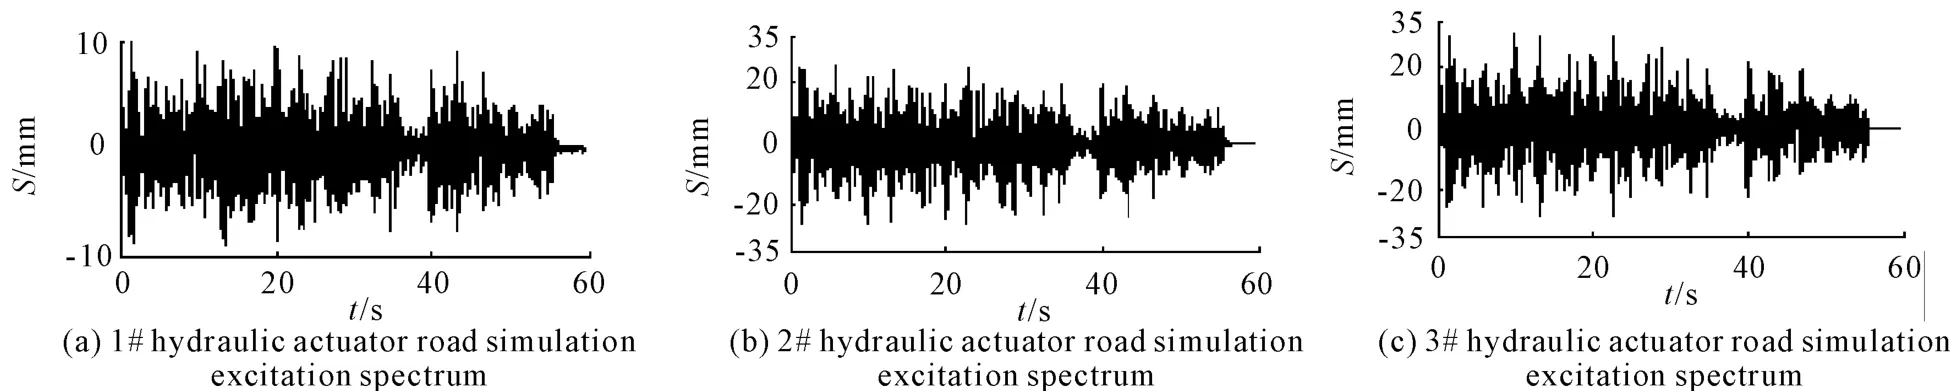
Figure 11.Road simulation test excitation spectrum
5.Conclusion
1)Road load spectra acquisition method is established for AMT and its actuator,and load spectra analysis show that,acquisition method is correct,collected load spectra are reproducible and reliable. They could well reflect the vibration condition of AMT actuator during actual driving.
2)AMT actuator multi-axes road simulation test with time-frequency domain error weighting coefficients 0.5 respectively succeeded in achieving accurate and efficient reproducing of AMT actuator actual driving road load spectra in perpendicular direction,therefore AMT actuator multi-axial multi-excitations road simulation test method can be efficiently and accurately applied to AMT actuator fatigue reliability assessment.
3)Road simulation excitation spectrum were obtained while AMT actuator actual driving road load spectra were accurately reproduced,which provided reliable input and output data for AMT actuator fatigue CAE analysis.
[1] Yang Fan,Meng Fan-xing,Zhan Shao-min.Research about theoretical basis of road simulation for durability of vehicle[J].Science Times,2010(21):124-125.
[2] Yang Xiaohui,Xu Yingqiang,Li Shijie.Dynamic analysis and design on pneumatic drive shift mechanism of AMT system for heavy truck[J].Mechanical Tools&Hydraulics,2010(2),64-66.
[3] Zou Xihong,Qiao Kai,Shi Xiaohui.Road Simulation Test of DCT Key Parts Based on Remote Parameter Control[J].China Mechanical Engineering,2013,24(11):1537-1541.
[4] Shi Feng,Wang Honggang,Liu Zaisheng.Road spectrum rig test[J].Journal of Vibration and Shock,2012,31(19):10-14.
[5] Wang Bin.Research on reproduction methods of road roughness using road simulator[D].Wuhan University of Technology,2010.
[6] PENG Wei,JIN Xiao-xiong,ZHOU You,et al.Study on road simulation of car’s rear axle using force signal as control channel[J].Chinese Journal of Construction Machinery,2004,29(2):239-244.
[7] Li Zhongguo,Zhang Gong,Liu Qinghua,etal.Application of Stationary wavelet transform in vehicle road simulation test[J].Journal of data acquisition&processing 2007(2):238-241.
[8] Koorey G F.Assessment of rural road simulation modeling tools[C]//Proceedings of IPENZ Transportation Group Technical Conference,New Zealand,2002:123 -127.
[9] Bin Wang,Xuexun Guo,Zhan Xu.Research on Road Simulator with Iterative Learning Control[C].SAE Paper 2001-01-2908,2009.
[10]Peijun Xu,DanWong,Pierre LeBlanc,etal.Road Test Simulation Technology in Light Vehicle Development and Durability Evaluation[J].SAE paper,2005-01-0584,2005.
AMT執(zhí)行機(jī)構(gòu)多軸向多激勵道路模擬試驗方法研究*
鄒喜紅?1,熊 鋒1,余 勇2,劉栓起3,彭吉剛1
1.重慶理工大學(xué)汽車零部件制造及檢測技術(shù)教育部重點實驗室,重慶 400054
2.重慶市科學(xué)技術(shù)研究院,重慶 400054
3.中國長安汽車集團(tuán)重慶青山變速器分公司,重慶 400054
AMT執(zhí)行機(jī)構(gòu)的振動疲勞可靠性是AMT最重要的性能之一,為對AMT執(zhí)行機(jī)構(gòu)的振動疲勞可靠性進(jìn)行準(zhǔn)確高效的分析和評價,提出了基于時頻域誤差加權(quán)遠(yuǎn)程參數(shù)方陣控制(RPC)的AMT執(zhí)行機(jī)構(gòu)多軸向多激勵道路模擬試驗方法。針對轎車AMT建立了其道路載荷譜采集方法,在東風(fēng)汽車試驗場采集了AMT及其執(zhí)行機(jī)構(gòu)實際道路行駛振動載荷譜,并對載荷譜進(jìn)行了預(yù)處理和重復(fù)性檢驗,獲取了AMT執(zhí)行機(jī)構(gòu)室內(nèi)道路模擬試驗期望響應(yīng)信號。針對AMT執(zhí)行機(jī)構(gòu)實際道路行駛時的振動受載特征,設(shè)計開發(fā)了AMT執(zhí)行機(jī)構(gòu)多軸道路模擬試驗臺,結(jié)合采集的實際道路行駛載荷譜和開發(fā)的AMT執(zhí)行機(jī)構(gòu)多軸道路模擬試驗臺,采用時域和頻域誤差加權(quán)系數(shù)均為0.5的遠(yuǎn)程參數(shù)方陣控制(RPC)載荷譜模擬迭代方法在室內(nèi)準(zhǔn)確高效地再現(xiàn)了AMT執(zhí)行機(jī)構(gòu)實際行駛載荷譜,從而建立了AMT執(zhí)行機(jī)構(gòu)多軸向多激勵道路模擬試驗方法,為室內(nèi)準(zhǔn)確高效考核轎車AMT執(zhí)行機(jī)構(gòu)振動疲勞可靠性提供了一種行之有效的手段和方法。
AMT執(zhí)行機(jī)構(gòu);多軸向多激勵;道路模擬;時頻域誤差加權(quán)
U467.3
10.3969/j.issn.1001-3881.2014.18.004
2014-04-21
*Project supported by National Natural Science Fund Project(51205432),National Science and Technology Support Plan(2012BAH32F01)and Chongqing Science and Technology Research Projects(cstc2012gg-yyjsB0216)
?Xi-hong ZOU,Professor.E-mail:58594118@qq.com
猜你喜歡
科學(xué)大眾(2023年17期)2023-10-26 07:39:14
環(huán)球人文地理(2022年8期)2022-09-21 03:49:42
天天愛科學(xué)(2020年6期)2020-09-10 07:22:44
意林·全彩Color(2019年11期)2019-12-30 06:08:38
重慶行政(公共人物)(2018年5期)2018-11-06 07:42:18
數(shù)學(xué)物理學(xué)報(2017年6期)2018-01-22 02:26:40
今日重慶(2017年5期)2017-07-05 12:52:25
Coco薇(2016年2期)2016-03-22 02:42:52
Coco薇(2015年1期)2015-08-13 02:47:34
小雪花·成長指南(2015年4期)2015-05-19 14:47:56
- 機(jī)床與液壓的其它文章
- Design and application of attitude measuring device for DC power output filter circuit
- Developing deburring device based on burr formation principles*
- Experimental study on milling tool life for SKD11 steel and optimization of cutting parameters*
- Application research on three-phase inverter with space-vector pulse modulation*
- Glowworm swarm optimization algorithm merging simulated annealing strategy*
- Comprehensive obstacle avoidance system based on the fuzzy control for cleaning robot