Relationship between breakthrough curve and adsorption isotherm of Ca(II)imprinted chitosan microspheres for metaladsorption☆
2016-05-29 03:33:33YangchengLuJingHeLongwenWuGuangshengLuo
Yangcheng Lu *,Jing He Longwen Wu ,Guangsheng Luo
1 State Key Laboratory of Chemical Engineering,Department of Chemical Engineering,Tsinghua University,Beijing 100084,China
2 State Key Laboratory ofNew Ceramics and Fine Processing,School of Materials Science and Engineering,Tsinghua University,Beijing 100084,China
1.Introduction
Heavy metals in waste water impose huge threats to the environment and cause increasing concerns on their treatment.Upon numerous treatment methods ever reported,such as precipitation,ionexchange,adsorption membrane filtration and coagulation–flocculation[1,2],biosorption is a promising alternative due to excellentbiodegradable nature and high efficiency[3–6].Chitosan,fungi,bacteria,and algae are ofcommonly used biomass materials.
Chitosan,produced by alkaline deacelylation of chitin,has abundant amino groups to chelate with metalions[7].Batch studies for heavy metal adsorption using chitosan based materials[8–10]have been widely carried out to obtain equilibrium data and reveal considerable adsorption capacity.The correlation ofequilibrium data with Langmuir or Freundlich isotherms[11]was frequently conducted to help understand the interactions between adsorbates and adsorbents and guide the design ofbatched adsorption process[12].
In industry,adsorption in packed column is preferable for heavy metal treatment as for achieving a continuous operation and high removalrate[13].The dynamic behavior of packed columns is usually described in terms of breakthrough curves,expressed as the ratio of effluent concentration to in fluent concentration versus time or throughput volume of ef fluent.The shape of the breakthrough curve depends on various factors including the individual transport processes of the adsorbent[14],and needs to be estimated to design an efficientcolumn adsorption process.
The complex flow and mass-transfer during the breakthrough process makes it difficult to establish a strict mathematic model for breakthrough curves.Empirical equations,such as the Yoon and Nelson model[15]and the modified dose-response model[16],are widely used in describing column adsorption process.These equations neither come from the batch studies,nor could be extrapolated reasonably.An alternative is to establish breakthrough models derived from simplified mass transfer equations coupled with adsorption isotherms[17],with basic assumptions of fast local equilibrium and uniformly packed uniformed absorbents.Typical models include general rate(GR)modeland its various simplified types such as advection–dispersion–reaction(ADR)equation,lumped pore diffusion(POR)model and transport–dispersive(TD)model,where how to simplify the description of mass transfer process is somehow dependenton the absorbent's morphology and intra-structure.Once mass transfer equations are properly given,corresponding to properly understanding the control step of mass transfer in column,the adsorption isotherms could be calculated from breakthrough curve by the inverse method.However,these models are commonly exploited for the evaluation on chromatography column,and the related report on adsorption column is still uncommon.
Recently,we developed the micro fluidic technique combined with crosslinking solidi fication to prepare metal imprinted chitosan beads with uniform size,porous morphology,as well as fastadsorption kinetics[18].Ca(II)imprinted chitosan(Ca(II)-CS),asan effective and green heavy metalabsorbent,was found to be appropriate for the continuous removal oflead from aqueous solution[19].Considering that the Ca(II)-CS microspheres have comparable uniformity with chromatography packings,we focused on two aspects in this work.The first is proposing suitable assumptions to correlate the breakthrough curves with sorption isotherms for metaladsor ption using Ca(II)-CS micros pheres and judge the decisive in fluence factor in breakthrough performance.The second is carrying out the sensitivity analysis of breakthrough capacity and con firming the feasibility of acquiring adsorption isotherms of Ca(II)-CS from breakthrough curve.Furthermore,a simple way access to column adsorption practice was figured out for packings with uniform morphology and fast adsorption kinetics like Ca(II)-CS microspheres.
2.Methods
2.1.Mathematicalmodel
In the batch study,the swelled adsorbent was usually regarded as a pseudo solid-phase,and the dry basis adsorption capacity was deduced from experimentally determined wet basis adsorption capacity(the solute in the liquid phase immerged into the absorbent being neglected).As for integrating the column study with the batched study,we attempted to establish the modelon the basis of the pseudo solid-phase assumption.
Firstly,throughout the column,we supposed that:1)the temperature variance and the compressibility of liquid were negligible during the adsorption process;2)the axial dispersion coefficientin the external liquid phase kept constant.And then,dividing the packed column into numerous in finitesimalunits along the axial direction,within any unit,we supposed that:1)the external liquid phase and the pseudo solid phase had uniform concentrations,respectively;2)the instantaneous phase equilibrium was kept between the liquid phase and the pseudo solid-phase.
The differentialmass balance of the solute can be written as
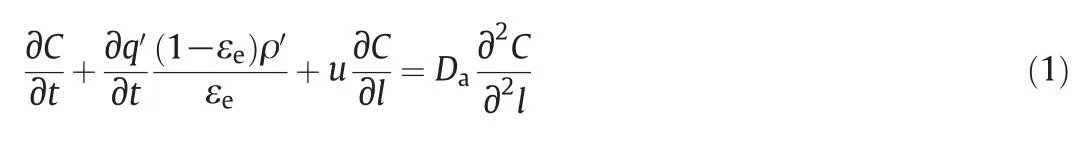
where C is the mass concentration of the liquid phase(mg·ml-1);q′is the mass fraction in the pseudo solid-phase(mg·g-1);ρ′is the density of the pseudo solid-phase(g·cm-3);εeis the external porosity of the packed column;l is the distance along the column;u is the linear velocity.Using water to fully swell the Ca(II)-CS microspheres,ρ′and εefor the application in dilute aqueous solution treatmentcan be simply determined.
The chitosan based materials have been commonly reported to present Langmuir isotherms for metalion adsorption and give
where q is the dry basis adsorption capacity(mg·g-1);Qmand b are the Langmuir parameters;φis the swelling ratio of adsorbent in water(g·g-1).Differentiating Eq.(2)gives
Substituting Eq.(3)into Eq.(1),we have

The initialconditions are

The boundary conditions are
where C0is the in fluent concentration;L is the height ofcolumn.
Eq.(4)could be regarded as equilibrium-dispersive model neglecting the mass transfer resistance in pseudo solid-phase.When the axialdispersion coefficient could be accurately given,the C at any axial position or any time could be calculated directly.Reversely,according to those experimentally determined breakthrough curves,the axialdis persion coefficient could be calibrated by minimizing the error function defined as follows[20]
where N is the total number of time points for sampling in a breakthrough experiment;Ccaland Cexpare the outletconcentration obtained by experiment and calculation,respectively;t is the sampling time.Herein,we carried out the mathematical model calculation and calibration using the finite element method(FEM)via the Galerkin variation.The space coordinate of the partialdifferentialequation was uniformly discretized with an intervalof10-3cm,and the backward differentiation formula method was applied to solve the resulting system with a totalerror tolerance of10-5.
2.2.Experimental
The preparation method of Ca(II)-CS microspheres could be found elsewhere[19].In brief,the aqueous solution containing acetic acid,CaCl2and chitosan was dispersed into smalldro plets by watersaturated octanolin a micro fluidic device;the droplets were solidi fied by glutaraldehyde crosslinking to generate micros pheres;the micros pheres were stripped for Ca2+removalto obtain wet Ca(II)-CS microsp heres.The dry Ca(II)-CS micros pheres were obtained through freeze-drying.The swell ratio was the mass ratio of wet Ca(II)-CS micros pheres to dry Ca(II)-CS micros pheres.The dry Ca(II)-CS microsp heres were 60μm in average diameter(d32)and 141.1 m2·g-1in BET surface area.
The isotherms were determined by the batch experiments.After a contact time long enough,the metalion solution and Ca(II)-CS microspheres were separated,and the isotherms were calculated from the concentration variance in solution.A serials of stainless steel circular columns with an inside diameter of 4.6 mm were used to conduct column adsorption experiments,in which wet Ca(II)-CS micros pheres were packed.A metering pump(Beijing satellite manufacturing factory,China)was used to deliver solution into the column with constant flow rate(2–6 ml·min-1).Table 1 listed some parameters in column adsorption experiments.
Pb(II)and Cu(II)were provided from Lead chloride(PbCl2)and copper nitrate(Cu(NO3)2)in experiments,respectively.Their concentrations were measured by atomic absorption spectrophotometer(Type Z-5000,Hitachi,Japan).All experiments were carried out at room temperature of(20 ± 1)°C.All chemicals were of analyticalgrade and used without further puri fication.Deionized distilled water was used throughout this work.

Table 1 Some parameters in column adsorption experiments
3.Results and Discussion
3.1.Modelcali bration and mass transfer analysis
The axial dispersion coefficient(Da)is the key parameter in equilibrium-dispersive model.It is not practicalto establish a universal calibration for Dawithout the consideration of adsorbents morphology,because Dais dependent on the geometric structure of void outside packed adsorbents in column.However,based on the experiments using specific adsorbents,some empirical models[21–24]have been proposed to calculate the dispersion coefficient.A general type of them is the sum of contributions ofeddy diffusion and molecular diffusion.It could be written as
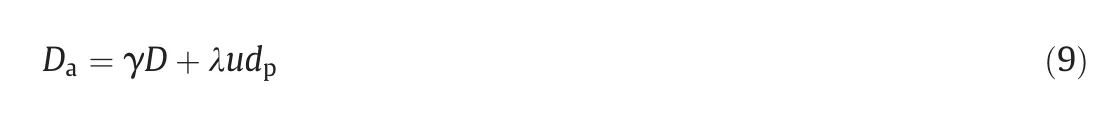
where D is the molecular diffusivity in mobile phase,γis the labyrinth factor,andλis the empirical factor in eddy diffusivity.Bothγandλ are determined by the packing status.The controlled and uniformparticle size may bring repeatable packing status and stable Dacorresponding to specific flow velocity.
In this work,we calibrated Daat various flow velocities according to those breakthrough curves of Pb(II)reported earlier[25].Fig.1 gives comparisons of experimental results and calculation results.In Fig.1(a)and(b),the flow velocity is constant and a unified Dais calibrated.The good agreement in Fig.1(a)re flecting the effect of column depth indicates these Ca(II)-CS micros pheres packed column have no clear variance in the packing status.Moreover,the good agreement in Fig.1(b)re flecting the effect of in fluent concentration indicates the assumptions of instantaneous equilibrium and Langmuir isotherms may be reasonable.For Fig.1(c)including breakthrough curves obtained under various flow velocities,the good agreement is also achieved by considering the variance of Da.The calibration results of Daand their corresponding flow conditions are listed in Table 1,which appears a linearity of Davs.u.It could be inferred from Eq.(9)that Dais almosttotally determined by the eddy diffusion for the Ca(II)-CS micros pheres packed column operated under proper flow velocity(u is 7.7–23.1 mm·s-1in this work).Such a linear correlation makes it possible to predict Dawithin a range of flow velocity from only one determined data.
Allthe calibration results con firm the adaptability of equilibrium dispersion model for the continuous removal of metal ions using Ca(II)-CS micros pheres packed column.It implies the mass transfer resistance within the water swelled Ca(II)-CS micros phere could be neglected and the axialeddy diffusion determines the breakthrough performance in column,as a consequence from the small/uniform particle size and fast adsorption kinetics of the adsorbents.
3.2.The in fluence parameters ofcolumn adsorption performance
On the basis of good predictability of Eq.(4)for the breakthrough performance ofCa(II)-CS micros pheres packed column in metalionsadsor ption,we investigated the effects of some important adsorption parameters involved in Eq.(4)on the position and the shape of breakthrough curves by modelling calculation,which include maximum adsorption capacity(Qm),Langmuir coefficient(b),and dispersion coefficient(D).Fig.2 gives typicalcal culated results.The reference parameters and conditions include:Qm=78.9 mg·g-1,b=0.0197 L·mg-1,Da=2.4 × 10⁻⁶m2·s-1,C0=48.6 mg·L-1,u=7.7 mm·s-1,L=3.1 cm.
3.2.1.Effects of maximum adsorption capacity
The breakthrough curves in Fig.2(a)were calculated under reference parameters and conditions except for Qm.As seen,the breakthrough curve gets smoother and the breakthrough time prolongs with the increase of Qm,which are in accordance with Hatzikioseyian's research[15].
3.2.2.Effects of Langmuir coefficient
The Langmuir coefficient b re flects the ratio of adsorption rate and stripping rate.The breakthrough curves in Fig.2(b)were calculated under reference parameters and conditions except for b.As seen,the shape of the breakthrough curve is not affected much by b,while the breakthrough time prolongs with the increase of b.It can be expounded that increasing b is favorite for guaranteeing adsorption capability at low ef fluent concentration.
3.2.3.Effects of dispersion coefficient
The dispersion coefficientin a continuous flow reactorin fluences the mass trans ferkinetics of the systemby the amount of flow perunittime diverging from plug flow.Fig.2(c)presents the breakthrough curves calculated under reference parameters and conditions except for Da.The results show that the breakthrough curve becomes smooth and the breakthrough point moves forward when Daincreases.It implies that the adsorption performance of the column weakens with Daincreasing.
3.2.4.Sensitivity analysis
The breakthrough capacity(Qb),dependent on how to define the breakthrough point,is an importantindex to evaluate a column adsorption process.Herein,we assigned three different criterions for the breakthrough point,including:1)Ct/C0=0.02;2)Ct/C0=0.50;3)Ct/C0=0.98.And then,we analyzed the sensitivity of Qbon Qm,b,and Dato quantify their effects.The relative sensitivity of each parameter can be expressed in terms of the relative change of research objectversus the relative change of the variable under investigation,defined as
where z is an indepen dentvariable representing the various column parameters,zbis the base point of the variable and znis the new point of the variable.Fig.3 shows the results.As seen,the order of variables from high sensitivity to low sensitivity is maximumadsorption capacity,Langmuir coefficient,and dispersion coefficient.Furthermore,the criterion to determine the breakthrough point,corresponding to the removalobject of heavy metalions,affects the sensitivity of Qbon Damuch,but almost has no in fluence on the sensitivities of Qbon Qmand b.In general,increasing Qmand b should be considered in priority to increase Qb,and decreasing Dabecomes important when the requirement on metalions removal is critical.For Ca(II)-CS microspheres,the former may be achieved by introducing more effective adsorption groups on polymeric skeleton,and the latter may be achieved by decreasing the particle size or the flow velocity.
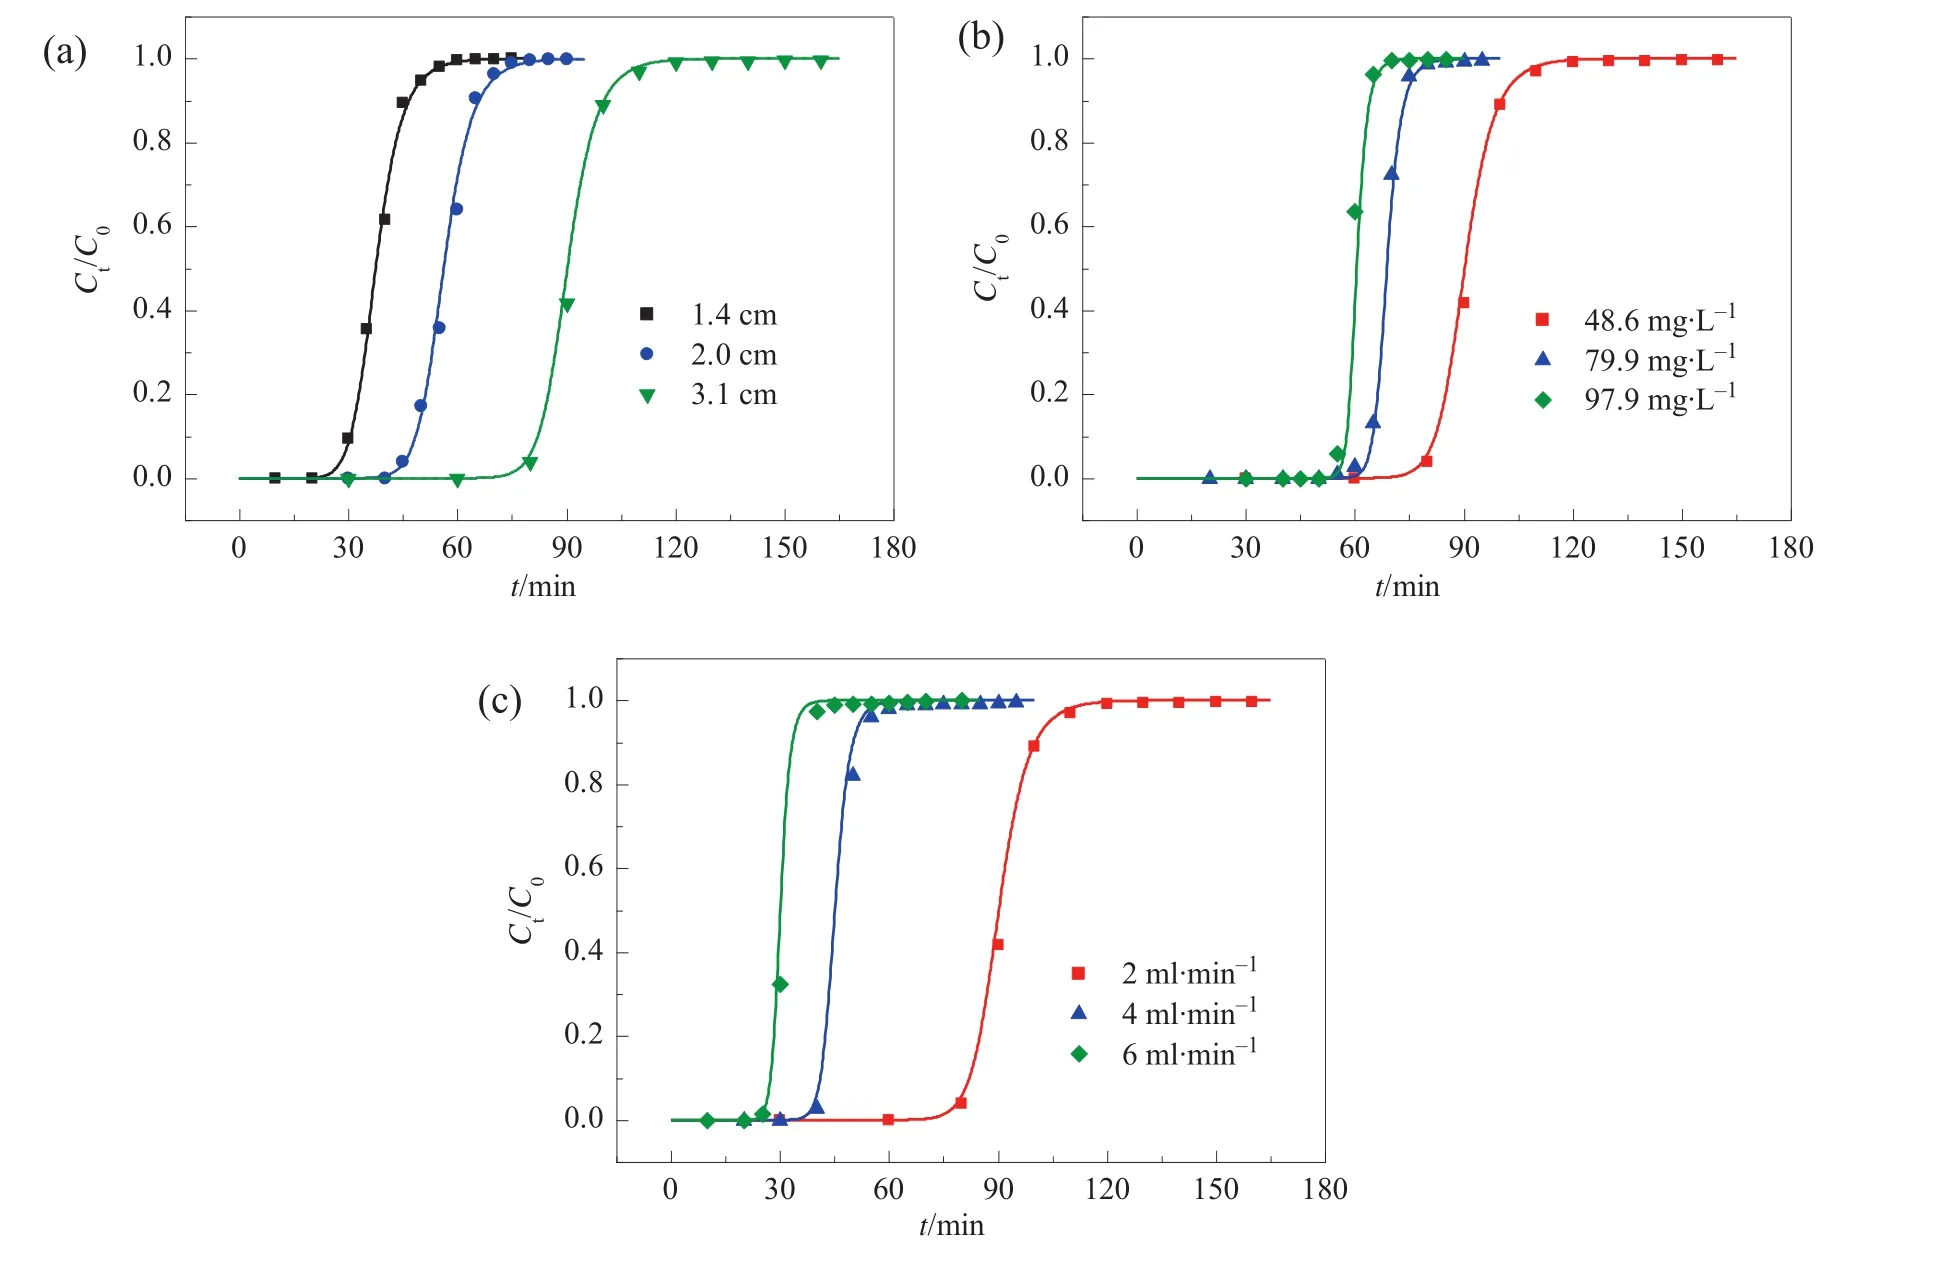
Fig.1.Breakthrough curves ofCa(II)-CS beads packed column for Pb(II)atvarious(a)bed depth,(b)in fluentmetal concentrations,and(c)linear velocity.The dots indicated experimental data reported in Ref.[23],and lines calculated results.The reference conditions include:C0=48.6 mg·L-1;u=7.7 mm·s-1(flow rate,2 ml·min-1);L=3.1 cm.
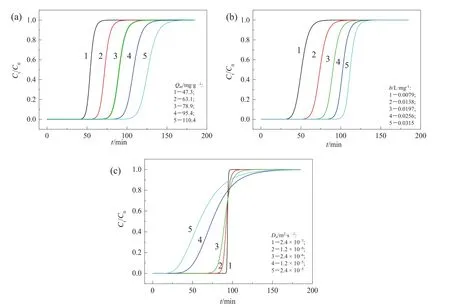
Fig.2.Calculated breakthrough curves of Ca(II)-CS microspheres packed column for Pb(II)at various(a)Q m,(b)b,and(c)D a.The reference parameters and conditions include:Q m=78.9 mg·g-1;b=0.0197 L·mg-1;D a=2.4 × 10⁻⁶ m2·s-1;C0=48.6 mg·L-1;u=7.7 mm·s-1(flow rate,2 ml·min-1);L=3.1 cm.
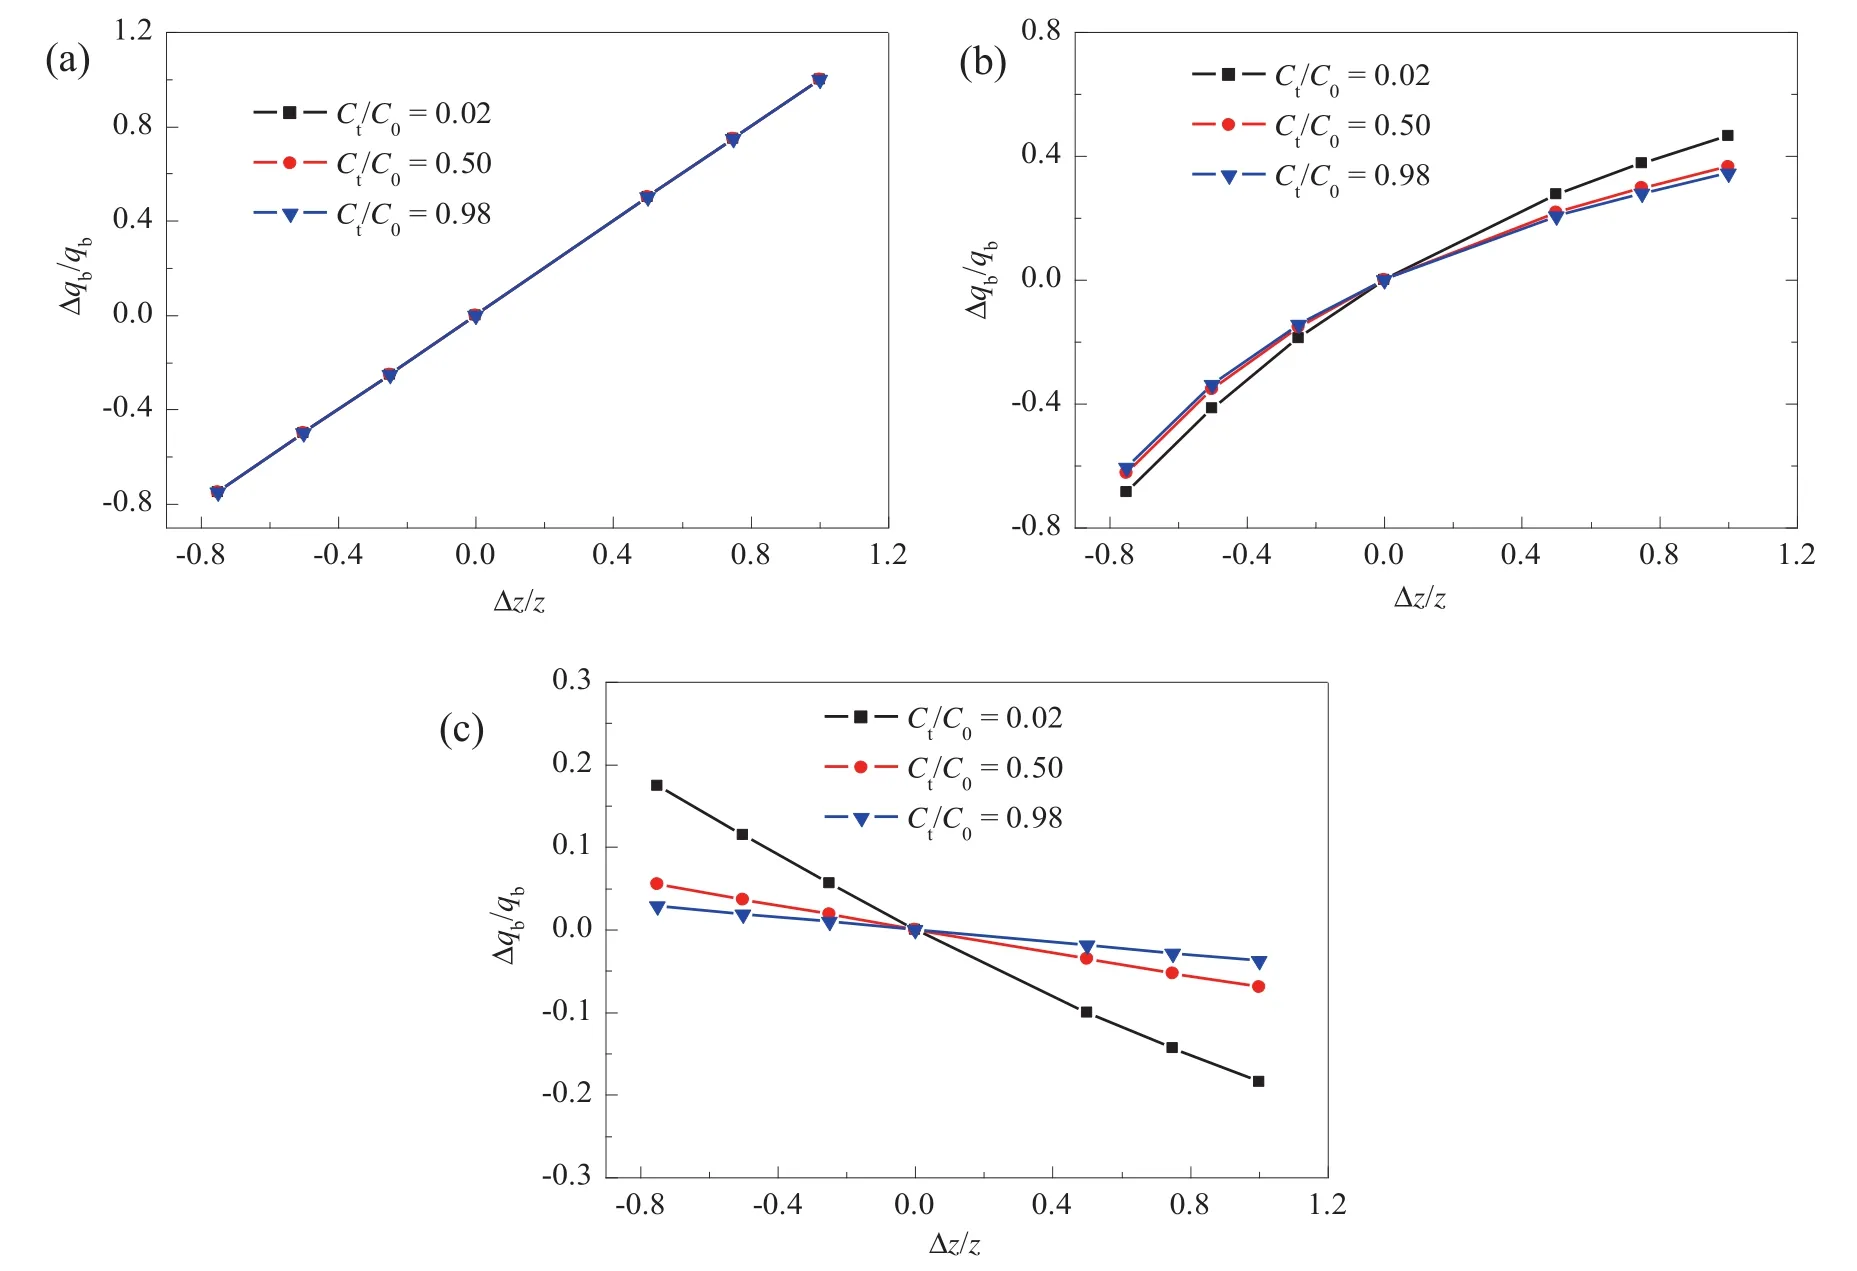
Fig.3.The sensitivity analysis of(a)Q m,(b)b,and(c)D a for effective adsorption capacity under various breakthrough conditions.
3.3.The applications of correlation between breakthrough curve and isotherms
3.3.1.Retrieval of isotherms from breakthrough curve
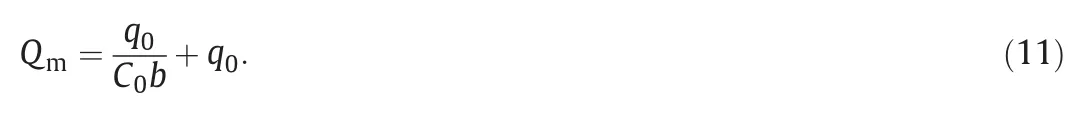
As a linkage between column adsorption and isotherms,Eq.(4)provides feasibility for retrieving isotherms from breakthrough curve.It is well known that Langmuir isotherms have two parameters,Qmand b.In a breakthrough experiment,the limitation of the ef fluent concentration is the in fluent concentration,corresponding to achieving the adsorption capacity in equilibrium with the in fluent concentration(q0)throughout the column.Since the adsorption capacity could be obtained from the breakthrough curve,according to Langmuir isotherms,Qmcould be expressed with b as following
Furthermore,when using Ca(II)-CS micros pheres packed column for continuous metal ions removal from dilute aqueous solution,some parameters involved in Eq.(4)are independent on the ion species,including ρ′,φ,εe,u and Da.As mentioned above,ρ′,φ and εecould be determined by simple measurement methods for weight and volume;the relationship between Daand u could be established by calibration on the breakthrough curve of reference ion specie(whose isotherms are determined in advance,such as Pb(II)in this work).Thus,if the metalion species in the in fluent is changed,the shift of breakthrough curve will only come from the changing of Qmand b.Combining with Eq.(11),b is unique independent variable determining the pro file of breakthrough curve.It could be calibrated from breakthrough curve by minimizing the error function[Eq.(9)]as well.
A breakthrough curve for Cu(II)was experimentally determined to test the feasibility of adsorption isotherms retrieval.Fig.4(a)shows experimentalresults and calculation results.Fig.4(b)shows the dependence of calculation error with b.The minimal error corresponds to b=0.0715 mg·L-1.The Qmderived from Eq.(11)is 46.64 mg·g-1.Compared with our previous batch studies[17],the relative errors of b and Qmare+0.14%and-14.8%,respectively,which are acceptable for engineering applications.Similarly,the adsorption isotherms for other heavy metal ion may also be obtained by only one additional breakthrough experiment.It is a convenient and time-saving process for adsorption isotherms estimation.
3.3.2.A simple way to column adsorption practice
The elucidation on the correlation between adsorption isotherms and breakthrough performance can help to simplify the column adsorption design starting from batch studies.Fig.5 gives a schematic strategy.The step 1:select a reference species to acquire a set of adsorption isotherms,and then obtain a linear equation describing the relationship between dispersion coefficient and linear velocity in column after conducting single breakthrough testfor reference species.The step 2:introduce the species to be separated to carry out single breakthrough experiment for acquiring new adsorption isotherms equation.The step 3:fulfill the column prediction and design by combining what obtained in steps 1 and 2.This strategy could be potentially exploited in the metalions adsorption design using columns packed with Ca(II)-CS micros pheres or any other absorbents with small/uniform size and fast adsorption kinetics.Its advantages are obvious in cutting down the gap between lab and industry.
4.Conclusions
In this work,we investigated the relationship between breakthrough curve and adsorption isotherm of Ca(II)-CS micros pheres for metal adsorption,and following conclusions were summarized:
(1)An equilibrium-dispersion model was successfully established to describe the breakthrough performance,and the assumptions of Langmuir isotherms and axial dispersion controlled mass transfer process were con firmed.
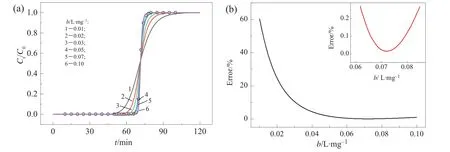
Fig.4.(a)Breakthrough curves ofCa(II)-CS beads packed column for Cu(II)and(b)calibration error dependence on b.The conditions include:in fluentmetal concentration,51.6 mg·L-1;flow rate,2 ml·min-1;bed depth,3.1 cm.
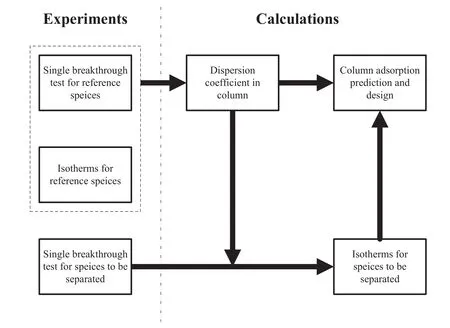
Fig.5.A simple strategy for iso the rmals determination and column adsorption design.
(2)The axial dispersion coefficientin Ca(II)-CS micros pheres packed column was almost proportional to the linear velocity,so its prediction may be easily achieved through single breakthrough test.
(3)The axial dispersion coefficientas well as is sensitive variable for deep removal requirement.Feasible enhancement methods for column adsorption include introducing more effective adsorption groups and decreasing the particle size or the flow velocity.
(4)The retrieval of the adsorption isotherms of Ca(II)-CS micros pheres from breakthrough curve was available by modelling calibration as the axial dispersion coefficient could be obtained separately.
(5)The elucidation on the correlation between adsorption isotherms and breakthrough performance can help to simplify the column adsorption design strategy starting from batch studies.
The model and methodology proposed in this work could be potentially exploited in the metal ions adsorption design using absorbents with small/uniform size and fast adsorption kinetics like Ca(II)-CS micros pheres to cut down the gap between lab and industry.
[1]F.Fu,Q.Wang,Removal of heavy metal ions from waste waters:A review,J.Environ.Manage.92(2011)407–418.
[2]J.X.Zeng,X.H.Sun,L.F.Zheng,Q.C.He,S.Li,Recovery of tungsten(VI)from aqueous solutions by compl exation–ultra filtration process with the help of pol yquaternium,Chin.J.Chem.Eng.20(2012)831–836.
[3]S.E.Bailey,T.J.Olin,R.M.Bricka,D.D.Adrian,A review of potentially low-cost sorbents for heavy metals,Water Res.33(1999)2469–2479.
[4]F.Veglio,F.Beolchini,Removal of metals by biosorption:A review,Hydrometallurgy 44(1997)301–316.
[5]W.S.V.Ngah,M.A.K.M.Hana fiah,Removal of heavy metal ions from wastewater by chemically modified plant wastes as adsorbents:A review,Bioresour.Technol.99(2008)3935–3948.
[6]M.N.V.R.Kumar,A review of chitin and chitosan applications,React.Funct.Polym.46(2000)1–27.
[7]J.Li,E.Z.Chen,H.J.Su,T.W.Tan,Biosorption ofPb2+with modified soybean hulls as absorbent,Chin.J.Chem.Eng.19(2011)334–339.
[8]K.J.Hsien,C.M.Futalan,W.C.Tsai,C.C.Kan,C.S.Kung,Y.H.Shen,M.W.Wan,Adsorption characteristics of copper(II)onto non-crossl inked and cross-linked chitosan immobilized on sand,Desalin.Water Treat.51(2013)5574–5582.
[9]T.Y.Hsien,G.L.Rorrer,Heterogeneous cross-linking of chitosan gelbeads:Kinetics,modeling,and in fluence on cadmium ion adsorption capacity,Ind.Eng.Chem.Res.36(1997)3631–3638.
[10]L.Jin,R.Bai,Mechanisms of lead adsorption on chitosan/PVA hydrogel beads,Langmuir 18(2002)9765–9770.
[11]P.W.Atkins,Physical chemistry,Oxford University Press,1978.
[12]Y.Wong,Y.Szeto,W.Cheung,G.McKay,Equilibrium studies for acid dye adsorption onto chitosan,Langmuir 19(2003)7888–7894.
[13]Z.Aksu,F.G?nen,Biosorption of phenol by immobilized activated sludge in a continuous packed bed:Prediction of breakthrough curves,Process Biochem.39(2004)599–613.
[14]M.J.Ahmed,A.H.A.K.Mohammed,A.A.H.Kadhum,Prediction of breakthrough curves for light hydrocarbons adsorption on 4A molecular sieve zeolite,Korean J.Chem.Eng.27(2010)752–758.
[15]D.Park,Y.S.Yun,J.M.Park,The past,present,and future trends of biosorption,Biotechnol.Bioprocess Eng.15(2010)86–102.
[16]G.Yan,T.Viraraghavan,Heavy metal removal in a biosorption column by immobilized M.rouxii biomass,Bioresour.Technol.78(2001)243–249.
[17]A.Hatzikioseyian,M.Tsezos,F.Mavituna,Application of simplified rapid equilibrium models in simulating experimental breakthrough curves from fixed bed biosorption reactors,Hydrometallurgy 59(2001)395–406.
[18]Y.C.Lu,J.He,G.S.Luo,An improved synthesis of chitosan bead for Pb(II)adsorption,Chem.Eng.J.244(2014)202–208.
[19]J.He,Y.C.Lu,G.S.Luo,Ca(II)imprinted chitosan microspheres:An effective and green adsorbent for the removal of Cu(II),Cd(II)and Pb(II)from aqueous solutions,Chem.Eng.J.226(2013)271–278.
[20]J.Zhou,J.Wu,Y.Liu,F.Zou,J.Wu,K.Li,Y.Chen,J.Xie,H.Ying,Modeling of breakthrough curves of single and quaternary mixtures ofethanol,glucose,glycerol and acetic acid adsorption onto a microporous hyper-cross-linked resin,Bioresour.Technol.143(2013)360–368.
[21]S.Chung,C.Wen,Longitudinal dispersion of liquid flowing through fixed and fluidized beds,AICHE J.14(1968)857–866.
[22]G.F.Froment,K.B.Bischoff,J.De Wilde,Chemicalreactor analysis and design,Wiley,New York,1990.
[23]M.Suzuki,J.Smith,Axial dispersion in beds of small particles,Chem.Eng.J.3(1972)256–264.
[24]C.Wilke,P.Chang,Correlation of diffusion coefficients in dilute solutions,AICHE J.1(1955)264–270.
[25]J.He,Y.C.Lu,L.W.Wu,G.S.Luo,Continuous removal of lead from aqueous solutions by Ca(II)imprinted chitosan micros pheres packed column,Sep.Sci.Technol.50(2015)1127–1134.
 Chinese Journal of Chemical Engineering2016年2期
- Chinese Journal of Chemical Engineering的其它文章
- Experimental study on the effects of big particles physical characteristics on the hydraulic transport inside a horizontal pipe
- Investigation of extraction fraction in con fined impinging jet reactors for tri-butyl-phosphate extracting butyric acid process☆
- Experimental evaluation and modeling of liquid jet penetration to estimate droplet size in a three-phase riser reactor
- Photorheologically reversible micelle composed ofpolymerizable cationic surfactant and 4-phenylazo benzoic acid☆
- Review on current advances,future challenges and consideration issues for post-combustion CO2 capture using amine-based absorbents☆
- Analysis of drop deformation dynamics in turbulent flow