利用腫瘤全域表觀擴散系數信號強度直方圖鑒別Ⅱ級與Ⅲ級膠質瘤
2017-09-29 06:15:16劉楊穎秋尚勁田詩云宋清偉黃寧郭妍苗延巍
磁共振成像 2017年4期
關鍵詞:研究
劉楊穎秋,尚勁,田詩云,宋清偉,黃寧,郭妍,苗延巍*
利用腫瘤全域表觀擴散系數信號強度直方圖鑒別Ⅱ級與Ⅲ級膠質瘤
劉楊穎秋1,尚勁1,田詩云1,宋清偉1,黃寧2,郭妍2,苗延巍1*
作者單位:
1.大連醫科大學附屬第一醫院放射科,大連 116000
2.通用電氣藥業,沈陽 110000
目的評估基于腫瘤全域的表觀擴散系數(apparent diffusion coefficient,ADC) 信號強度直方圖對于鑒別世界衛生組織(World Health Organization,WHO)Ⅱ級與Ⅲ級膠質瘤的價值,并探求二者之間鑒別診斷的影像標志物。材料與方法回顧性分析經手術及病理證實的13例Ⅱ級膠質瘤與20例Ⅲ級膠質瘤的術前磁共振成像(magnetic resonance imaging,MRI)資料,在包含腫瘤實質或瘤周水腫的每一層ADC信號強度圖上勾畫感興趣區(region of interest,ROI),得到3D ROI的ADC信號強度直方圖信息及其所有參數,包括最小值、最大值、平均值、第10百分位數、第25百分位數、第50百分位數、第75百分位數、第90百分位數、值域、體素數、標準差、方差、平均差、偏度、峰度及一致性,進行組間比較,并利用受試者操作特性曲線(receiver operating characteristic,ROC)來確定直方圖參數對于二者的診斷能力。結果最小值(P=0.04)、第10百分位數(P=0.03)、體素數(P=0.003)、標準差(P=0.022)、偏度(P=0.017)在Ⅱ級與Ⅲ級膠質瘤間差異具有統計學意義。利用ROC曲線分析結果,以體素數5.65×10⁶為閾值鑒別Ⅱ級與Ⅲ級膠質瘤的曲線下面積(area under the curve,AUC)最大,診斷能力最佳(AUC=0.856),敏感性及特異性分別為81.5%、80.0%,而偏度、標準差的診斷能力次之(AUC=0.75、0.738)。結論基于腫瘤全域感興趣區的ADC信號強度直方圖可以為Ⅱ級與Ⅲ級膠質瘤的鑒別診斷提供更多信息,體素數、偏度以及標準差具有良好的診斷價值。
神經膠質瘤;磁共振成像;直方圖分析;表觀擴散系數;腫瘤分級
膠質瘤占原發性腦惡性腫瘤的80%,與其他類型腦腫瘤相比,膠質瘤對于生存時間的威脅更大[1]。膠質瘤在宏觀或微觀水平上體現異質性[2],即腫瘤細胞具有不同的分子生物學特性,表現為同一腫瘤在不同部位分化程度不全相同[3]。磁共振成像(magnetic resonance imaging,MRI)是術前診斷、制定治療計劃、療效評估及隨訪中的重要檢查方法,尤其是擴散加權成像(diffusion weighted imaging,DWI)的廣泛應用,可以無創地為膠質瘤的診斷分級提供一些信息[4]。
腫瘤表觀彌散系數(apparent diffusion coefficients,ADC)可用于反映腫瘤異質性的程度[5]、侵襲性程度[6]以及治療效果。但以往的ADC研究中存在一個共同的局限性[7-11],即感興趣區(region of interest,ROI)取在一層或幾層圖像上的腫瘤實質部分,然后計算平均值的方法,但這樣得到的ADC值只是腫瘤局部ADC值的簡單平均,不能反映所取ROI區域腫瘤細胞的異質性,且局部腫瘤實質不能反映腫瘤整體的異質性[7],而是會低估膠質瘤的異質性[12]。基于腫瘤全域的ADC值可能會更加準確和可靠地反映腫瘤的異質性,而且也將會被最大程度地避免局部區域勾畫ROI帶來的抽樣誤差。
直方圖分析是一種新的基于像素分布的圖像分析方法,它可以提供更多定量信息,直方圖分析可以獲得多個直方圖參數,這些參數可以體現腫瘤的彌散特性,從多方面反映腫瘤的異質性[13]。直方圖分析已在頭頸部鱗癌、子宮內膜癌、直腸癌等腫瘤分級或評估預后的研究中展現它的優越性[14-18],也有學者將ADC值直方圖分析用于膠質瘤分級的研究[8-11,19]。然而,大部分研究都只關注了低級別和高級別膠質瘤的鑒別診斷,只有少數學者關注了Ⅱ級與Ⅲ級膠質瘤ADC值直方圖的鑒別診斷[20],但沒有進行深入的探討。
本研究旨在研究基于腫瘤全域的ADC信號強度直方圖對于鑒別世界衛生組織(World Health Organization,WHO)Ⅱ級與Ⅲ級膠質瘤的價值,并探求二者之間鑒別診斷的影像標志物。
1 材料與方法
1.1 病例選擇
筆者從本院醫學影像信息系統(picture archiving and communication systems, PACS)上選擇了2012年1月至2016年1月在醫院進行MRI掃描的膠質瘤患者75例。入組標準:(1)術后組織學診斷依據WHO標準[21];(2)使用GE Signa HDxt 3.0 T進行擴散加權成像(diffusion weighted imaging,DWI)掃描。經以下排除標準,有42例患者被排除:(1)組織學診斷為Ⅰ級或Ⅳ級(n=27);(2)腫瘤內含有明確鈣化成分:按照貝克爾標準,在CT圖像上CT值高于90Hu即可認為是鈣化[22](n=3);(3)DWI圖像部分丟失或圖像質量欠佳(n=4);(4)MRI掃描前已進行治療(n=8)。
最終,共33例患者入組,Ⅱ級膠質瘤患者13例(39.4%),包括星形細胞瘤(n=6),少突膠質細胞瘤(n=3),少突星形細胞瘤(n=4);Ⅲ級膠質瘤患者20例(60.6%),包括間變型星形細胞瘤(n=12),間變型少突膠質細胞瘤(n=4),間變型少突星形細胞瘤(n=4)。患者的臨床資料見表1。
1.2 數據采集
本研究采用美國GE Signa HDxt 3.0 T MRI掃描儀,患者仰臥位,采用8通道頭線圈。掃描序列如下:自旋回波序列軸位T1WI (TR/TE=400 ms/9.0 ms,FOV 220 mm×220 mm,矩陣 448×256,層厚6 mm)、快速自旋回波序列軸位T2WI (TR/TE=4000 ms/110 ms,FOV 220 mm×220 mm,矩陣 448×256,層厚6 mm),平面回波DWI掃描(TR/TE=7000 ms/80 ms,b=0、1000 s/mm2;FOV 220 mm×220 mm;矩陣 160×160;層厚6 mm),使用GE ADW 4.6工作站Functool 2軟件利用DWI圖像重建出ADC圖。
1.3 圖像處理
將ADC圖的DICOM格式數據拷貝至個人電腦,導入Omni-Kinetics軟件得到ADC信號強度圖進行后處理。參照同層面橫軸位T2WI圖像,在每層圖像上沿腫瘤及瘤周水腫帶的邊緣手動描繪ROI,將所有層面的ROI累加為一個3D ROI,軟件將自動計算出ADC信號強度直方圖。直方圖的x軸為ADC信號強度,軟件默認分組單位(bin size)為70,y軸為x軸上ADC信號強度對應的出現頻數。
記錄腫瘤全域的直方圖參數,包括最小值、最大值、平均值、第10百分位數、第25百分位數、第50百分位數、第75百分位數、第90百分位數;值域,即最大值與最小值的差;體素數,腫瘤全域包含的體素數總和;標準差、方差、平均差,均用于度量數據變化或離散程度;偏度,是描述數據曲線分布對稱性的參數;峰度,描述數據分布曲線陡緩程度的參數;一致性,描述腫瘤內ADC信號值分布均勻性參數。
1.4 統計學處理
應用社會科學統計軟件包SPSS 18.0版進行數據分析,計量資料符合正態分布者以“均數±標準差”表示,采用獨立樣本t檢驗;不符合正態分布者以“中位值±四分位間距”表示,采用Mann-Whitney U檢驗。利用受試者操作特性曲線(receiver operating characteristic,ROC)來確定各直方圖參數對于鑒別診斷Ⅱ級與Ⅲ級膠質瘤的效能。所有統計學分析均以P<0.05為差異有統計學意義。
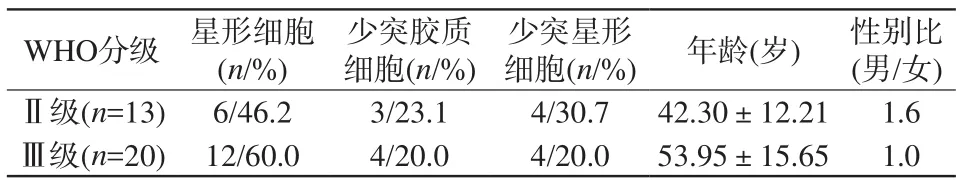
表1 兩組患者臨床資料及病理診斷Tab.1 Clinical data and tumor diagnosis of two patients
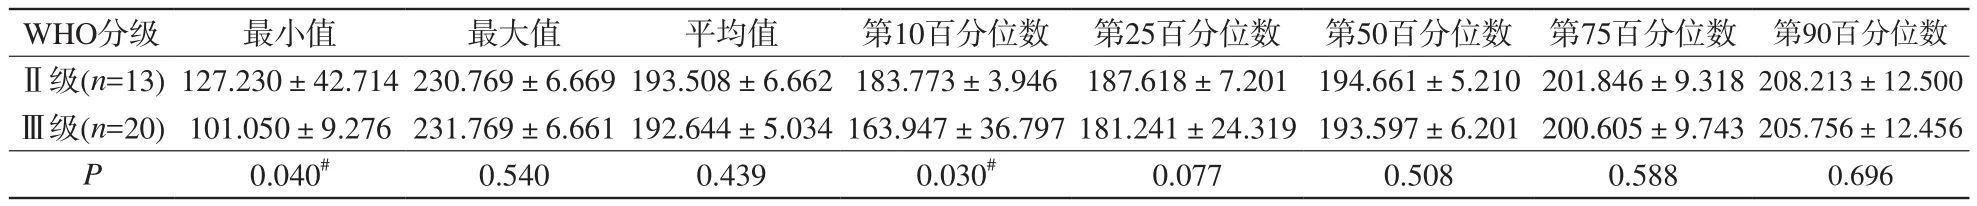
表2 WHO Ⅱ級及Ⅲ級膠質瘤ADC信號強度直方圖參數Tab.2 Histogram parameters of ADC signal intensity between WHO grade Ⅱ and Ⅲ glioma
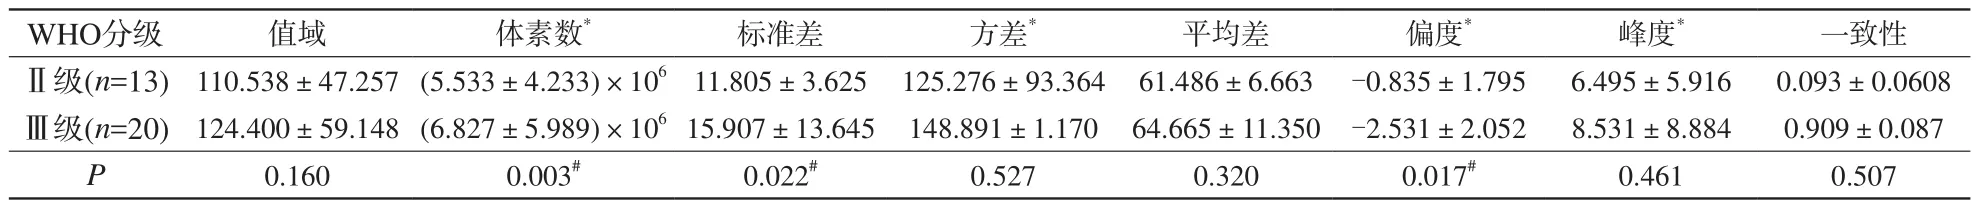
續表2 WHO Ⅱ級及Ⅲ級膠質瘤ADC信號強度直方圖參數Continued tab.2 Histogram parameters of ADC signal intensity between WHO grade Ⅱ and Ⅲ glioma
2 結果
Ⅱ級和Ⅲ級膠質瘤的典型病例及直方圖見圖1~6,Ⅱ級和Ⅲ級膠質瘤ADC信號強度直方圖參數和組間比較結果見表2。
Ⅲ級膠質瘤ADC信號值直方圖的最小值(101.050±9.276)、平均值(192.644±5.034)、第10百分位數(163.947±36.797)、第25百分位數(181.241±24.319)、第50百分位數(193.597±6.201)、第75百分位數(200.605±9.743)、第90百分位數(205.756±12.456)、偏度(-2.531±2.052)、峰度(8.531±8.884)、一致性(0.909±0.087)小于Ⅱ級膠質瘤(127.230±42.714,193.508±6.662,183.773±3.946,187.618±7.201,194.661±5.210,201.846±9.318,208.213±12.500,-0.835±1.795,6.495±5.916,0.093±0.061),隨著腫瘤級別的升高而減小。相反,Ⅲ級膠質瘤的最大值(231.769±6.661)、值域(124.400±59.148)、體素數[(6.827±5.989)×106]、標準差(15.907±13.645)、方差(148.891±1.170)、平均差(64.665±11.350)大于Ⅱ級膠質瘤[230.769±6.669,110.538±47.257,(5.533±4.233)×106,11.805±3.625,125.276±93.364,61.486±6.663],隨著腫瘤級別的升高而增大。其中最小值(P=0.04)、第10百分位數(P=0.03)、體素數(P=0.003)、標準差(P=0.022)、偏度(P=0.017)在Ⅱ級與Ⅲ級膠質瘤間差異具有統計學意義。
使用ROC曲線分析最小值、第10百分位數、體素數、標準差、偏度鑒別診斷Ⅱ級和Ⅲ級膠質瘤的效能,見表3。
以體素數為5.653×10⁶為閾值鑒別診斷Ⅱ級和Ⅲ級膠質瘤,診斷效能最佳,ROC曲線下面積(area under the curve,AUC)最大,為0.856,診斷敏感度為81.5%,特異性為80.0%;以偏度為-1.414為閾值鑒別診斷Ⅱ級和Ⅲ級膠質瘤,ROC曲線AUC次之,為0.750,診斷敏感度為100.0%,特異性為60.0%;以標準差為14.602為閾值鑒別診斷Ⅱ級和Ⅲ級膠質瘤,ROC曲線AUC為0.738,診斷敏感度為100.0%,特異性為55.0%%;最小值、第10百分位數鑒別診斷Ⅱ級和Ⅲ級膠質瘤,ROC曲線AUC分別為0.690和0.662。利用體素數、偏度、標準差鑒別診斷Ⅱ級與Ⅲ級膠質瘤效能的ROC曲線見圖7。
3 討論

圖1 ~3 男,50歲,左額葉間變性星形細胞瘤(WHO Ⅲ級)。圖1 T2WI示腫瘤全域信號混雜;圖2 在ADC信號強度圖上勾畫腫瘤及瘤周水腫區作為感興趣區并與T2WI圖像進行擬合;圖3 此例WHO Ⅲ級膠質瘤患者ADC信號強度的直方圖,示圖像中心明顯左偏,擬合曲線較寬而低,偏度為-4.02,峰度為10.567 圖4~6 男,45歲,右額葉星形細胞瘤(WHO II級)。圖4 T2WI示腫瘤呈稍高信號,信號較均勻;圖5 同樣在ADC信號強度圖上勾畫腫瘤全域作為感興趣區并與T2WI圖像進行擬合;圖6 此例WHO Ⅱ級膠質瘤患者ADC信號強度的直方圖,示圖像中心輕度左偏,擬合曲線高而尖,偏度為-0.12,峰度為8.36Fig. 1 —3 Fifty-year-old man, a histologically verified grade Ⅲ anaplastic astrocytomas in the left frontal lobe. Fig.1 T2WI shows mix signal intensity in tumor whole volume; Fig.2 In ADC signal intensity maps, ROI is drawn including the entire tumor and peripheral edema, and fit on T2WI; Fig.3 The center of the histogram curve obvious deviation to left, the fit curve is wide and low, skewness=-4.02, kurtosis=10.567. Fig.4—6 Fourty-five-year-old man, a histologically verified grade Ⅱ astrocytomas in the right frontal lobe. Fig.4 T2WI shows uniform slightly higher intensity; Fig.5 ROI is drawn including the entire tumor and peripheral edema on ADC signal intensity maps as the same, and fit on T2WI; Fig.6 The center of the histogram curve mild deviation to left,the fit curve is high and sharp, skewness=-0.12, kurtosis=8.36.
參考Kang[23]的方法,本組病例測量的ROI系腫瘤全域,即包括腫瘤及瘤周水腫區,而且不避開壞死囊變區、出血灶以及腫瘤內血管結構。這是由于相對于低級別膠質瘤,高級別膠質瘤血供較豐富,更容易發生壞死、囊變、出血等,這也是高級別膠質瘤的特性表現之一[24]。雖然不同時期的出血ADC值差異較大[25],但基于腫瘤全域的直方圖分析的主要目的是反映腫瘤內部的差異性和不均質性,壞死、囊變、出血都是高級別膠質瘤不均質性的組成部分。另外,由于膠質瘤是侵襲性腫瘤,高級別膠質瘤的瘤周水腫區也是腫瘤的侵襲范圍,包含腫瘤細胞[26],且腫瘤與水腫區在ADC圖上不易區分開。綜合上述原因,筆者的測量區包括了腫瘤全域及瘤周水腫區。
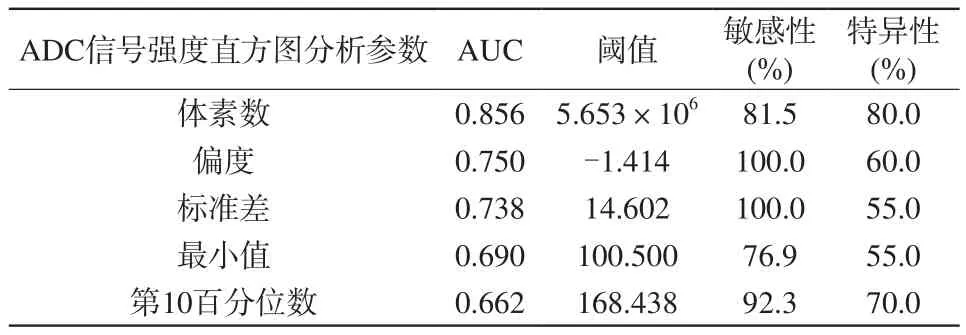
表3 ADC信號強度直方圖參數鑒別診斷Ⅱ級與Ⅲ級膠質瘤的效能Tab.3 Diagnostic ability of ADC signal intensity histogram parameters between WHO grade Ⅱ and Ⅲ
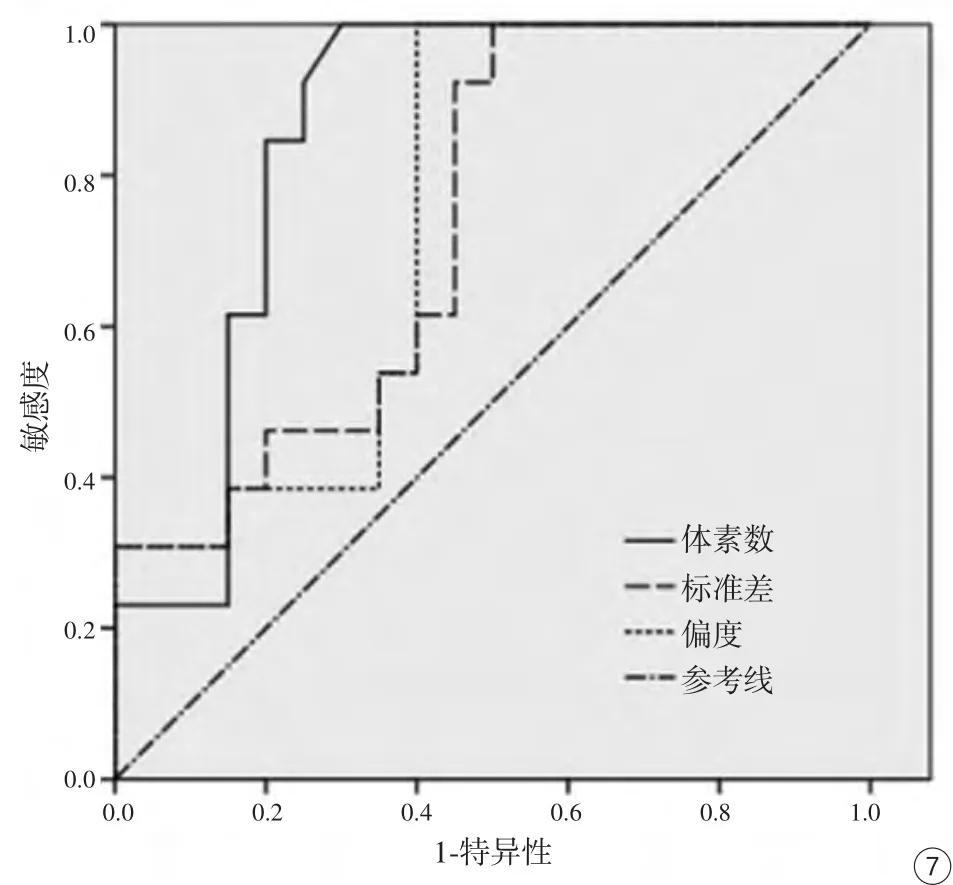
圖7 ROC曲線示體素數、偏度、標準差對于鑒別Ⅱ、Ⅲ級膠質瘤的曲線下面積分別為0.856、0.750、0.738Fig.7 The ROC curve of voxel number, skewness and standard deviation,and the AUC of them is 0.856, 0.750, 0.738.
目前應用ADC值鑒別Ⅱ級與Ⅲ級膠質瘤的研究較少,江晶晶等[27]研究認為ADC值在Ⅱ級與Ⅲ級膠質瘤之間差異具有統計學意義,但無診斷效能的評價。Ryu等[20]利用ADC值直方圖分析對不同級別膠質瘤進行的研究持不同意見,認為Ⅱ級與Ⅲ級膠質瘤的平均ADC值、第5百分位數、偏度、峰度差異均無統計學意義,這可能是由于在他們的研究中ROI避開了囊變、壞死及出血區,而這些正是高級別膠質瘤的特征之一,而筆者的研究證明了部分ADC信號強度直方圖參數在Ⅱ級與Ⅲ級膠質瘤之間差異具有統計學意義,有助于二者的鑒別,而且體素數、偏度以及標準差具有較好的診斷效能,可能會是較好的鑒別診斷參數。
從結果中得知,最小值、平均值、第10百分位數、第25百分位數、第50百分位數、第75百分位數、第90百分位數隨著腫瘤級別的升高而減小,然而只有最小值、第10百分位數差異具有統計學意義,表明低值區的ADC值對于膠質瘤分級的診斷更有意義,這與其他一些學者的研究結果一致。Murakami等[9]的研究認為,最小ADC值對于鑒別高級別膠質瘤是有效的,Kang等[23]的研究也表明高b值DWI的ADC最小值、第5百分位數是鑒別低級別與高級別膠質瘤較好的指標。低值區的ADC值與腫瘤組織密集區有較好的相關性[28],可能與更高級別膠質瘤的細胞密集以及細胞外間隙減小有關。同時,本研究還發現,Ⅲ級膠質瘤的最大值大于Ⅱ級膠質瘤,筆者推測這可能是由于相較于Ⅱ級膠質瘤,Ⅲ級膠質瘤中的囊變、壞死區發生率增高,進而其ADC值的最大值也增高,但差異并不顯著。
值域是反映腫瘤全域ADC值變化范圍的重要指標,Ⅱ級膠質瘤值域小于Ⅲ級膠質瘤,但在本研究中兩組間比較差異無統計學意義,詳細的原因尚不清楚,還需要影像與病理的對照研究予以說明。Ⅲ級膠質瘤的體素數顯著高于Ⅱ級,提示Ⅲ級膠質瘤生長速度更快、侵襲性更強,與Cruz-Sanchez等[29]認為膠質瘤生長速度與惡性程度密切相關;肖俊強等[30]認為膠質瘤分級越高,細胞增殖速度越快一致。在本研究中,體素數對于鑒別Ⅱ級膠質瘤與Ⅲ級膠質瘤的診斷效能最佳,當閾值為5.653×10⁶時,ROC曲線AUC為0.856,敏感度為81.5%,特異性為80.0%,有望作為二者鑒別診斷的一個良好的影像學指標。
標準差、方差、平均差均是用于評價數據離散程度的參數[31-33]。相比于Ⅱ級膠質瘤,Ⅲ級膠質瘤的細胞密集性大,囊變、壞死及出血區也明顯。Ⅲ級膠質瘤的數據離散程度大于Ⅱ級,二者的標準差比較差異有統計學意義,以閾值為14.602鑒別二者,其AUC為0.738,敏感度為100.0%,特異性為55.0%,診斷效能較好。偏度和峰度是描述直方圖曲線分布的參數,是反映腫瘤異質性的較好指標[15,34-35]。和正常腦實質比,腫瘤區域的細胞更加密集,導致ADC值更低,直方圖曲線中心向左偏移,為負值。同樣,Ⅲ級膠質瘤的偏度顯著小于Ⅱ級膠質瘤。以閾值為-1.414鑒別Ⅱ級膠質瘤與Ⅲ級膠質瘤的AUC為0.750,敏感度為100.0%,特異性為60.0%,診斷效能僅次于體素數。
本研究也存在許多局限性。首先,本研究是回顧性研究,無法在外科手術切除前或切除中獲得更多信息,在今后的研究中應該將圖像、組織學及術中特征更多地收集并加以整理分析。第二,研究樣本量相對較小,而且沒有排除含有少突膠質成分的腫瘤,雖然結合CT圖像排除了含有明確鈣化的病例,但仍有可能會造成一些影響。第三,即使腫瘤全域可以最大程度減少抽樣誤差,但在ADC圖的重建配準過程中也難免會產生偏差。最后,本文的術后組織學診斷依據2007年WHO標準,2016年WHO已經發布了新的中樞神經系統分類簡述[36],首次針對大多數腫瘤在組織學分型基礎上增加了分子學分型,在今后的研究中需要更多結合組織學和分子學特征來進行進一步研究。
總之,基于腫瘤全域感興趣區的ADC信號強度直方圖可以為Ⅱ級與Ⅲ級膠質瘤的鑒別診斷提供更多信息,體素數、偏度及標準差是二者之間良好的影像鑒別診斷指標。
[References]
[1] Schwartzbaum JA, Fisher JL, Aldape KD, et al. Epidemiology and molecular pathology of glioma. Nat Clin Pract Neurol, 2006, 2(9):494-503.
[2] Szczepankiewicz F, van Westen D, Englund E, et al. The link between diffusion MRI and tumor heterogeneity: mapping cell eccentricity and density by diffusional variance decomposition(DIVIDE). NeuroImage, 2016, 142: 522-532.
[3] Li ZG.Study on the correlation between the value of apparent diffusion coefficient and MR spectroscopy and proliferation activity of brain gliomas. Guangzhou: Southern Medical University, 2012.李治國. 腦膠質瘤ADC值及多體素磁共振波譜與腫瘤細胞增殖活性的相關性研究. 廣州: 南方醫科大學, 2012.
[4] Le BD. Apparent diffusion coefficient and beyond: what diffusion MR imaging can tell us about tissue structure. Radiology, 2013,268(2): 318-322.
[5] Dong XZ, Xing LG, Yu JM. Medical imaging analysis of tumor heterogeneity and their clinical application. Chinese Journal of Oncology, 2013, 35(2): 81-84.董鑫哲, 邢立剛, 于金明. 腫瘤異質性的醫學影像學分析及臨床應用. 中華腫瘤雜志, 2013, 35(2): 81-84.
[6] Sternberg EJ, Lipton ML, Burns J. Utility of diffusion tensor imaging in evaluation of the peritumoral region in patients with primary andmetastatic brain tumors. AJNR Am J Neuroradiol, 2014, 35(3):439-444.
[7] Catalaa I, Henry R, Dillon WP, et al. Perfusion, diffusion and spectroscopy values in newly diagnosed cerebral gliomas. NMR Biomed, 2006, 19(4): 463-475.
[8] Murakami R, Hirai T, Kitajima M, et al. Magnetic resonance imaging of pilocytic astrocytomas: usefulness of the minimum apparent diffusion coefficient (ADC) value for differentiation from high-grade gliomas. Acta Radiol, 2008, 49(4): 462-467.
[9] Murakami R, Hirai T, Sugahara T, et al. Grading astrocytic tumors by using apparent diffusion coefficient parameters: superiority of a one-versus two-parameter pilot method. Radiology, 2009, 251(3):838-845.
[10] Arvinda HR, Kesavadas C, Sarma PS, et al. Glioma grading:sensitivity, specificity, positive and negative predictive values of diffusion and perfusion imaging. J Neurooncol, 2009, 94(1): 87-96.
[11] Lee EJ, Lee SK, Agid R, et al. Preoperative grading of presumptive low-grade astrocytomas on MR imaging: diagnostic value of minimum apparent diffusion coefficient. AJNR Am J Neuroradiol,2008, 29(10): 1872-1877.
[12] Cha S. Update on brain tumor imaging: from anatomy to physiology.AJNR Am J Neuroradiol, 2006, 27(3): 475-487.
[13] Tozer DJ, J?ger HR, Danchaivijitr N, et al. Apparent diffusion coefficient histograms may predict low-grade glioma subtype. NMR Biomed, 2007, 20(1): 49-57.
[14] Ahn SJ, Choi SH, Kim YJ, et al. Histogram analysis of apparent diffusion coefficient map of standard and high B-value diffusion MR imaging in head and neck squamous cell carcinoma: a correlation study with histological grade. Acad Radiol, 2012, 19(10): 1233-1240.
[15] Suo ST, Chen XX, Fan Y, et al. Histogram analysis of apparent diffusion coefficient at 3.0 T in urinary bladder lesions: correlation with pathologic findings. Acad Radiol, 2014, 21(8): 1027-1034.
[16] Ma X, Zhao X, Ouyang H, et al. Quantified ADC histogram analysis:a new method for differentiating mass-forming focal pancreatitis from pancreatic cancer. Acta Radiol, 2014, 55(7): 785-792.
[17] Woo S, Cho JY, Kim SY, et al. Histogram analysis of apparent diffusion coefficient map of diffusion-weighted MRI in endometrial cancer: a preliminary correlation study with histological grade. Acta Radiol, 2014, 55(10): 1270-1277.
[18] Cho SH, Kim GC, Jang YJ, et al. Locally advanced rectal cancer:post-chemoradiotherapy ADC histogram analysis for predicting a complete response. Acta Radiol, 2015, 56(9): 1042-1050.
[19] Provenzale JM, Mukundan S, Barboriak DP. Diffusion-weighted and perfusion MR imaging for brain tumor characterization and assessment of treatment response. Radiology, 2006, 239(3): 632-649.
[20] Ryu YJ, Choi SH, Park SJ, et al. Glioma: application of whole-tumor texture analysis of diffusion-weighted imaging for the evaluation of tumor heterogeneity. PLoS One, 2014, 9(9): 108335.
[21] Louis D, Ohgaki H, Wiestler O, et al. The 2007 WHO classification of tumors of the central nervous system. Acta Neuro-pathol, 2007,114(2): 97-109.
[22] Zhou Y. Differential diagnosis of intracraninal calcification. J Pract Radiol, 1997, 8(13): 497-498.周儀. 顱內鈣化的鑒別診斷. 實用放射學雜志, 1997, 8(13): 497-498.
[23] Kang Y, Choi SH, Kim YJ, et al. Gliomas: histogram analysis of apparent diffusion coefficient maps with standard-or high-b-value diffusion-weighted MR imaging-correlation with tumor grade.Radiology, 2011, 261(3): 882-890.
[24] Alexander CG, Thomas JC, Rajesh CD, et al. Lymphomas and highgrade astrocytomas: comparison of water diffusibility and histologic characteristics. Radiology, 2002, 224(1): 177-183.
[25] Lang ZJ, Miao YW, Wu RH, et al. Application of advanced MR imaging techniques in central nervous system tumors. Shanghai:Shanghai Science and Technology Publishing House, 2015: 15-16.郎志謹, 苗延巍, 吳仁華, 等. MRI新技術及在中樞神經系統腫瘤的應用. 上海: 上海科學技術出版社, 2015: 15-16.
[26] Price SJ, Jena R, Burnet NG, et al. Improved delineation of glioma margins and regions of infiltration with the use of diffusion tensor imaging: an image-guided biopsy study. AJNR Am J Neuroradiol,2006, 27(9): 1969-1974.
[27] Jiang JJ. Correlation between molecular biology of brain tumors and functional magnetic resonance imaging. Wuhan: Huazhong University of Science and Technology, 2014.江晶晶. 腦腫瘤的分子生物學行為與功能磁共振成像的相關性研究. 武漢: 華中科技大學, 2014.
[28] Lu SS, Kim SJ, Kim N, et al. Histogram analysis of apparent diffusion coefficient maps for differentiating primary CNS lymphomas from tumefactive demyelinating lesions. AJR Am J Roentgenol, 2015, 204(4): 827-834.
[29] Cruz-Sanchez FF, Ferreres JC, Figols J, et al. Prognostic analysis of astrocytic gliomas correlating histological parameters with the proliferating cell nuclear antigen labelling index (PCNA-LI). Histol Histopathol, 1997, 12(1): 43-49.
[30] Xiao JQ, Lu GM, Li SJ, et al. Study on diffusion and perfusion MR imaging for the reoperative evaluation of tumor grade in gliomas. J Med Imaging, 2009, 19(4): 376-380.肖俊強, 盧光明, 李蘇建, 等. 磁共振DWI和PWI在膠質瘤術前分級中的應用研究. 醫學影像學雜志, 2009, 19(4): 376-380.
[31] Yan H. Medical Statistics. Beijing: People’s Medical Publishing House, 2010: 29-32.顏虹. 醫學統計學. 北京: 人民衛生出版社, 2010: 29-32.
[32] Zhou CC. Imaging study of magnetic resonance spectroscopy and texture analysis in glioma with IDHl mutation. Shanghai: Fudan University, 2013.周成丞. IDH1突變膠質瘤磁共振波譜和紋理分析的影像學研究.上海: 復旦大學, 2013.
[33] Zhou SQ. Non-destructive inspection of pear fruit quality based on magnetic resonance imaging. Hangzhou: Zhejiang University, 2013.周水琴. 基于核磁共振成像的梨果品質無損檢測方法研究. 杭州:浙江大學, 2013.
[34] Zhang YD, Wang Q, Wu CJ, et al. The histogram analysis of diffusion-weighted intravoxel incoherent motion (IVIM) imaging for differentiating the gleason grade of prostate cancer. Eur Radiol, 2015,25(4): 994-1004.
[35] Baek HJ, Kim HS, Kim N, et al. Percent change of perfusion skewness and kurtosis: a potential imaging biomarker for early treatment response in patients with newly diagnosed glioblastomas.Radiology, 2012, 264(3): 834-843.
[36] Louis DN, Perry A, Reifenberger G, et al. The 2016 World Health Oganization classification of tumors of the central nervous system: a summary. Acta Neuropathol, 2016, 131(6): 803-820.
Whole tumor volume based histogram analysis of ADC signal intensity for differentitating between WHO grade Ⅱ and Ⅲ glioma
LIU Yang-ying-qiu1, SHANG Jin1, TIAN Shi-yun1, SONG Qing-wei1, HUANG Ning2,GUO Yan2, MIAO Yan-wei1*
1Department of Radiology, The First Affiliated Hospital of Dalian Medical University,Dalian 116000, China
2Life science, GE Healthcare, Shenyang 110000, China
*Correspondence to: Miao YW, E-mail: ywmiao716@163.com
Objective:To evaluate the differential diagnostic value of histogram analysis of ADC signal intensity based on entire region of grade Ⅱ and Ⅲ tumor, and then to investigate a potential imaging biomarker to differentiate them.Materials and Methods:Thirteen patients with grade Ⅱ glioma and 20 patients with grade Ⅲglioma were enrolled in this retrospective study, and all tumors were pathologically confirmed. ROIs containing the entire tumor and peripheral edema were drawn in each slice of the ADC signal intensity maps. Obtained the 3D ROI ADC signal strength histogram information and all its parameters. Histogram related parameters including min intensity, max intensity, mean value, the 10th, 25th, 50th, 75th and 90th percentiles, range, voxel number, standard deviation, variance, mean deviation,skewness, kurtosis and uniformity were recorded. The obtained parameters were compared between groups. Receiver operating characteristic (ROC) curve was constructed to assess the ability of parameters between grade Ⅱ and Ⅲ glioma.Results:Min Intensity (P=0.04), 10th percentiles (P=0.03), voxel number (P=0.003),standard deviation (P=0.022), skewness (P=0.017) showed significant difference between two groups. When optimal cut point of voxel number was 5.46×10⁶for diagnosis of grade Ⅱ and Ⅲ, the area under the ROC curve was maximum, which was 0.856,the sensitivity and specificity was 81.5%, 80.0%. When optimal cut point of skewness was -1.414, the area under the ROC curve was 0.750, the sensitivity and specificity was 100.0%, 60.0%. When optimal cut point of standard deviation was 14.602, the area under the ROC curve was 0.738, the sensitivity and specificity was 100.0%, 55.0%.Conclusion:Histogram analysis of ADC signal intensity based on entire tumor could provide more information in differentiation of grade Ⅱ and Ⅲ glioma. Voxel number,standard deviation and skewness showed superior diagnostic value.
Glioma; Magnetic resonance imaging; Histogram analysis; Apparent diffusion coefficient; Neoplasm grading
24 Dec 2016, Accepted 21 Feb 2017
國家自然科學基金項目(編號:81671646)
苗延巍,E-mail:ywmiao716@163.com
2016-12-24
接受日期:2017-02-21
R445.2;R739.41
A
10.12015/issn.1674-8034.2017.04.008
劉楊穎秋, 尚勁, 田詩云, 等. 利用腫瘤全域表觀擴散系數信號強度直方圖鑒別Ⅱ級與Ⅲ級膠質瘤. 磁共振成像,2017, 8(4): 276-282.
ACKNOWLEDGMENTS This work was part of National Nature Science Foundation of China (No. 81671646).
猜你喜歡
體育科技文獻通報(2022年3期)2022-05-23 13:46:54
天津外國語大學學報(2021年3期)2021-08-13 08:32:18
遼金歷史與考古(2021年0期)2021-07-29 01:06:54
科技傳播(2019年22期)2020-01-14 03:06:54
遼金歷史與考古(2019年0期)2020-01-06 07:45:20
民用飛機設計與研究(2019年4期)2019-05-21 07:21:24
電子制作(2018年11期)2018-08-04 03:26:04
汽車工程學報(2017年2期)2017-07-05 08:13:02
國際商務財會(2017年8期)2017-06-21 06:14:14
電子制作(2017年23期)2017-02-02 07:17:19