Luminescence and Optical Temperature Sensing Properties of NaY(MoO4)2∶Er3+Nanocrystalline Phosphor
2017-12-05 07:36:34-,-,-,-
發(fā)光學報 2017年12期
-, -, -, -
(Key Laboratory of Photoelectric Bandgap Materials, Ministry of Education, Harbin Normal University, Harbin 150025, China)
LuminescenceandOpticalTemperatureSensingPropertiesofNaY(MoO4)2∶Er3+NanocrystallinePhosphor
SUNYing-fei,LYUShu-chen*,MENGQing-yu,QUXiu-rong
(KeyLaboratoryofPhotoelectricBandgapMaterials,MinistryofEducation,HarbinNormalUniversity,Harbin150025,China)
The NaY(MoO4)2∶Er3+phosphors derived at different calcination temperatures were prepared by molten salt method and the crystal structure and microscopic morphology were characterized by means of X-ray diffraction(XRD) and field emission scanning electron microscopy (FE-SEM). The Stokes fluorescence emission spectra of nanocrystals derived at different calcination temperatures have been measured. It can be found that the emission intensity ratio of2H11/2-4I15/2to4S3/2-4I15/2transitions from NaY(MoO4)2∶Er3+increases with the decrease of the calcination temperature. Furthermore, the temperature sensing properties of NaY(MoO4)2∶Er3+phosphors were studied based on the emission intensities from two thermally coupled2H11/2and4S3/2levels of Er3+. The results show that the temperature sensing sensitivity of the sample calcinated at600℃ is somewhat higher than that of the sample calcinated at900℃in a relatively wide range of sensing temperature (303-573K). The sensing sensitivity increases with the decreasing of the calcination temperature, and a relative high sensitivity of1.36×10-2K-1is obtained for the sample calcinated at600℃, which is about76.6% higher than that of the sample obtained at900℃. Finally, the physical mechanism for the calcination temperature-dependence of temperature sensing sensitivity was explained and predicted.
molten salt method, NaY(MoO4)2∶Er3+phosphors, temperature sensing
1 Introduction
In recent years, rare earth (RE) ion doped phosphors have become a current tendency because of their prominent luminescence properties, gaining a vast application prospect in some fields, such as fluorescent lamps, displays, biosensors,etc.[1-4]. The optical temperature sensing is regarded as a kind of the application prospect of non-contact, environmental protection and high sensitivity optical temperature sensing technology[5-7]. In addition, some of the rare earth ions applied to optical temperature sensing have aroused general concern, for example, Er3+has two thermally coupled energy level2H11/2and4S3/2and pretty good luminescence properties[8-10].

Temperature-sensitive fluorescent materials are increasingly receiving attention, because it can provide a non-contact temperature measurementviaprobing the dependence of fluorescence intensities on temperature[7]. In this work, Er3+doped NaY(MoO4)2phosphors were synthesized by molten salt method, and the phosphors were obtained by adjusting the amount of calcinations temperature. The temperature sensing properties of Er3+doped NaY(MoO4)2were studied. This work will provide an application potential for optical temperature sensor.
2 Experiments
2.1 Synthesis
NaY(MoO4)2∶Er3+phosphors with different calcination temperatures were prepared by a molten salt method. First, ([Y3+]∶[Er3+]=98∶2, the Re3+is 0.002 mol totally) in a typical experiment, 2 mmol Y(NO3)3·6 H2O, 2 mmol Er(NO3)3·6 H2O, 4 mmol Na2MoO4, 100 mmol NaNO3and 50 mmol KNO3as starting materials were weighed and ground adequately in an agate mortar. In the next step, the homogeneous mixture was transferred to a crucible and sintered at the temperatures of 350 ℃ for 3 h in air. After cooling to room temperature in furnace, the precursor was stirred with distilled water, after that the suspension was centrifuged at 4 500 r/min for 30 min. The resultant precipitate was washed several times, then dried at 80 ℃ for 8 h in drying cabinet. Last, the resultant precipitate was calcined at 600, 750, and 900 ℃ for 2 h, respectively. Finally, the NaY(MoO4)2∶Er3+phosphors with different calcination temperatures were obtained.
2.2 Characterization
The XRD of all the samples is detected by a D/max 2600 diffractometer by usingλ=0.154 06 nm radiation of Cu Kα1. The range of the scanning mode is from 10°-70°. The morphology and microstructure were characterized by field-emission scanning electron microscopy (FE-SEM, SU70, Hitachi). The emission, excitation spectra were carried out on a FluoroMax-4 spectrophotometer with temperature controlling and monitoring system which can accurately heat the samples in a temperature range from 303 to 573 K.
3 Results and Discussion
3.1 Structural and Morphology Characterization of The Phosphors
Fig.1 shows the XRD patterns of NaY(MoO4)2∶Er3+phosphors under the calcinations temperature of 600, 750, and 900 ℃, respectively. The crystal lattice is body-centered tetragonal, the diffraction peak positions are consistent well with those reported in JCPDS card No.82-2369. The samples which we prepared are pure phase since no diffraction peaks of impurities were observed in the XRD. According to the data of XRD patterns, the average crystallographic sizes can be calculated by the Scherrer formula which showed as follows[14]:
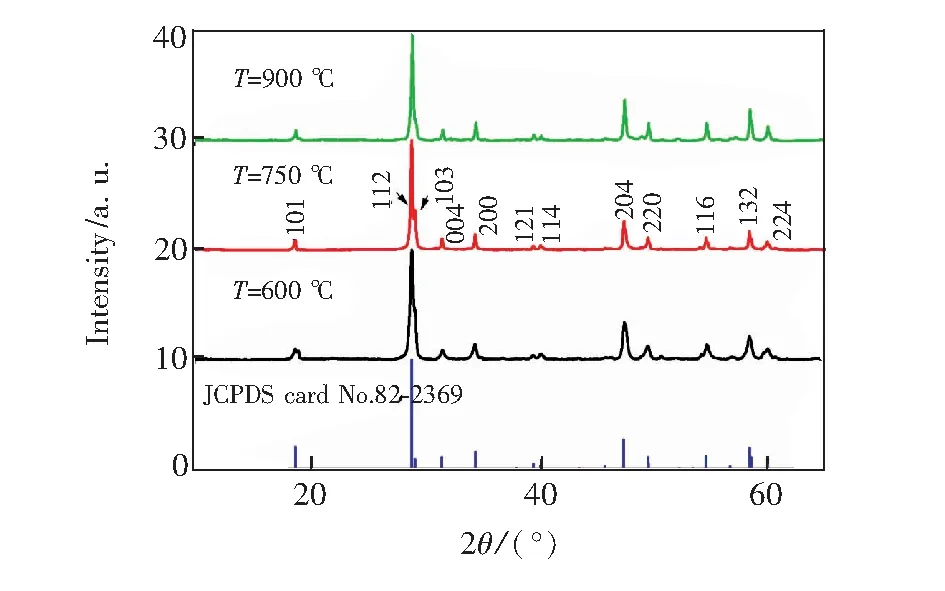
Fig.1 X-ray diffraction patterns of NaY(MoO4)2∶Er3+phosphors under different calcination temperature
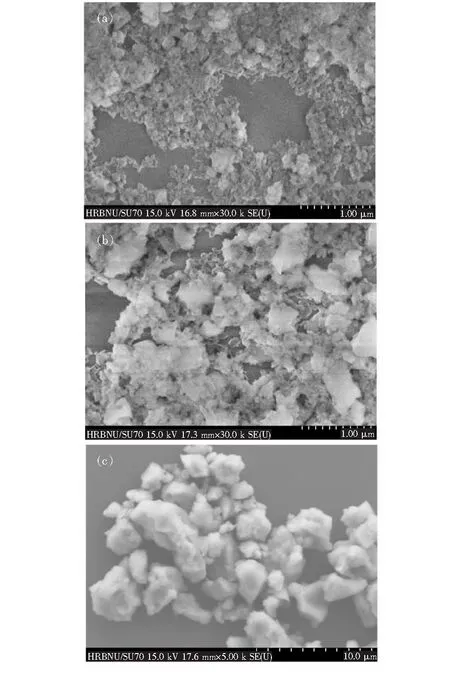
Fig.2 FE-SEM images of NaY(MoO4)2∶Er3+phosphors corresponding to calcinations temperatures of 600, 750, 900 ℃, respectively.
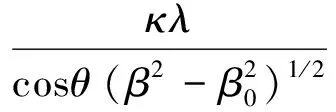
(1)
whereκ=0.9,λ=0.154 06 nm,θis the Bragg angle,βrepresents the full width at half maximum (FWHM) of the diffraction peak, andβ0is a modification factor for the system broadening. The average particle size of the samples was calculated from the three strongest peaks in the XRD patterns. The particle size of the samples with calcinations temperature of 600, 750, 900 ℃ was obtained to be 20.68, 31.02, and 36.19 nm, respectively. It will produce a large accretion of error when the particle size is bigger than 100 nm, so the calculation value of the sample under the calcinations temperature of 600 and 900 ℃ was not applied.
Fig.2 shows the FE-SEM images of the samples which mentioned in Fig.1. It can be found that the particle sizes of the samples under the calcinations temperature of 600, 750, 900 ℃ were about 30,300, and 3 μm. The particle sizes exhibited in FE-SEM are in good agreement with the calculation results.
3.2 Excitation Spectra Depended on Calcination Temperature
We can see from Fig.3 that the room temperature excitation spectra of NaY(MoO4)2∶Er3+with different calcination temperatures for monitoring the4S3/2-4I15/2emission of Er3+ions, the scanning range is from 250 to 500 nm. it can be seen that the two main excitation peaking at 378 and 487.5 nm corresponding to the4G11/2-4I15/2and4F7/2-4I15/2transitions and the four excitation peaking at 364.5, 406,442.5, and 450 nm corresponding to the2G9/2-4I15/2,2H9/2-4I15/2,2F3/2-4I15/2, and2F5/2-4I15/2transitions. In the near-ultraviolet and blue light region, Er3+doped NaY(MoO4)2may possess strong absorption corresponding to Er3+4f-4f transition and effective transfer the green light emission.

Fig.3 Excitation spectra of NaY(MoO4)2∶Er3+phosphors at room temperature with different calcination temperature
3.3 Temperature Sensing Properties
The luminescent properties of rare earth doped material have attracted a lot of interest for using as temperature sensing material[15-17]. Er3+has two excellent thermal energy levels:2H11/2and4S3/2.The transition of2H11/2-4I15/2and4S3/2-4I15/2can emit green light located at 520 and 550 nm, respectively. The integrated intensity ratio of the two green light emissions changed obviously with the changing of the temperature. The emission spectra of NaY(MoO4)2∶Er3+material with different calcination temperatures under the 378 nm excitation were obtained in a temperature region of 303 to 573 K, which showed in Figs.4-6. It can be seen that the two main emission peaks locating at 520 and 550 nm corresponding to the2H11/2-4I15/2and4S3/2-4I15/2transitions. The relative strength of all the emission peaks presents the same changing trend. The emission intensity of2H11/2-4I15/2transition increases with the temperature increase, while the emission intensity of4S3/2-4I15/2transition decreases. In general, the fluorescence intensity ratio of2H11/2-4I15/2to4S3/2-4I15/2transitions can be expressed byR. The value ofRis different among the samples with different calcination temperatures. Moreover, the value ofRfor the same sample at various temperatures is also different. The fluorescence integrated intensity ratio of the samples with different calcination temperatures can be represented byR1(600 ℃),R2(750 ℃), andR3(900 ℃), which showed in Tab.1. It can be found that the value ofRincreases with the temperature increase.

Fig.4 Emission spectra of NaY(MoO4)2∶Er3+phosphors with the calcination temperature of 600 ℃ in a temperature region of 303 to 573 K

Fig.5 Emission spectra of NaY(MoO4)2∶Er3+phosphors with the calcination temperature of 750 ℃ in a temperature region of 303 to 573 K
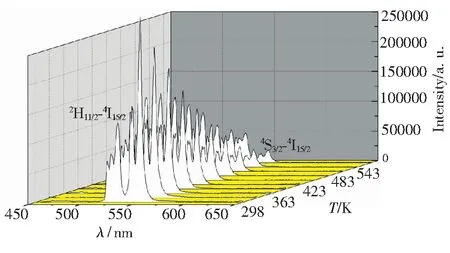
Fig.6 Emission spectra of NaY(MoO4)2∶Er3+phosphors with the calcination temperature of 900 ℃ in a temperature region of 303 to 573 K
Tab.1IntegratedemissionintensityofEr3+2H11/2-4I15/2and4S3/2-4I15/2transitionofthesamples
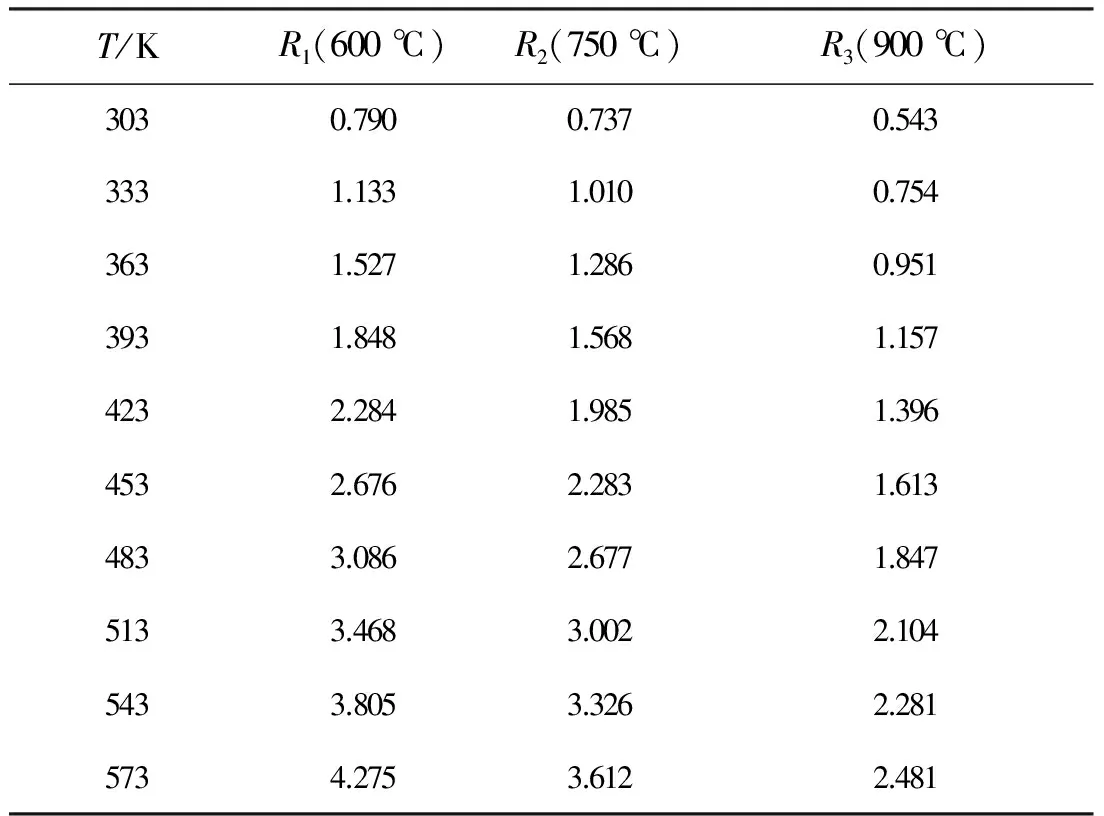
T/KR1(600℃)R2(750℃)R3(900℃)3030.7900.7370.5433331.1331.0100.7543631.5271.2860.9513931.8481.5681.1574232.2841.9851.3964532.6762.2831.6134833.0862.6771.8475133.4683.0022.1045433.8053.3262.2815734.2753.6122.481
Fig.7 shows the dynamic process of the luminescence of Er3+in NaY(MoO4)2∶Er3+phosphors. It can be found that when the samples are excited by 378 nm fluorescence, the4I15/2level reaches4G11/2level. Er3+at the4G11/2state can decay rapidly down to the2H11/2state, and finally the transition from2H11/2-4I15/2state results on the green emission at 520 nm. Similarly, Er3+at the4G11/2state can also decay rapidly down to the4S3/2state, and finally the4S3/2-4I15/2transition reveals 550 nm green emissions.
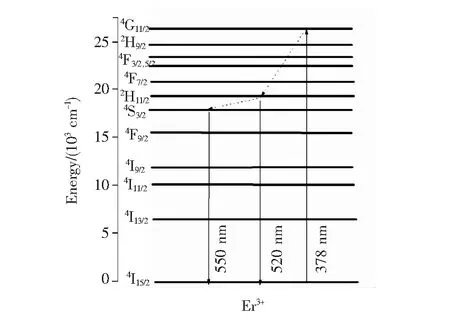
Fig.7 Energy level diagram of Er3+and the luminescent process under the excitation of 378 nm light
The integrated emission intensity of Er3+locating at 520 and 550 nm can be expressed asIupandIlow, respectively, andR=Iup/Ilow. The number of electron on2H11/2level and4S3/2level of Er3+is related to the temperature, and follow the Boltzmann distribution law. Therefore, the relation between the fluorescence intensity ratio of2H11/2level to4S3/2level and temperature can be written as follows[18-19]:

(2)
whereCis a constant concerning the host materials, ΔEis the energy distance between2H11/2level and4S3/2level which can be experimentally determined from the emission spectrum,kis the Boltzmann constant, andTis absolute temperature. For the samples with different calcination temperatures,Cand ΔE/kcan not be the same. Then, the Eq.(2) can also be converted in the form of a linear equation as

(3)
putting the different values of lnRand 1/Tinto Eq.(3), ΔE/kand lnCvalues can be obtained by linear fitting. The slope of ΔE/k-lnCis a very important parameter to judge the optical temperature sensing ability of Er3+doped materials, which are shown in Fig.8. Putting the slope andC(derived from lnC) into Eq.(2), the emission integrated intensity ratio of2H11/2-4I15/2to4S3/2-4I15/2transitions with various temperatures can be obtained, which shown in Fig.9 (point is the experimental data obtained, the line is fitting data obtained). The results were showed in Tab.2, the temperature sensing curves of the samples can be got from it.

Fig.8 Value of lnRdependence on the inverse absolute temperature in NaY(MoO4)2∶Er3+phosphors with different calcination temperature. (a) 600 ℃. (b) 750 ℃. (c) 900 ℃.

Fig.9 Value ofRdependence on the temperature in NaY-(MoO4)2∶Er3+phosphors with different calcination temperature. Solid squares are experimental data, solid line is the fitting result by Eq.(2).
Tab.2ValueofCandΔE/kofthesampleswithdifferentcalcinationtemperature
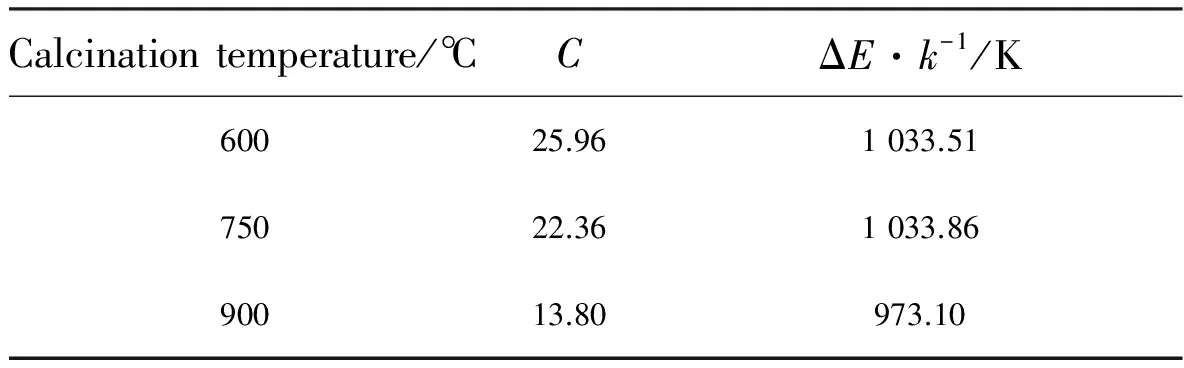
Calcinationtemperature/℃CΔE·k-1/K60025.961033.5175022.361033.8690013.80973.10
3.4 Temperature Sensing Sensitivity
For the Er3+-based temperature sensor, the sensitivityScan be defined as[5,8]

(4)
Sensitivity is an important factor for evaluating the performance of the sensor. The moreSis large, the more obviouslyRchanged, so the samples with largeSvalue can reflect the change of temperature more clearly, and more suitable for being temperature sensing material.Sof the samples with different sizes shown in Fig.10 can be obtained by taking the data in Tab.2 and the temperature to Eq.(4). It can be found that the value ofSincreases with the decreasing of the calcination temperature. The maximum value for the sensitivities of the sample with calcination temperature of 600, 750, and 900 ℃ is 1.36×10⁻², 1.17×10⁻², and 7.67×10⁻³K-1. After the data analysis, the temperature sensing property of lower calcination temperature is better than higher calcination temperature, which suggests the lower calcination temperature is more suitable to be used in temperature sensing material.
It can be found in Eq.(4) that the sensitivity of material is related toCand ΔE/k. The larger the ΔEis, the larger the ΔE/kis. The values of ΔE/kfor the samples with calcination temperatures of 600, 750, and 900 ℃ are 1 033.509 67, 1 033.863 03, and 973.098 34 K, respectively. The observed change in the energy separation between the emitting levels could be caused by differences in the crystal field for different calcination temperatures or by the different contributions of ‘surface’ ions for different calcination temperatures.

Fig.10 Thermal sensitivity-temperature curves of NaY(MoO4)2∶
Er3+phosphors with different calcination temperature From Eq.(5) it can be concluded that the sensitivity of material is related toCand ΔE/k. The larger the ΔEis, the larger the ΔE/kis. But the ΔE/kchanged little in our work. Moreover, it can be found from Eq.(5), sensitivitySisCdependent. SoCfor different materials can be decided by the following Eq.(5)[6]
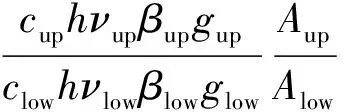
(5)
The pre-exponential parameters depends on the following reasons: (1) The instrument responseci, which can be considered equal to unity since the emission spectra were corrected from the instrument response. (2) The average photon energy of each transitionhνi. (3) The percentage of the total emission from the thermalized level to the final4I15/2levelβi. (4) The degeneracy of the thermalized levelsgi. (5) The radiation transition rate of each thermalized levels to4I15/2level,Ai“up” corresponding to2H11/2level, “l(fā)ow” corresponding to4S3/2level . From Eq.(5), it can be seen thatCis proportional to theAup/Alow. The radiation transition rate between levels of rare earth ion is related to the transition matrix element of ion and transition intensity parameters of host material. Therefore,Cof the material whose luminescent center is Er3+can be expressed as follows[6-7]

(6)
Ω2,Ω4,Ω6in the above Eq.(6) are the Judd-Ofelt intensity parameters.
As we know that the small size sample with poor crystallinity has much more disordered environment than bulk because of existence of surface defects. The more disordered environment may correspond to the poorer crystallinity. Moreover, the increasing disorder of environment will lead to the increase of transition intensity parameters, so the transition intensity parameters in small size sample are noticeable larger than that in bulk material, especiallyΩ2. It is generally believed that the rate of change ofΩ2with environment is more obvious than that ofΩ4andΩ6[7]. Hence, the value ofCin small size sample is bigger than that of in bulk material. Back to Eq. (4), the temperature sensing sensitivity of small size sample is better than bulk material in the temperature range of 303-593 K.
The maximum value of sensitivity (S) of Er3+activated optical temperature sensing materials has been reported is 1.7×10⁻³to 7.9×10⁻³K-1[7,10,20-25]. Then the sensitivity of Er3+co-doped NaY(MoO4)2nano-materials we prepared has advantage. In this work, the values of ΔE/k,CandShave been obtained in NaY(MoO4)2∶Er3+phosphors, so it is necessary to compare our results with other relevant studies. The optical temperature sensing ability of Er3+doped other material is shown in Tab.3. Compared with other materials, the samples of this work have a relative better performance.
Tab.3RelevantparametersandmaximalsensitivityaswellastemperaturesforthemaximalsensitivityandtheexcitationwavelengthforEr3+dopedhosts

HostCΔE·k-1/KS/K-1T/Kλex/nmRefs.Gd2O317.241175.30.0084570980[7]BaTiO39.971200.00.0045600980[21]NaYF44.89719.80.0037363980[22]YNbO46.29759.60.0072406980[23]Yb2Ti2O79.30679.20.0074345976[24]Al2O39.63964.10.0051495978[25]YVO420.781011.40.0111498980[13]NaY(MoO4)225.961033.50.0136517378Thiswork
4 Conclusion
In conclusion, the nanocrystalline NaY(MoO4)2∶Er3+phosphors with various calcination temperatures were prepared through a molten salt method. The structure of the phosphors was examined by means of XRD. In addition, the crystal lattice is body-centered tetragonal. In addition, the temperature sensing properties of NaY(MoO4)2∶Er3+phosphor were studied. The temperature sensing sensitivity of the materials we prepared is superior to that of materials reported in literatures. The sensitivity will increase with the decrease of the calcination temperature. It shows that in a relatively wide range of sensing temperature (303-573 K), the temperature sensing sensitivity of lower calcination temperature is somewhat better than that of higher calcination temperature. The temperature sensing sensitivity of calcination temperature of 900 ℃ is 7.67×10⁻³K-1, and the value for 600 ℃ sample is 1.36×10⁻²K-1which is about 76.6% higher than that of calcination temperature of 900 ℃. This is ascribed to more disordered local environment in the higher calcination temperature, which leads to the increase of transition intensity parameters. Although the improvement of sensitivity is not obvious, but the above results can also provide a potential approach for improving the properties of Er3+doped optical temperature sensing materials.
[1] TUAN P V, LE T H, NGA L Q,etal.. Hydrothermal synthesis and characteristic photoluminescence of Er-doped SnO2nano-particles [J].PhysicaB, 2016, 501:34-37.
[2] SUN Y J, ZHAO Z T, LI P W,etal.. Er-doped ZnO nanofibers for high sensibility detection of ethanol [J].Appl.Surf.Sci., 2015, 356:73-80.
[3] WU X, CHI M L, KWOK K W. Effect of phase transition on photoluminescence of Er- doped KNN ceramics [J].J.Lumin., 2015, 155:343-350.
[4] WANG X S, ZHANG J B, WANG L Y,etal.. High response gas sensors for formaldehyde based on Er-doped In2O3nanotubes [J].J.Mater.Sci.Technol., 2015, 31:1175-1180.
[5] ZHENG H, CHEN B J, YU H Q,etal.. Temperature sensing and optical heating in Er3+single-doped and Er3+/Yb3+codoped NaY(WO4)2particles [J].RSCAdv., 2014, 4:47556-47563.
[7] TIAN Y, TIAN B N, CUI C E,etal.. Size-dependent upconversion luminescence and temperature sensing behavior of spherical Gd2O3∶Yb3+/Er3+phosphor [J].RSCAdv., 2015, 5:14123-14128.
[8] VETRONE F, NACCACHE R, ZAMARRO A N,etal.. Temperature sensing using fluorescent nanothermometers [J].ACSNano, 2010, 4:3254-3258.
[9] WANG X, ZHANG Z G, GAO W W. Excellent optical thermometry based on short-wavelength upconversion emissions in Er3+/Yb3+codoped CaWO4[J].Opt.Lett., 2012, 37:4865-4867.
[10] RAKOV N, MACIEL G S. Three-photon upconversion and optical thermometry characterization of Er3+∶Yb3+co-doped yttrium silicate powders [J].Sens.ActuatorsB:Chem., 2012, 164:96-100.
[11] PARCHUR A K, NINGTHOUJAM R S, RAI S B,etal.. Luminescence properties of Eu3+doped CaMoO4nanoparticles [J].DaltonTrans., 2011, 40(29):7595.
[12] PARCHUR A K, NINGTHOUJAM R S. Preparation and structure refinement of Eu3+doped CaMoO4nanoparticles [J].DaltonTrans., 2011, 40(29):7590.
[13] MENG Q Y, LIU T, DAI J Q,etal.. Study on optical temperature sensing properties of YO4∶Er3+,Yb3+nanocrystals [J].J.Lumin., 2016, 179:633-638.
[14] TROJAN-PIEGZA J, ZYCH E. Preparation of nanocrystalline Lu2O3∶Eu phosphorviaa molten salts route [J].J.AlloysCompd., 2004, 38:118-122.
[15] WANG F, BANERJEE D, LIU Y S,etal.. Upconversion nanoparticles in biological labeling, imaging, and therapy [J].Analyst, 2010, 135:1839-1854.
[16] DEBASU M L, ANANIAS D, PASTORIZA-SANTOS I,etal.. All-in-one optical heater-thermometer nanoplatform operative from 300 to 2 000 K based on Er3+emission and blackbody radiation [J].Adv.Mater., 2013, 25:4868-4874.
[17] JAQUE D, VETRONE F. Luminescence nanothermometry [J].Nanoscale, 2012, 4:4301-4326.
[18] DONG B, CAO B S, HE Y Y,etal.. Temperature sensing andinvivoimaging by molybdenum sensitized visible upconversion luminescence of rare-earth oxides [J].Adv.Mater., 2014, 24:1987-1993.
[19] LI J J, SUN S, LIU J T,etal.. Pumping-route-dependent concentration quenching and temperature effect of green up- and down-conversion luminescence in Er3+/Yb3+co-doped Gd2(WO4)3phosphors [J].Mater.Res.Bull., 2013, 48:2159-2165.
[21] ALENCAR M A R C, MACIEL G S, DE ARAJO C B,etal.. Er3+-doped BaTiO3nanocrystals for thermometry: influence of nanoenvironment on the sensitivity of a fluorescence based temperature sensor [J].Appl.Phys.Lett., 2004, 84:4753-4755.
[22] DONG B, HUA R, CAO B,etal.. Wolfbeis, size dependence of the upconverted luminescence of NaYF4∶Er,Yb microspheres for use in ratiometric thermometry [J].Phys.Chem.Chem.Phys., 2014, 16:20009-20012.
[23] TIAN Y Y, TIAN Y, HUANG P,etal.. Effect of Yb3+concentration on upconversion luminescence and temperature sensing behavior in Yb3+/Er3+co-doped YNbO4nanoparticles preparedviamolten salt route [J].Chem.Eng.J., 2016, 297:26-34.
[24] CAO B, HE Y, FENG Z,etal.. Optical temperature sensing behavior of enhanced green upconversion emissions from Er-Mo∶Yb2Ti2O7anophosphor [J].Sens.ActuatorsB:Chem., 2011, 159:8-11.
[25] DONG B, LIU D, WANG X,etal.. Optical thermometry through infrared excited green upconversion emissions in Er3+-Yb3+codoped Al2O3[J].Appl.Phys.Lett., 2007, 90(18):181117-1-3.
2017-06-01;
2017-07-25
哈爾濱創(chuàng)新科技人才研究專項基金(2014RFXXJ091); 光電帶隙材料省部共建教育部重點實驗室開放項目計劃(PEBM201614)資助項目
NaY(MoO4)2∶Er3+納米晶體熒光粉的發(fā)光與光學溫度傳感特性
孫英斐, 呂樹臣*, 孟慶裕, 曲秀榮
(哈爾濱師范大學 光電帶隙材料省部共建教育部重點實驗室, 黑龍江 哈爾濱 150025)
采用熔鹽法制備了不同煅燒溫度的NaY(MoO4)2∶Er3+熒光粉材料,樣品的晶體結(jié)構(gòu)與微觀形貌由X射線衍射儀和場發(fā)射掃描電鏡測得。Er3+摻雜的 NaY(MoO4)2納米晶體的斯托克斯熒光發(fā)射光譜是在不同煅燒溫度下測得的。NaY(MoO4)2∶Er3+熒光粉材料的兩個能級2H11/2-4I15/2和4S3/2-4I15/2躍遷的發(fā)射強度比隨煅燒溫度的增加而減小。NaY(MoO4)2∶Er3+熒光粉材料的溫度傳感特性依賴于Er3的兩個熱耦合能級2H11/2-4I15/2和4S3/2-4I15/2的發(fā)射強度。研究表明,在一個相對大的傳感溫度范圍(303~573 K),600 ℃煅燒的樣品的溫度傳感靈敏度比900 ℃煅燒的樣品高,樣品的溫度傳感靈敏度隨煅燒溫度的增加而減小,600 ℃煅燒的樣品的溫度傳感靈敏度為 1.36×10⁻²K-1,比900 ℃煅燒的樣品高76.6%。最后,解釋了基于不同煅燒溫度的溫度傳感靈敏度的物理機制。
熔鹽法; NaY(MoO4)2∶Er3+熒光粉; 溫度傳感
1000-7032(2017)12-1582-09
Supported by Harbin Innovative Talent in Science and Technology Research Special Fund Project(2014RFXXJ091); Open Project Program of Key Laboratory for Photonic and Electric Bandgap Materials, Ministry of Education, Harbin Normal University, China (PEBM201614)
*CorrespondingAuthor,E-mail:hsdlsc63@126.com
O482.31DocumentcodeA
10.3788/fgxb20173812.1582

孫英斐(1991-),男,黑龍江佳木斯人,碩士研究生,2014年于哈爾濱師范大學獲得學士學位,主要從事凝聚態(tài)物理方面的研究。E-mail: 279697358@qq.com

呂樹臣(1963-),男,黑龍江哈爾濱人,教授,博士生導師,2002 年于中國科學院長春光學精密機械與物理研究所獲得博士學位,主要從事量子光學及固體發(fā)光方面的研究。E-mail: hsdlsc63@126.com