數據
2018-05-09 15:57:00
China Textile 2018年4期
Recent price movement
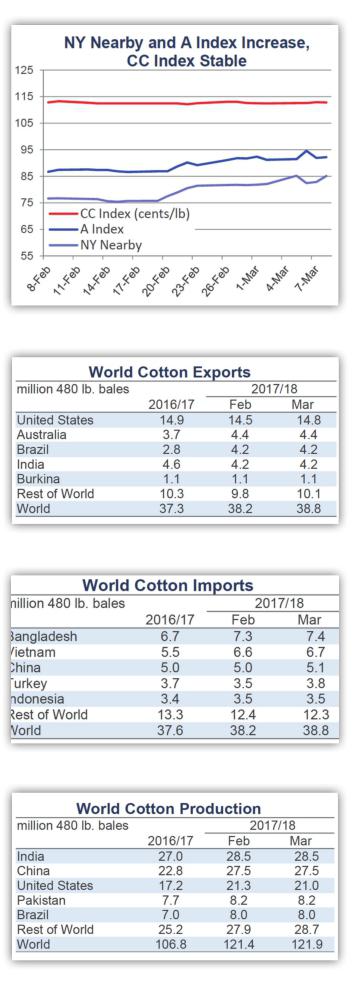
Movement in international benchmark prices was mixed over the past month, with NY futures and the A Index increasing, South Asian prices flat to lower, and Chinese prices stable.
Prices for the May NY futures contract have trended higher since late February. In the first full week of March, there was a surge that briefly lifted values over 85 cents/lb and new life-of-contract highs. Shortly after, there was a collapse, with values dropping 3-4 cents. In the latest trading, prices have been rising again, with the most recent values 84 cents/lb.
The A Index also increased over the past month. The most recent values, near 92 cents/lb, are about five cents/lb higher than those a month ago.
The China Cotton Index (CC Index, base grade 3128B) was stable in both international and domestic terms over the past month. In international terms, the CC Index held near 113 cents/lb. In domestic terms, prices held near 15,000 RMB/ton.
Indian spot prices (Shankar-6 quality) decreased slightly in late February, dropping from the equivalent of 80 to 78 cents/lb. In domestic terms, prices were flat to higher, holding to levels near 40,000 INR/candy throughout most of February and rose to 41,000 INR/candy in early March.
In international terms, Pakistani prices decreased from 80 cents/lb to 76 cents/lb in February. In March, prices moved slightly higher, with the latest levels near 78 cents/lb. In domestic terms, prices ranged between 7,300 and 6,900 PKR/maund, with the latest levels near 7,100 PRK/maund.
Supply, demand, & trade
This months USDA report featured slight increases to both global production(+566,000 bales, from to 121.4 to 121.9 million) and mill-use (+290,000, from 120.5 to 120.8 million). With the addition to the harvest exceeding the addition to consumption, the effect was an increase in ending stocks (+291,000 bales, from 88.6 to 88.8 million).
Driving the upward revision to global production were increases to estimates for Sudan (+730,000 bales, from 170,000 to 900,000) and Australia (+300,000, from 4.4 to 4.7 million). Partially offsetting these additions were decreases to crop figures for the U.S. (-233,000 bales, from 21.3 to 21.0 million) and Uzbekistan (-120,000, from 3.7 to 3.6 million).
For mill-use, there were a series of small revisions. Increases were made for Bangladesh (+100,000 bales, 7.2 to 7.3 million), Sudan (+100,000, from 25,000 to 125,000), Turkey (+100,000, from 7.0 to 7.1 million), and Vietnam (+100,000, from 6.4 to 6.5 million). Consumption in Taiwan was lowered 110,000 bales, from 680,000 to 570,000.
The global trade forecast was increased 600,000 bales, from 38.2 to 38.8 million. In terms of imports, the largest changes were for Turkey (+300,000 bales, from 3.5 to 3.8 million), Bangladesh (+150,000, from 7.3 to 7.4 million), China (+100,000, from 5.0 to 5.1 million), Vietnam (+100,000, from 6.6 to 6.7 million), and Taiwan (-150,000, from 700,000 to 550,000). In terms of exports, the largest changes were for Sudan(+375,000, from 125,000 to 500,000), the U.S. (+300,000, from 14.5 to 14.8 million), and Uzbekistan (-100,000, from 1.2 to 1.1 million).
Price outlook
At their Annual Outlook Forum, held in late February, the USDA releases a preliminary set of forecasts for an upcoming crop year. In the figures released a couple of weeks ago, the USDA indicated that in 2018/19 global cotton production will be slightly lower (down 4%, to 117.0 million bales) and global cotton consumption will be slightly higher (up 2%, to 122.9 million bales) than in 2017/18. These early estimates suggest a production deficit of 5.9 million bales (5% of projected global mill-use) will occur in 2018/19.
Considering that world cotton stocks will remain high by historical standards, the global production deficit may not be a primary driver of price movement. As has been the case for the past several years, what can be expected to be more important for price direction is the allocation of stocks inside and outside of China. China has successfully drawn down its stocks over the past three crop years, and is expected to reduce its stocks again in 2018/19 (-7.3 million bales, to 33.6 million).
For the collection of countries outside of China, stocks are expected to increase slightly (+1.4 million bales, to 49.3 million). If realized, this addition would follow the 8.6 million bale (22%) increase estimated for the current 2017/18 crop year. The increase in 2017/18 will set a new record for stocks outside China, surpassing the previous record (set in 2014/15) by 8%.
Given that stocks outside of China are generally free to trade, this supply could have been expected to weigh on prices and to have pulled them lower. However, prices have been moving in the other direction. A range of possible explanations surfaced to explain why prices have been rising instead of falling. Among these have been concerns regarding the size of the Indian crop, speculative investment, the record level of unfixed on-call sales, and the high volume of committed U.S. export sales.
As the series of recent USDA revisions to U.S. export forecasts suggests, uncertainty surrounds the level of U.S. exports for 2017/18. While the level of contracted sales is high, exceeding the level from one year ago by nearly 2.5 million bales, those contracts can be cancelled or rolled forward to the upcoming 2018/19 crop year (a major reason why current commitment is so high is that a large volume of contracts was carried forward from 2016/17). Due to transport bottlenecks, the flow of cotton out of U.S. ports has been slower than last year, but the latest weekly export data indicate that shipping has accelerated. The extent to which that faster rate might be maintained will determine the eventual level of U.S. exports, and therefore the eventual volume of U.S. ending stocks. Currently, the USDA indicates that U.S. ending stocks will nearly double, from 2.8 million in 2016/17 to 5.5 million in 2017/18. The USDA expects that high level of U.S. stocks to be maintained in 2018/19, but several key questions associated with that projection have already emerged, most notably the impact of dry West Texan weather and the potential for China to increase imports.

- China Textile的其它文章
- Freudenberg opens R&D center for Apparel Performance Materials in Taiwan
- Card Monroe Corp.wins ColorPoint Patent Infringement Case
- Fashion’s creativity includes technology
- “New Development,New Retail,New Intelligence”
- The Belt&Road Investment in Egypt and Romania Seminar was successfully held
- Insight into the future to seek for new development path