基于無人機數碼影像和高光譜數據的冬小麥產量估算對比
2019-02-20 13:31:36陶惠林馮海寬楊貴軍楊小冬苗夢珂吳智超翟麗婷
農業工程學報 2019年23期
陶惠林,馮海寬,楊貴軍,楊小冬,苗夢珂,5,吳智超,5,翟麗婷,5
基于無人機數碼影像和高光譜數據的冬小麥產量估算對比
陶惠林1,2,3,4,馮海寬1,3,4※,楊貴軍1,3,4,楊小冬1,3,4,苗夢珂1,3,4,5,吳智超1,3,4,5,翟麗婷1,3,4,5
(1. 農業農村部農業遙感機理與定量遙感重點實驗室,北京農業信息技術研究中心,北京 100097; 2. 安徽理工大學測繪學院,淮南 232001; 3. 國家農業信息化工程技術研究中心,北京 100097; 4. 北京市農業物聯網工程技術研究中心,北京 100097;5. 河南理工大學測繪與國土信息工程學院,焦作 454000)
作物產量準確估算在農業生產中具有重要意義。該文利用無人機獲取冬小麥挑旗期、開花期和灌漿期數碼影像和高光譜數據,并實測產量。首先利用無人機數碼影像和高光譜數據分別提取數碼影像指數和光譜參數,然后將數碼影像指數和光譜參數與冬小麥產量作相關性分析,挑選出相關性較好的9個指數和參數,最后以選取的數碼影像指數和光譜參數為建模因子,通過MLR(multiple linear regression,MLR)和RF(random forest,RF)對產量進行估算。結果表明:數碼影像指數和光譜參數與實測產量均有很強的相關性。利用數碼影像指數和光譜參數通過MLR和RF構建的產量估算模型均在灌漿期表現精度最高,在灌漿期,數碼影像指數和光譜參數構建的MLR模型2和NRMSE分別為0.71、12.79%,0.77、10.32%。對模型對比分析可知,以光譜參數為因子的MLR模型精度較高,更適合用于估算冬小麥產量。利用無人機遙感數據,通過光譜參數建立的MLR模型能夠快速、方便地對作物進行產量預測,并可以根據不同生育期的產量估算模型有效地對作物進行監測。
無人機;數碼影像;高光譜;冬小麥;產量;估算;多元線性回歸;隨機森林
0 引 言
在精準農業中,作物產量的準確監測對農業管理方面有著重要的意義[1-3]。通過衛星可以實現大范圍、大區域監測[4]。而對于小尺度作物的監測,由于衛星數據獲取時間長,受分辨率和氣象等多方面影響,所體現的作用不明顯[5-6]。無人機遙感具有較高的分辨率,操作便捷,能夠快速地進行觀測[7-10],相比衛星受限制條件少,在田間對作物進行監測能夠取得很好的效果。估算作物產量方面,根據平臺的不同,所獲取數據的方式各異,如利用衛星、無人機或地面獲取。國內外學者在作物產量估算方面做了大量研究,何亞娟等[11]根據SPOT衛星遙感數據通過甘蔗的葉面積指數(leaf area index,LAI)對甘蔗的產量進行了估算,并構建LAI-產量估算模型取得較好效果。朱婉雪等[12]利用無人機對冬小麥的3個生育期進行了觀測,通過最小二乘分析方法建立不同植被指數的產量估算模型,各指數構建的冬小麥估算模型中在灌漿期建模模型的效果最好,指數EVI2(enhanced vegetation index without a blue band,EVI2)建立的模型精度最高。Kefauver等[13]利用無人機RGB、多光譜、熱航空影像數據,多影像組合數據構建的多元線性模型可以對大麥產量進行有效估算。Mengmeng等[14]利用低空無人機圖像數據得到的9種植被指數構建了逐步回歸模型,表明小麥產量與可見帶差異植被指數、歸一化綠-藍差異指數、綠-紅比率指數和綠色植被指數相關。Gong等[15]通過無人機遙感數據,探究出歸一化差異植被指數能夠很好地對產量進行估算,估算的誤差小于13%。劉煥軍等[16]用航空高光譜數據,研究出通過光譜一階微分參數構建的產量預測模型精度優于以歸一化植被指數、優化土壤調節植被指數和二階微分構建的估產模型。吳瓊等[17]利用地面高光譜數據,驗證出多生育期的估測效果優于單個生育期。張松等[18]基于地面高光譜遙感數據將植被指數作為構建產量估算模型的因子,構建的估算模型孕穗期和抽穗期的精度較高,能夠很好地監測冬小麥產量。以上研究從不同數據獲取方式,不同分析方法等方面估算作物產量,但利用無人機數碼和高光譜數據估算作物產量并進行對比精度分析的研究還很少。本文通過無人機遙感平臺,利用無人機數碼與高光譜數據分別估算冬小麥產量,以數碼影像指數和光譜參數為建模因子,通過機器學習多元線性回歸(MLR)和隨機森林(RF)2種方法分別構建了基于無人機數碼和高光譜的冬小麥產量估算模型,探討2種遙感數據的估算精度、最優模型和最佳估算生育期。本研究提供了一種基于無人機遙感平臺的科學技術方法,以便農業管理者更好地監測作物產量。
1 材料與方法
1.1 研究區概況與試驗設計
試驗所在地位于北京市昌平區小湯山鎮國家精準農業研究示范基地,處溫榆河沖積平原和燕山、太行山支脈的結合地帶,地理坐標為40°00′~40°21′N,116°34′~117°00′E,在溫帶季風區,屬暖溫帶大陸性季風氣候,地勢平坦,土壤肥沃,多種植小麥、玉米等,研究區位置如圖1所示。
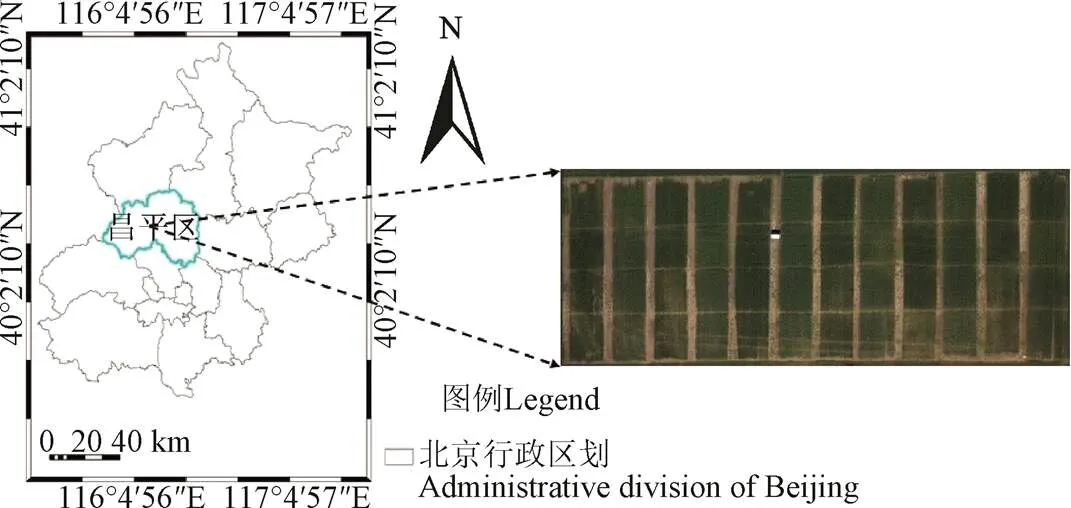
圖1 研究區位置
此次試驗在示范基地的田間進行,試驗田東西總長度為84 m,南北總長度為32 m,在冬小麥品種方面,選用了京9843(P1)和中麥175(P2)2個品種;在施肥肥料方面,不同類型處理的尿素施肥量分別為N1(不施用)、N2(195 kg/hm2)、N3(390 kg/hm2)和N4(585 kg/hm2);水分處理方面分別為W1(雨養)、W2(正常水,675 m3/hm2)和W3(1.5倍正常水,1 012.5 m3/hm2)3種方式處理。該試驗田16個小區,3次重復處理,并在不同時期進行監測,分別進行了3個不同生育期試驗,試驗田分布如圖2所示。
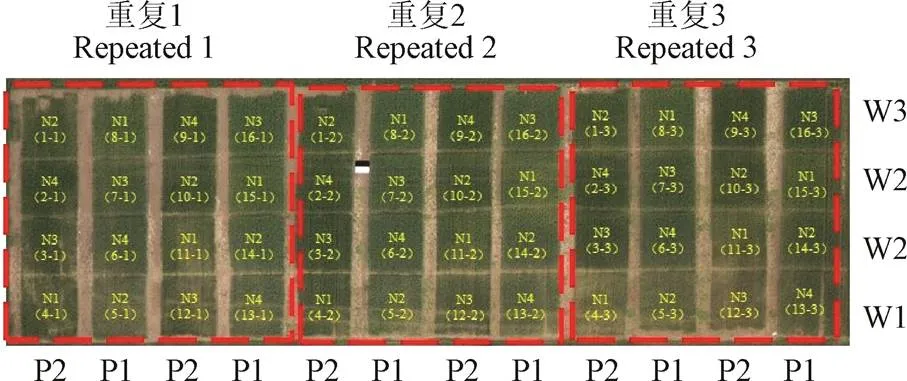
注:P是冬小麥品種,P1:京9843,P2: 中麥175;W是水分處理,W1、W2、W3分別為雨養、675、1 012.5 m3·hm-2;N為尿素施用,N1、N2、N3、N4分別為 0、195、390和585 kg·hm-2。
1.2 數據獲取及處理
1.2.1 地面數據獲取與處理
在冬小麥的成熟后,在每個試驗小區隨機取1 m2區域進行調查,通過收獲1 m2的籽粒并折算成14%含水率下的產量計算實測產量,共獲得48個小區的產量數據。
1.2.2 無人機數碼影像與高光譜數據獲取與處理
本次試驗采用了八旋翼無人機,機身凈質量4.2 kg,載物質量6 kg,單臂長386 mm,續航時間15~20 min,無人機獲取數據時要求天氣晴朗少云,時間在 10:00-14:00之間,飛行高度為80 m,攜帶的傳感器是數碼相機和成像光譜儀,其主要參數如表1所示,獲取的影像見圖3。分別在冬小麥的挑旗期(2015年4月26號)、開花期(5月13號)、灌漿期(5月22號)3個不同生育期進行數碼和高光譜影像數據獲取。
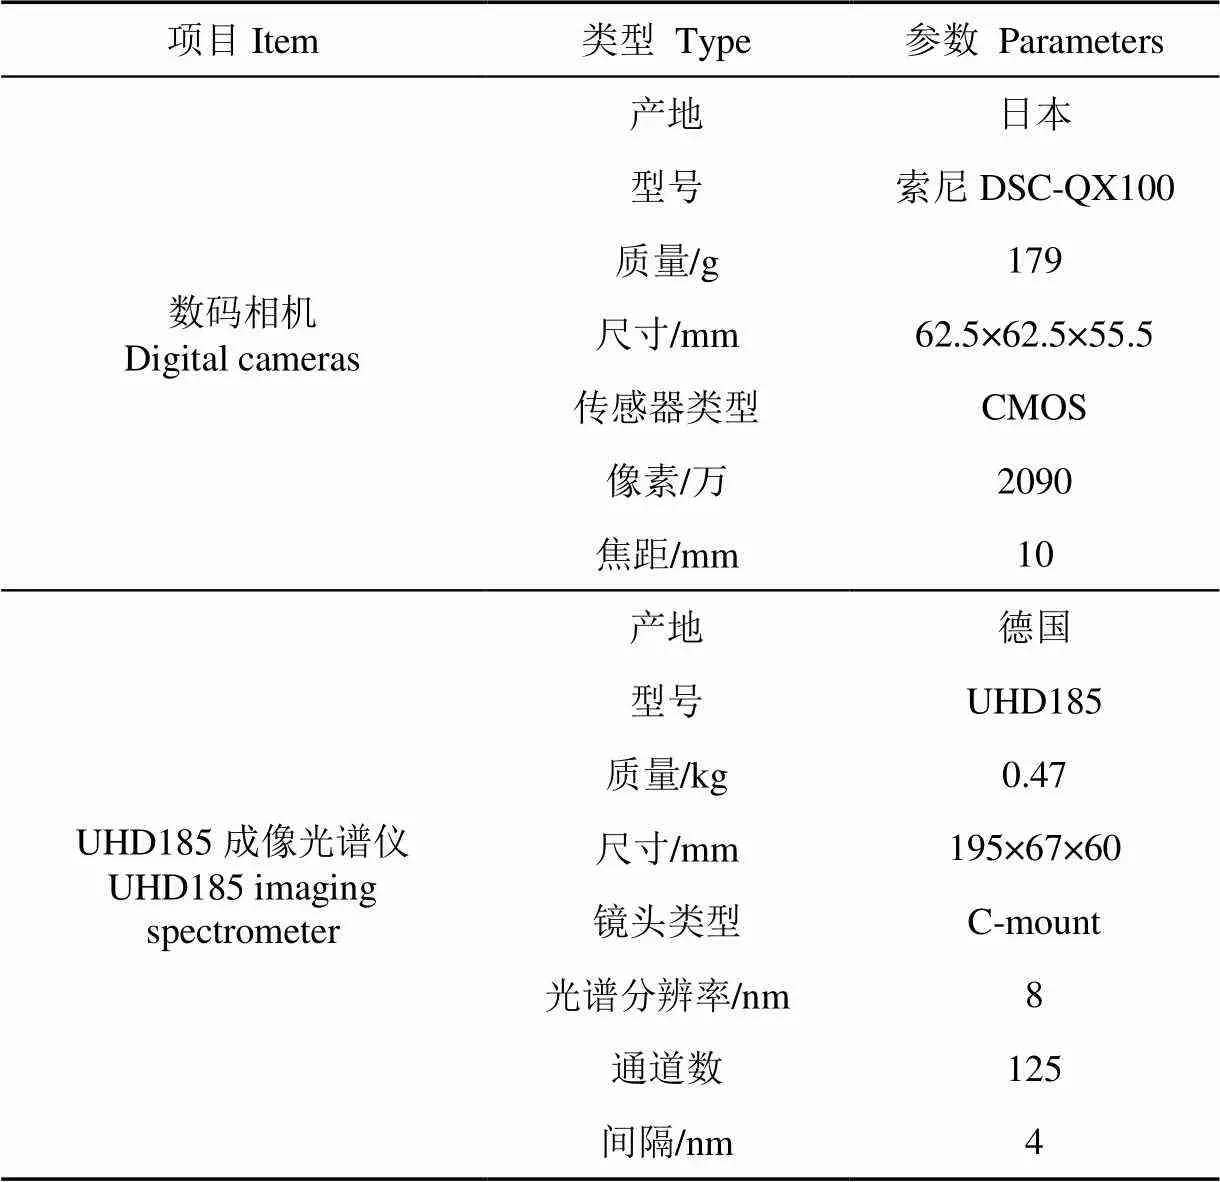
表1 數碼相機和UHD185成像光譜儀的主要參數
無人機數碼影像處理主要利用俄羅斯Agisoft LLC公司的Agisoft PhotoScan Professional軟件進行影像拼接處理,過程如下:1)將無人機數碼影像和飛行時的位置和姿態數據導入;2)生成密集點云;3)建立網格;4)生成空間紋理;5)生成冬小麥材料的無人機數碼高清正射影像。
無人機高光譜數據進行處理過程具體如下:
1)無人機高光譜影像校正和拼接。對于影像的校正,需要把無人機高光譜影像遙感影像像元亮度值DN(digital number,DN)值轉化為地表反射率,在進行影像拼接處理的時候借鑒Turner等[19]的研究成果,將獲取的影像和位置數據,利用UHD185自帶的處理軟件和俄羅斯Agisoft LLC公司的Agisoft PhotoScan 軟件進行影像拼接,經過影像的校正和拼接生成了挑旗期、開花期和灌漿期的高光譜正射影像,每個生育期的影像中有125個波段,每個波段間隔4 nm,波段范圍為454~950 nm。
2)提取光譜反射率。在進行反射率提取時,為了更好地控制區域矢量問題,過程主要在Arcgis軟件中完成,在軟件中根據每個小區的面積繪制出30個矢量,每個小區編號,繪制出的矢量面積總和等于每個小區的矢量面積,每個生育期影像有48個小區,得到1 440個矢量數據,再通過IDL程序對應小區編號計算出每個小區的光譜反射率的平均值,并以平均值為該小區的光譜反射率,獲取不同生育期的各小區光譜反射率。
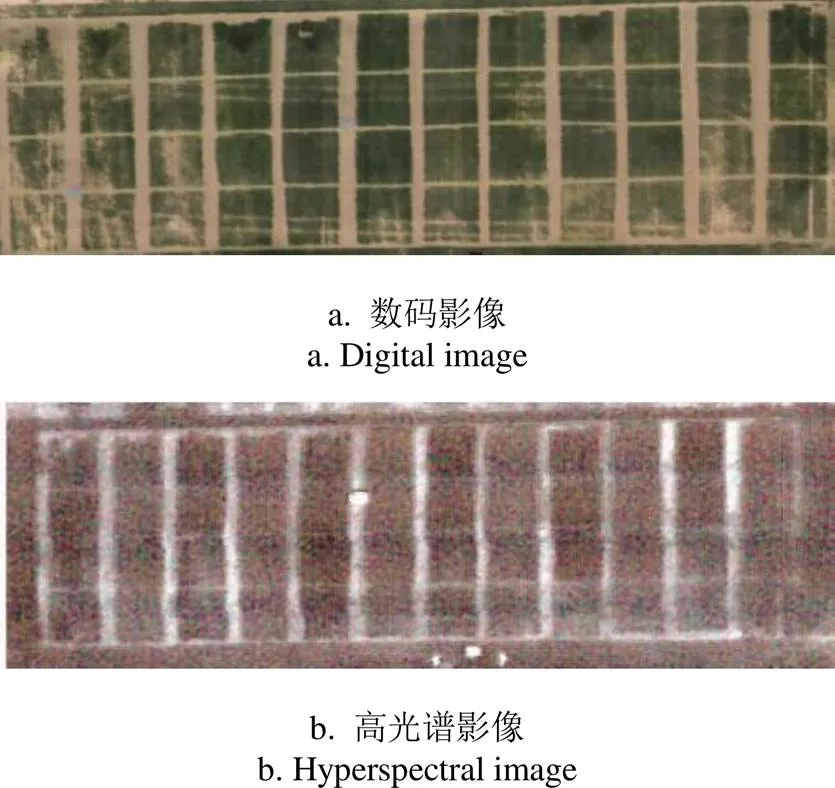
圖3 無人機數碼和高光譜影像
1.3 研究方法
1.3.1冬小麥估算模型
本文選取了多元線性回歸(multiple linear regression,MLR)和隨機森林(random forest,RF)2種分析方法,分別建立不同植被指數與冬小麥產量的估算模型,模型為常用的統計模型,MLR使用的前提是自變量和因變量有著很好的相關性,能夠通過多個自變量來預測因變量。 RF的算法是基于bootstrap取樣的一種機器學習算法,通過將樣本放回抽樣的方法進行多次取樣,建立決策樹模型,進行決策樹組合預測,分類效果越好,說明構建的模型精度越高。
1.3.2 數碼影像指數選取
利用生成的無人機數碼高清正射影像,綠色植物反射綠光和吸收紅和藍光的特征,從數碼高清正射影像中提取出冬小麥試驗田各小區的DN值,將影像中的紅、綠、藍光這3個通道的DN值進行歸一化處理,得到、、,計算公式見表2。
根據前人的研究成果,選取11種植被指數,加上紅綠藍以及歸一化后的數碼影像指數,總共17個數碼影像指數,用來對冬小麥的產量進行估算研究,具體如表2所示。
1.3.3 光譜參數選取
植被指數被廣泛應用于農業作物監測,本文根據前人的研究成果,選擇8個典型的高光譜植被指數。另外Aasen等[27]發現紅邊區域波段可以有效監測作物長勢,故文中挑選了4個紅邊參數,具體光譜參數如表3所示。
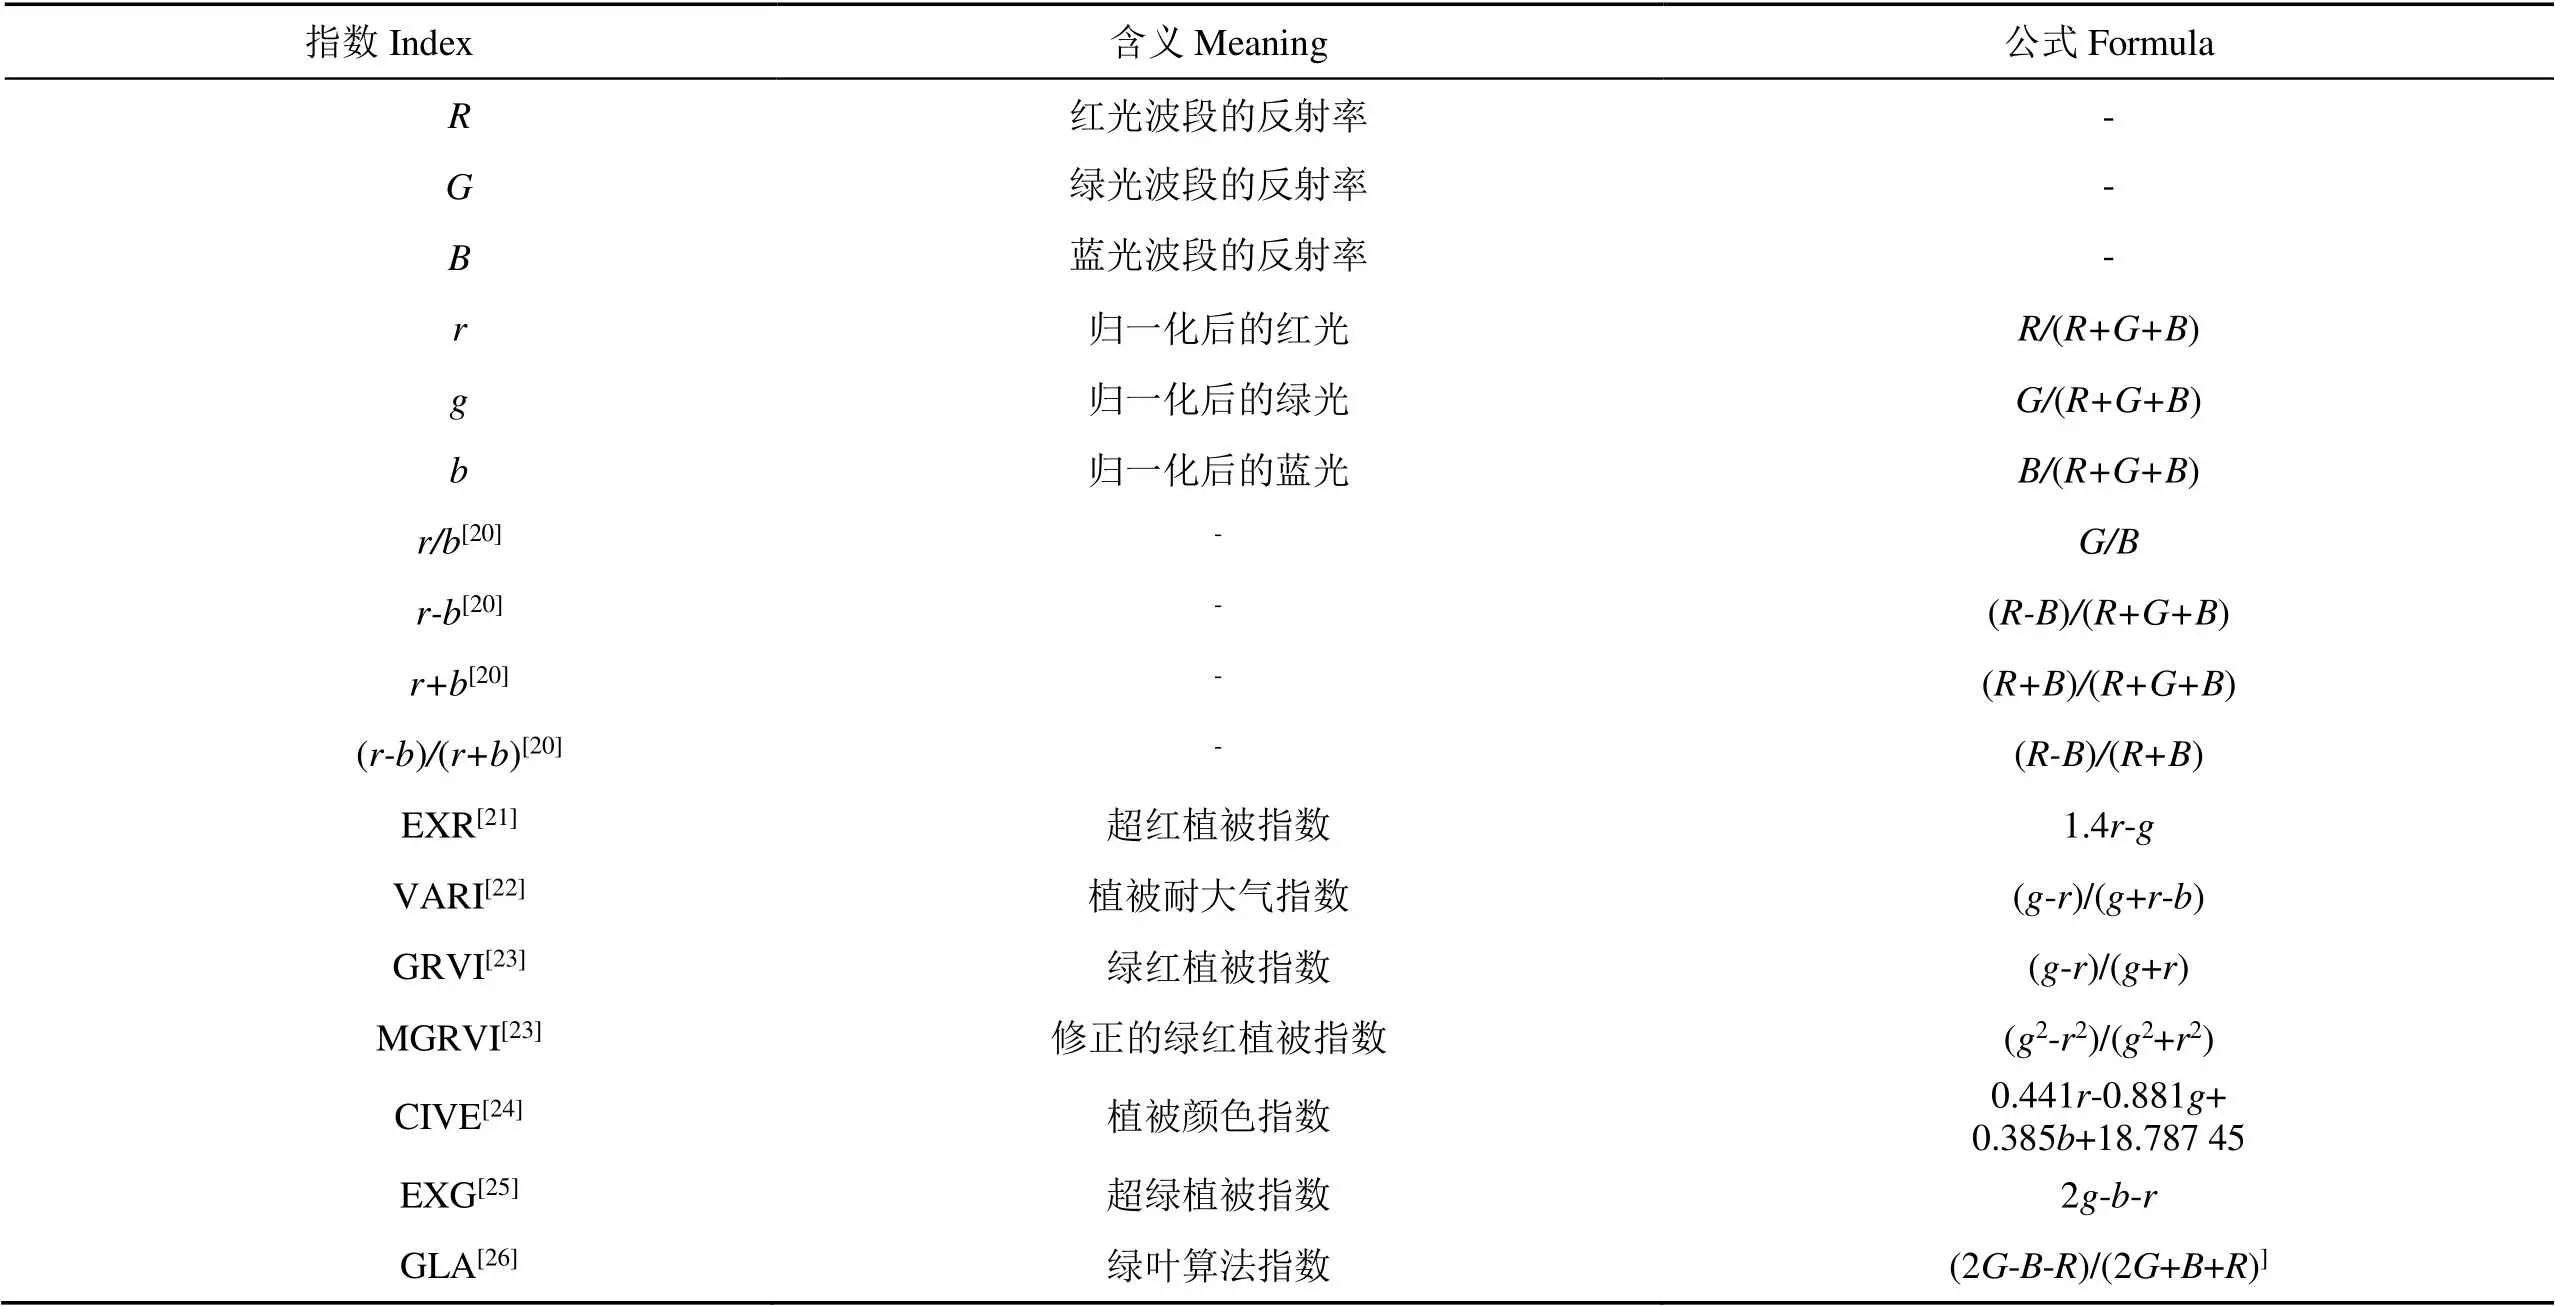
表2 數碼影像指數
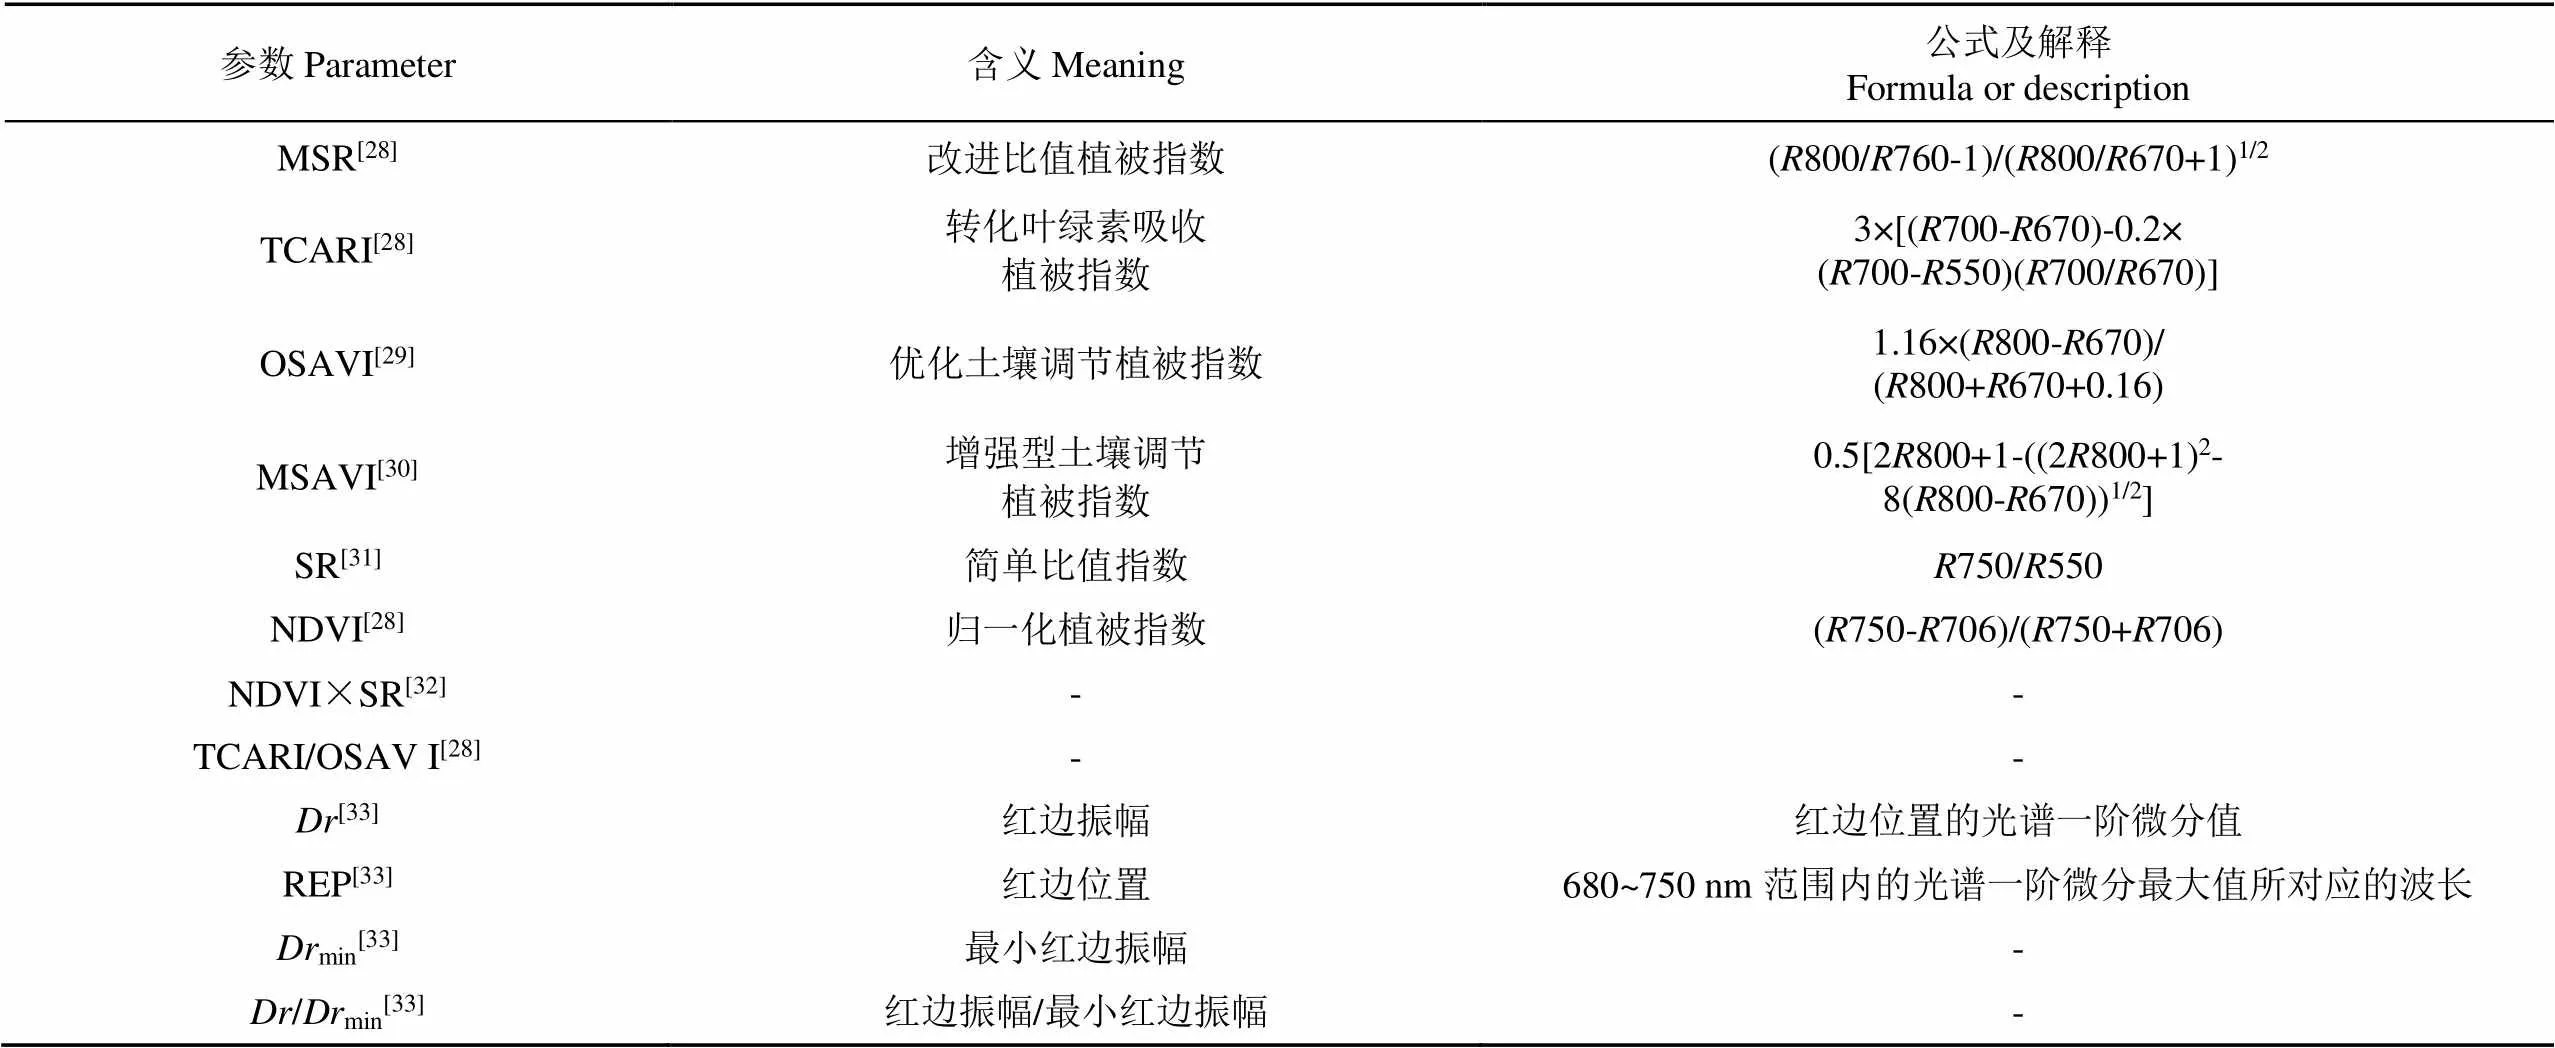
表3 光譜參數
1.3.4 模型精度驗證
文中根據冬小麥產量估算模型的構建,選取決定系數(coefficient of determination,2)、均方根誤差(root mean squared error,RMSE)和標準均方根誤差(normalized root mean squared error,NRMSE)3個指標作為模型精度的驗證。
2 結果與分析
2.1 無人機數碼影像指數和光譜參數與產量的相關性分析
將數碼影像指數和光譜參數與冬小麥實測產量數據進行相關性分析,結果見表4。
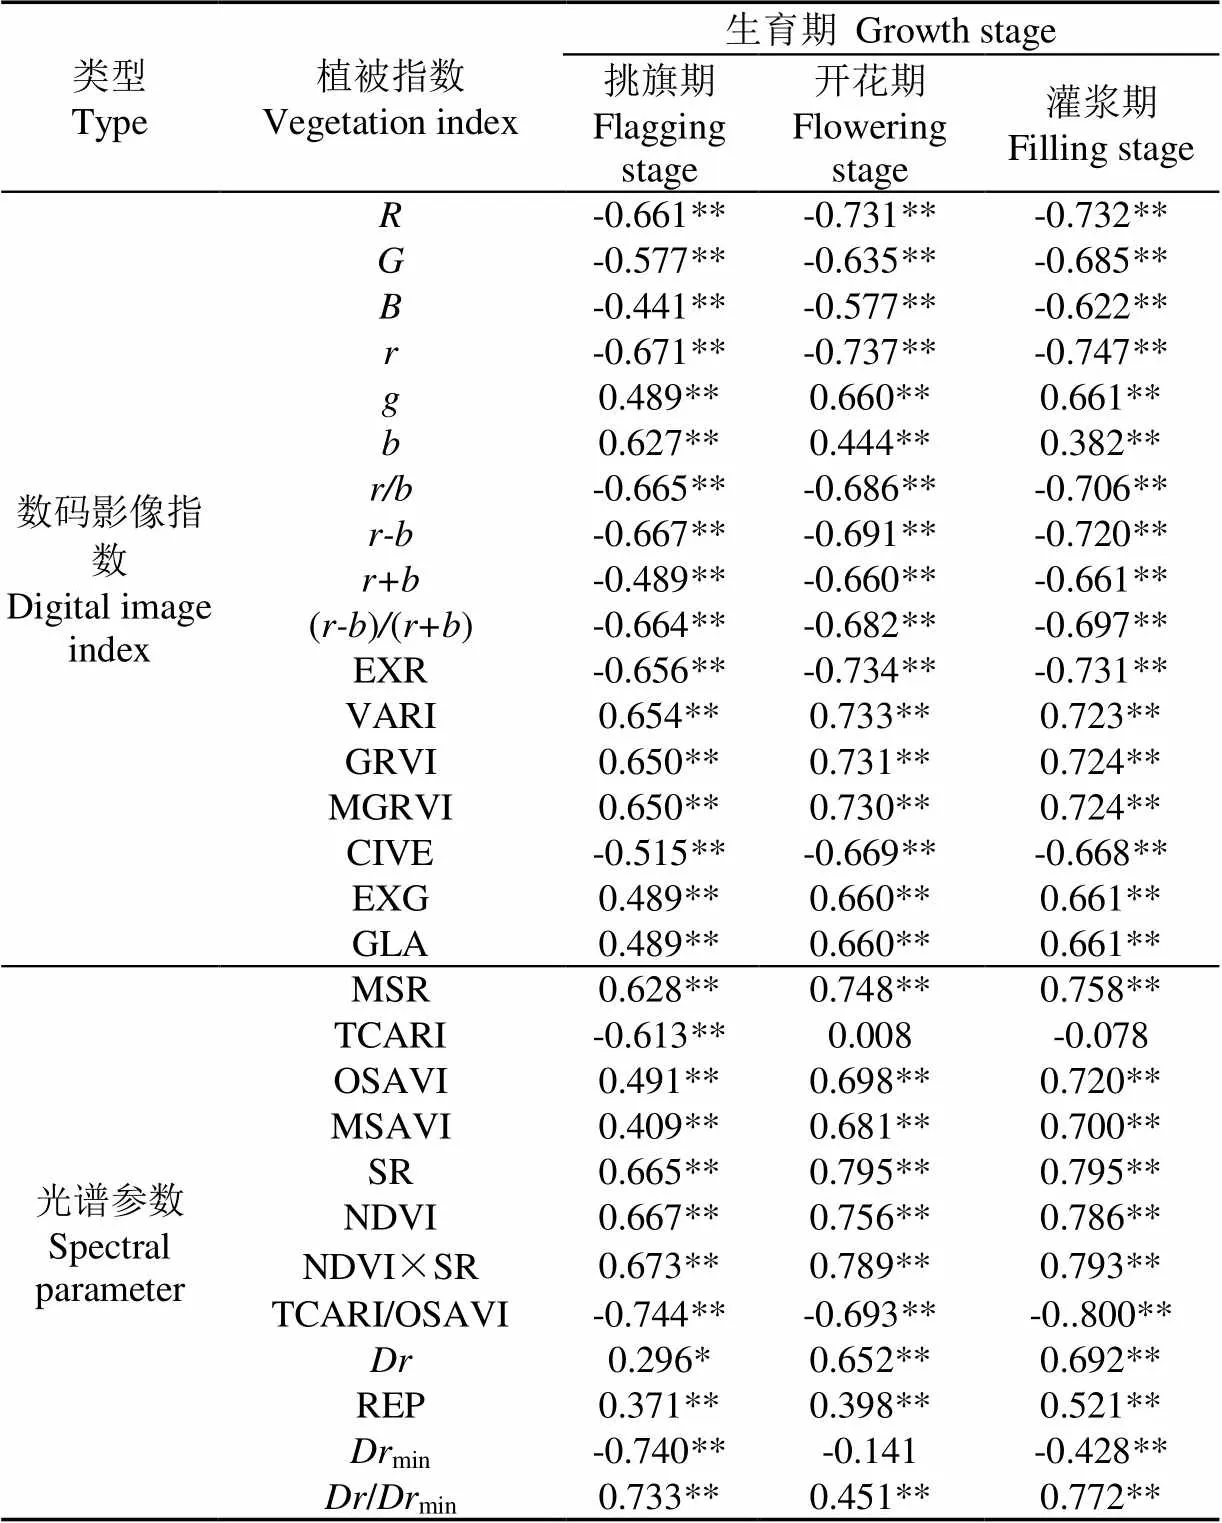
表4 無人機數碼影像指數和光譜參數與冬小麥實測產量相關性分析
注:*表示在0.05水平上顯著,**表示在0.01水平上顯著。
Note:*represents significant at 0.05 level, ** represents significant at 0.01 level.
從表4中可知,數碼影像指數與冬小麥實測產量均呈現極顯著相關(<0.01);光譜參數和冬小麥實測產量相關性大部分也達到極顯著水平。相比不同生育期,挑旗期的無人機數碼影像指數均與冬小麥實測產量呈現極顯著相關,其中指數的相關系數絕對值最大,為0.671;而光譜參數中,除光譜參數紅邊振幅表現顯著相關外,剩余的參數均表現出極顯著水平,相關性最好的是TCARI/OSAVI,相關系數為0.744;開花期,數碼影像指數與實測產量相關性均表現出極顯著相關,指數的相關性系數絕對值最大,為0.737;光譜參數中TCARI和最小振幅表現無顯著相關,其余的光譜參數都表現出極顯著相關,其中表現效果最好的是參數SR,相關系數是0.795;灌漿期,數碼影像指數與實測產量相關性均極顯著相關,相關性絕對值最高的指數為,為0.747;對于光譜參數而言,僅TCARI無顯著相關,其余參數均極顯著相關,表現最好的參數是TCARI/OSAVI,相關系數達到0.800。
2.2 基于無人機數碼影像數據的冬小麥產量估算精度分析和驗證
根據無人機數碼影像指數與冬小麥產量相關性分析結果,按相關性強弱,在不同的生育期和利用高光譜數據估算產量一樣分別挑選出9個相關系數較大的數碼影像指數,選取的數碼影像指數作為冬小麥產量估算模型的因子通過MLR和RF來構建模型,得到了挑旗期、開花期與灌漿期的MLR和RF模型的各評價指標,結果如表5所示。
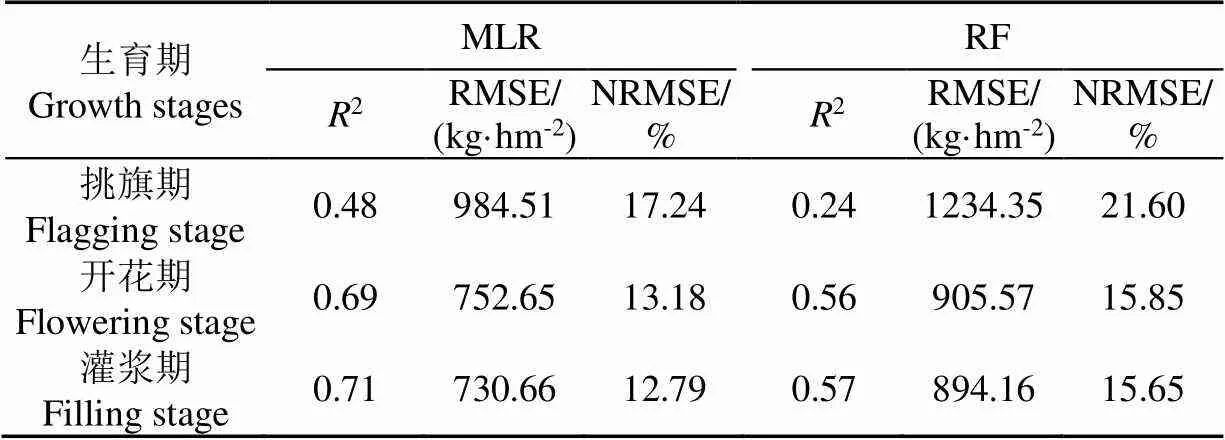
表5 建模集不同生育期的數碼影像指數估算冬小麥產量的精度分析
根據表5,MLR模型的精度在不同生育期均明顯優于RF模型,且2種模型的估算精度均表現為灌漿期最高,挑旗期最低。其中MLR模型最佳2是0.71(RMSE=730.66kg/hm2,NRMSE=12.79%),RF模型最佳2是0.57(RMSE=894.16kg/hm2,NRMSE=15.65%),說明MLR模型優勢較為明顯。
分別對冬小麥的3個生育期構建的產量估算模型進行驗證,獲得不同生育期的驗證分析結果,見圖4和圖5。MLR和RF模型驗證的估算效果和建模效果保持一致,從挑旗期到灌漿期,MLR和RF模型均表現效果逐漸增強,至灌漿期,達到最佳,MLR和RF驗證2分別是0.77、0.52,NRMSE分別達到13.56%、17.22%,驗證效果較好。
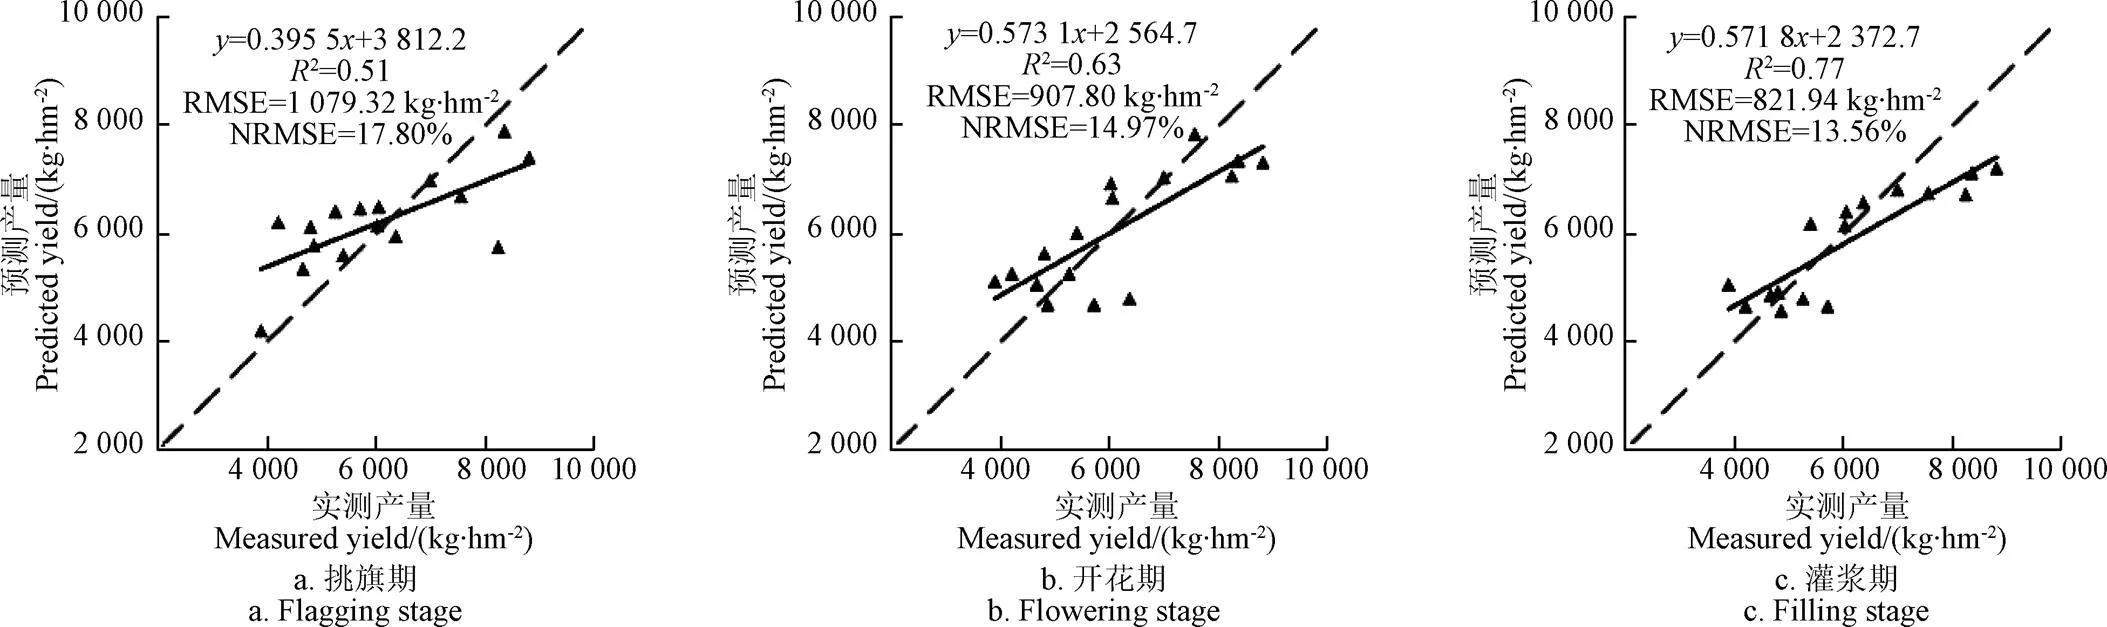
圖4 驗證集數碼影像的MLR方法預測產量與實測產量對比
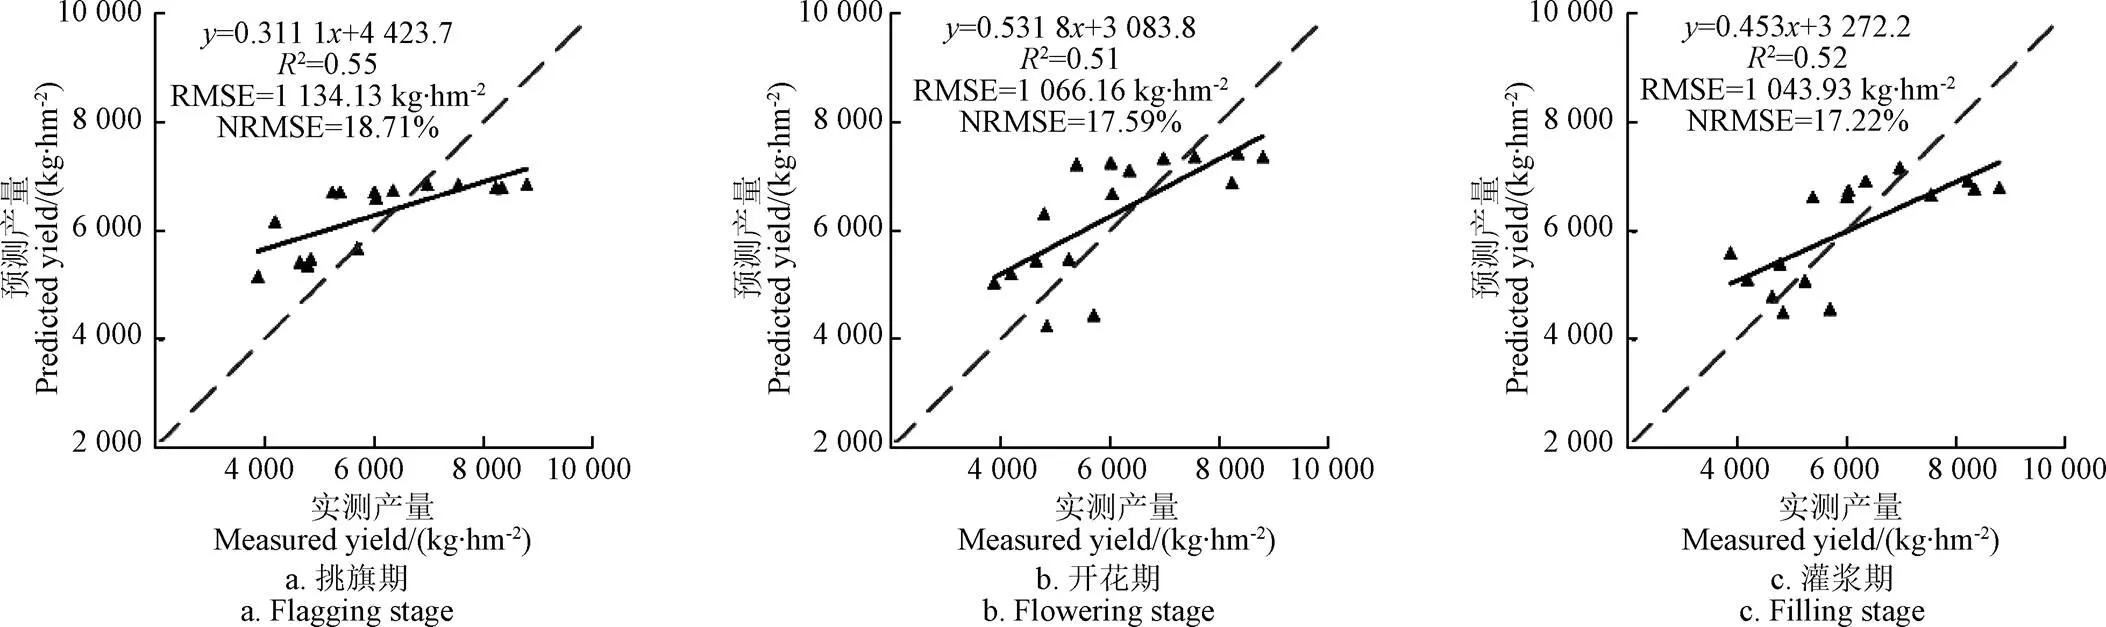
圖5 驗證集數碼影像的RF方法預測產量與實測產量對比
2.3 基于無人機高光譜數據的冬小麥產量估算精度分析和驗證
利用建模分析方法MLR和RF構建冬小麥挑旗期、開花期、和灌漿期的產量估算模型,根據光譜參數的相關性分析結果,挑選出相關性絕對值較大的前9個光譜參數作為估算冬小麥產量的自變量,保證了自變量中同時包含植被指數和紅邊參數。挑旗期、開花期和灌漿期取重復1和重復2區域數據,共32個樣本作建模集,結果如表6所示。
從表6可知,從挑旗期到灌漿期,對于MLR和RF模型,模型的估算精度逐漸提高,擬合效果越來越好,其中MLR模型最佳2是0.77,NRMSE是10.32%;RF模型最佳2是0.61,NRMSE是14.79%,MLR模型估算精度在不同生育期均優于RF模型。
為了驗證建模集估算效果,將重復3區域數據(16個樣本)進行模型驗證,結果見圖6和圖7。隨著生育期推移,驗證集2逐漸增大,RMSE和NRMSE逐漸減小,結果與建模集效果保持一致,說明驗證的效果比較穩定。另外,與數碼影像指數估算的結果一致,MLR和RF模型驗證精度也是灌漿期最高,開花期次之,挑旗期精度最低。
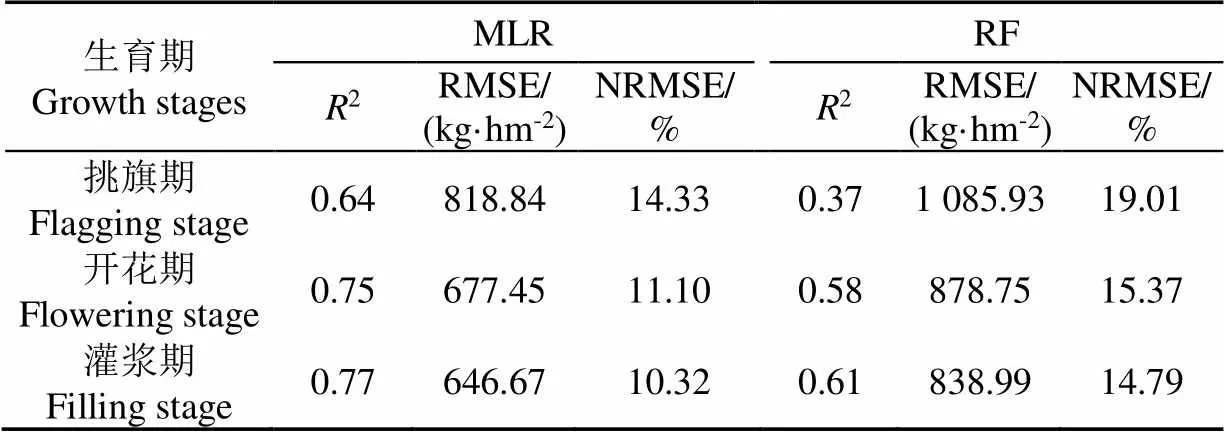
表6 建模集不同生育期的光譜參數估算冬小麥產量的精度分析
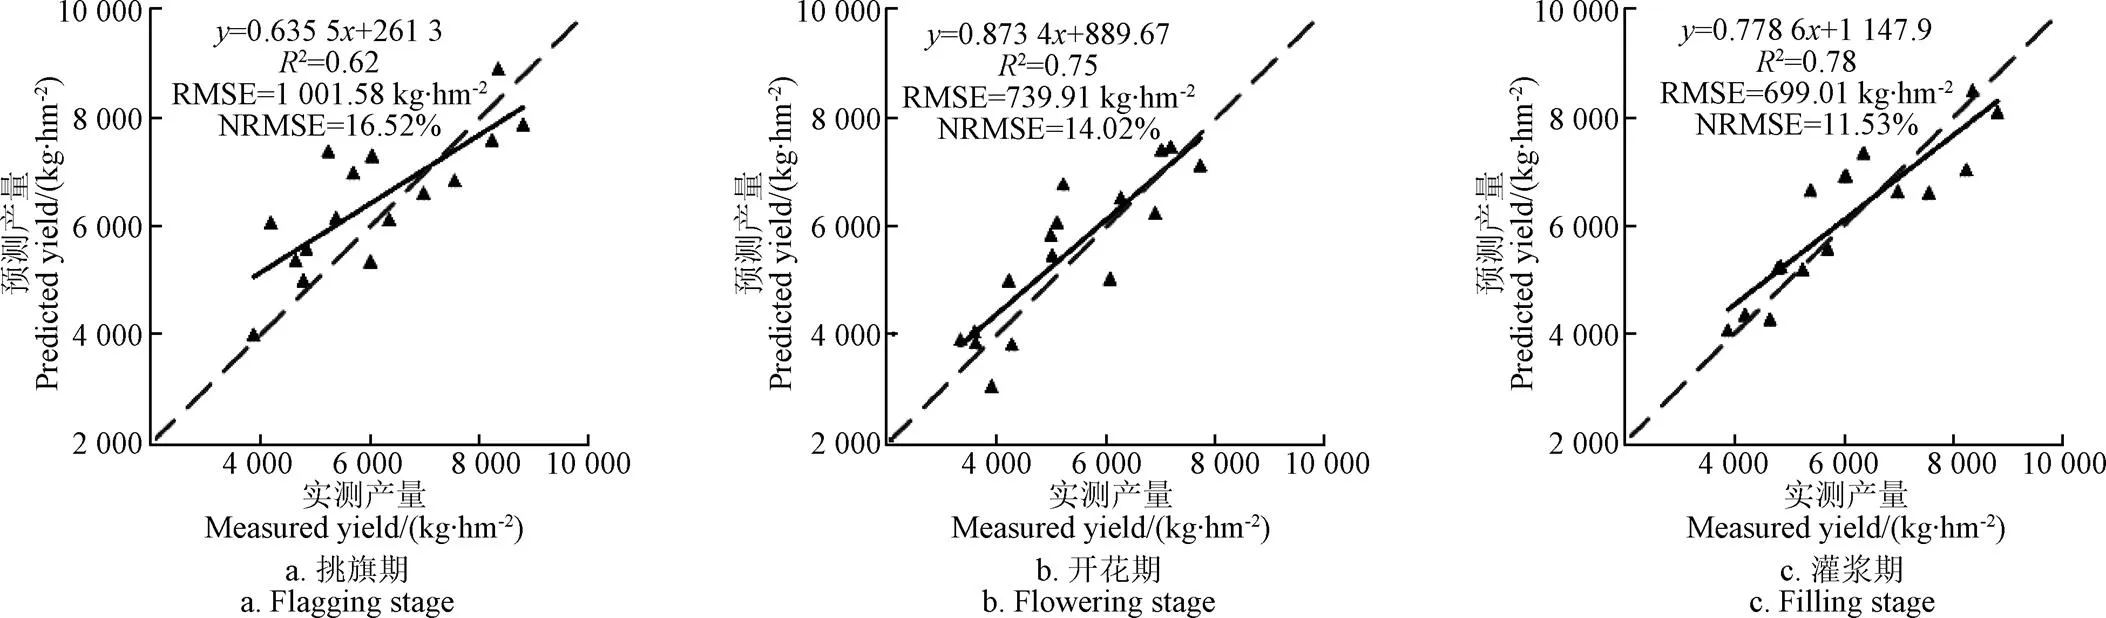
圖6 驗證集高光譜數據的MLR方法預測產量與實測產量對比
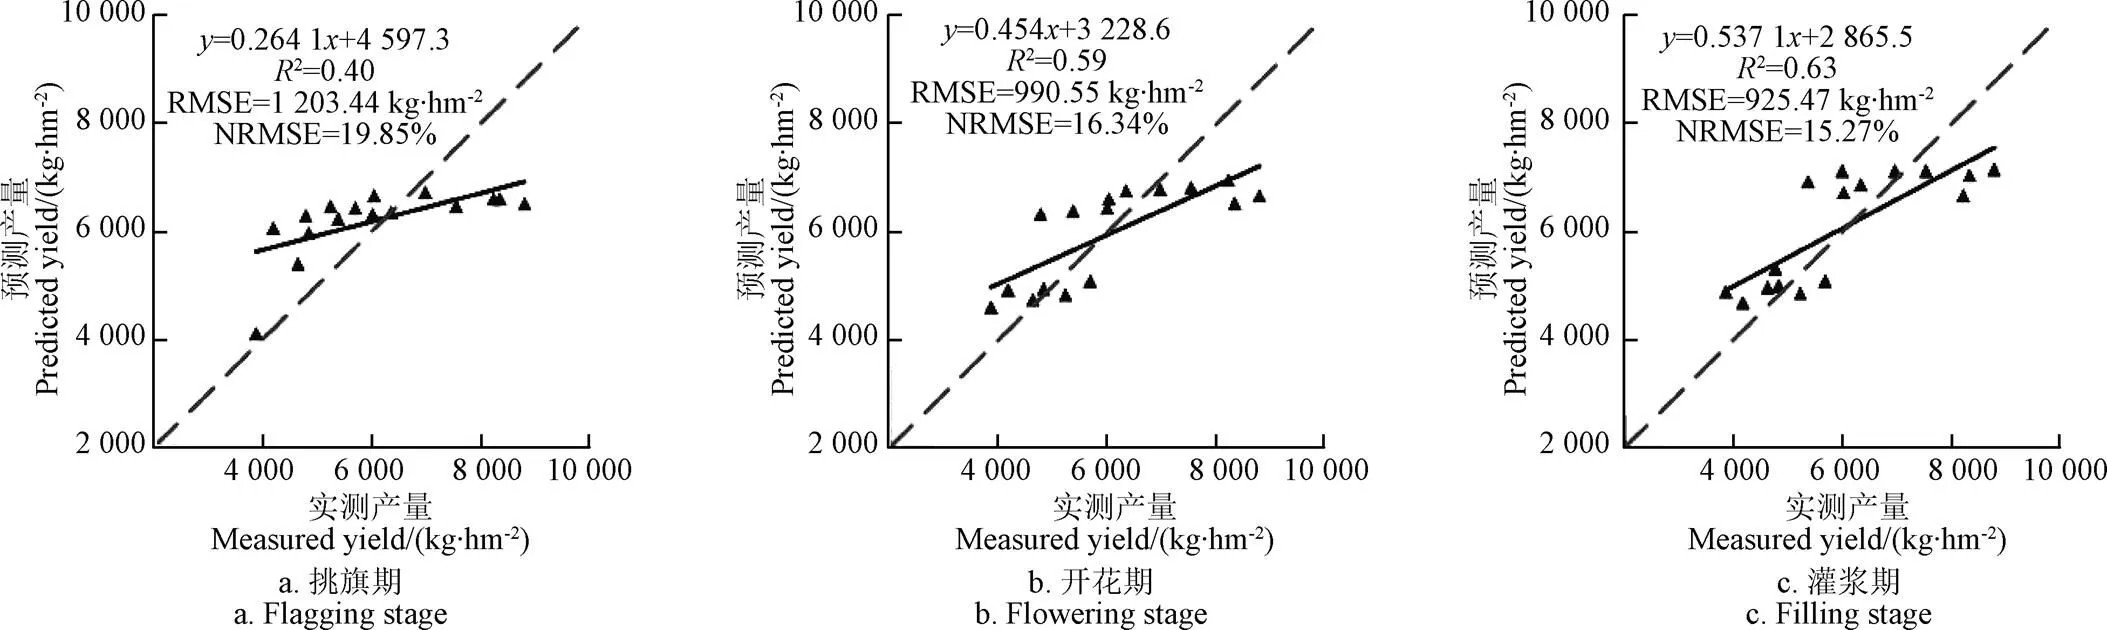
圖7 驗證集高光譜數據的RF方法預測產量與實測產量對比
2.4 精度對比
分別利用無人機數碼和高光譜影像數據對冬小麥產量進行估算,構建了基于2種遙感數據的冬小麥不同生育期的MLR和RF模型。利用相同方法,不同數據構建產量估算模型,基于無人機高光譜數據構建的產量模型效果均優于基于無人機數碼數據的模型,通過無人機高光譜和無人機數碼構建的最優模型建模2分別為0.77、0.71,RMSE分別646.67 kg/hm2、730.66 kg/hm2,NRMSE分別為10.32%、12.79%。對比不同方法建立的2種估算模型,相同數據下MLR構建的模型優于RF模型。基于無人機數碼影像構建的MLR與RF模型挑旗期2分別為0.48、0.24,NRMSE分別為17.24%,21.60%;開花期2分別是0.69、0.56,NRMSE分別為13.18%、 15.85%;灌漿期2分別為0.71、0.57,NRMSE分別為12.79%、15.65%。基于無人機高光譜數據構建的MLR與RF挑旗期2、NRMSE分別為0.64、14.33%,0.37、19.01%,開花期2、NRMSE分別是0.75、11.10%,0.58、15.37%,灌漿期2、NRMSE分別為0.77、10.32%,0.61、14.79%。綜合模型的評價指標和模型的適用性,MLR方法模型更適合產量估算,且利用無人機高光譜數據估算產量效果較好。
3 討 論
人工估產所進行的工作量大、過程繁瑣且很容易受到人為和其他因素的干擾。從而影響估算精度,利用無人機數碼影像和高光譜數據進行估算可以避免這些問題。數碼相機和高光譜的空間分辨率較高,在進行取樣時所取的大小為1 m2,區域內冬小麥的生長較為一致,數據具有代表性,然后在通過無人機數碼影像和高光譜數據進行產量估算。
所選取的數碼影像指數和光譜參數大部分都與冬小麥產量呈現極顯著相關(<0.01),在冬小麥不同生育期,數碼影像指數與光譜參數和產量相關性存在差異,這與不同生育期時波段敏感程度有關,挑旗期,波段敏感性不強,數碼影像指數和光譜參數的相關性絕對值較小,隨著冬小麥生長,開花期和灌漿期波段敏感性逐漸增強,與產量相關性絕對值逐漸變大,因此,數碼影像指數與光譜參數均與小麥產量有著較好的相關性。總體來說,小麥產量與灌漿期相關性最好,開花期其次,而挑旗期最差。
將數碼影像指數和光譜參數通過MLR和RF方法進行冬小麥產量估算,發現在不同時期模型的效果不同,模型精度最高的時期是灌漿期,精度最差的是挑旗期。從擬合性、一致性和精度來看,MLR模型效果均強于RF模型,模型精度表現為灌漿期高于開花期,開花期高于挑旗期,2種模型的估算結果和冬小麥生長規律較為一致,隨著生育期推移,越靠近生育期后期冬小麥的產量越趨于穩定,而此時進行估算的產量結果能夠很好地反映冬小麥的實測產量,所以在灌漿期構建冬小麥產量估算模型效果是最好的。
盡管數據源不同,但建立的估算模型均表現出模型MLR精度高于RF,這是由于RF適合數據較多的樣本,在樣本量少的情況下表現波動。另外,相比數碼相機,高光譜數據分辨率高,波段較多,能夠較全面地反映冬小麥信息,綜合來說,通過MLR方法以光譜參數為因子的估算模型較優。
估產過程中受土壤背景和陰影光譜的影響[12],直接通過單個植被指數估算產量,而不考慮不同生長期光譜影響,估產模型適用性不高[18]。另外,利用無人機數碼和高光譜估產,可以對比不同傳感器的估產性能,以便選取更合適的估產方式。冬小麥不同生長期光譜受影響大小不同,如何更好地利用植被指數消除外界因素干擾提高估產精度,需要進一步研究。另外,本文僅利用一年冬小麥數據分析,未來將針對長時間序列數據進行深入研究。
4 結 論
本文基于無人機數碼影像和高光譜數據對不同生育期冬小麥產量進行估算,研究結論如下:
針對不同生育期的數碼影像指數和光譜參數,模型MLR擬合性和精度均高于RF。就生育期而言,表現最好的均是灌漿期,基于光譜參數的MLR模型2、RMSE和NRMSE分別為0.77、646.67 kg/hm2、10.32%,RF模型的2、RMSE和NRMSE分別是0.61、838.99kg/hm2、14.79%;基于數碼影像指數的MLR模型2、RMSE和NRMSE分別是0.71、730.66kg/hm2、12.79%,而RF模型分別為0.57,894.16kg/hm2,15.65%。
[1] 任建強,陳仲新,唐華俊,等. 基于遙感信息與作物生長模型的區域作物單產模擬[J]. 農業工程學報,2011,27(8):257-264.
Ren Jianqiang, Chen Zhongxin, Tang Huajun, et al.Regional crop yield simulation based on crop growth model and remote sensing data[J]. Transactions of the Chinese Society of Agricultural Engineering (Transactions of the CSAE), 2011, 27(8): 257-264. (in Chinese with English abstract)
[2] Mueller N D, Gerber J S, Johnston M, et al. Closing yield gaps through nutrient and water management[J]. Nature, 2012, 490(7419): 254-257.
[3] Neumann K, Verburg P H, Stehfest E , et al. The yield gap of global grain production: A spatial analysis[J]. Agricultural Systems, 2010, 103(5): 316-326.
[4] Du M, Noguchi N. Multi-temporal monitoring of wheat growth through correlation analysis of satellite images, unmanned aerial vehicle images with ground variable[J]. IFAC PapersOnLine, 2016, 49(16): 5-9.
[5] 蘇偉,侯寧,李琪,等. 基于Sentinel-2遙感影像的玉米冠層葉面積指數反演[J]. 農業機械學報,2018,49(1):151-156.
Su Wei, Hou Ning, Li Qi, et al. Retrieving leaf area index of corn canopy based on sentinel-2 remote sensing image[J]. Transactions of the Chinese Society for Agricultural Machinery, 2018, 49(1): 151-156.(in Chinese with English abstract)
[6] Yu N, Li L, Schmitz N, et al. Development of methods to improve soybean yield estimation and predict plant maturity with an unmanned aerial vehicle based platform[J]. Remote Sensing of Environment, 2016(187): 91-101.
[7] 張春蘭,楊貴軍,李賀麗,等. 基于隨機森林算法的冬小麥葉面積指數遙感反演研究[J]. 中國農業科學,2018,51(5):855-867.
Zhang Chunlan, Yang Guijun, Li Heli, et al.Remote sensing inversion of leaf area index of winter wheat based on random forest algorithm[J]. Scientia Agricultura Sinica, 2018, 51(5): 855-867. (in Chinese with English abstract)
[8] Yue Jibo, Feng Haikuan, Jin Xiuliang, et al. A comparison of crop parameters estimation using images from UAV-mounted snapshot hyperspectral sensor and high-defifinition digital camera[J]. Remote Sensing, 2018(10): 1138-1162.
[9] 常瀟月,常慶瑞,王曉凡,等. 基于無人機高光譜影像玉米葉綠素含量估算[J]. 干旱地區農業研究,2019,37(1):66-73.
Chang Xiaoyue, Chang Qingrui, Wang Xiaofan, et al.Estimation of maize leaf chlorophyll contents based on UAV hyperspectral drone image[J]. Agricultural Research in the Arid Areas. 2019, 37(1): 66-73. (in Chinese with English abstract)
[10] Watanabe K, Guo W, Arai K, et al. High-throughput phenotyping of sorghum plant height using an unmanned aerial vehicle and its application to genomic prediction modeling[J]. Frontiers in Plant Science, 2017, 8:421-432.
[11] 何亞娟,潘學標,裴志遠,等. 基于SPOT遙感數據的甘蔗葉面積指數反演和產量估算[J]. 農業機械學報,2013,44(5):226-231.
He Yajuan, Pan Xuebiao, Pei Zhiyuan, et al. Estimation of LAI and yield of sugarcane based on SPOT remote sensing data[J]. Transactions of the Chinese Society for Agricultural Machinery, 2013, 44(5): 226-231. (in Chinese with English abstract)
[12] 朱婉雪,李仕冀,張旭博,等. 基于無人機遙感植被指數優選的田塊尺度冬小麥估產[J]. 農業工程學報,2018,34(11):78-86.
Zhu Wanxue, Li Shiji, Zhang Xubo, et al. Estimation of winter wheat yield using optimal vegetation indices from unmanned aerial vehicle remote sensing[J]. Transactions of the Chinese Society of Agricultural Engineering (Transactions of the CSAE), 2018, 34(11): 78-86. (in Chinese with English abstract)
[13] Kefauver S C, Vicente, Vergara-Díaz O, et al. Comparative UAV and field phenotyping to assess yield and nitrogen use efficiency in hybrid and conventional barley[J]. Frontiers in Plant Science, 2017, 8 : 1733-1748.
[14] Mengmeng D, Noboru N. Monitoring of wheat growth status and mapping of wheat yield’s within-field spatial variations using color images acquired from UAV-camera system[J]. Remote Sensing, 2017, 9(3): 289-303.
[15] Gong Yan, Duan Bo, Fang Shenghui, et al. Remote estimation of rapeseed yield with unmanned aerial vehicle (UAV) imaging and spectral mixture analysis[J]. Plant Methods, 2018, 14(1): 1-14.
[16] 劉煥軍,康苒,Ustin S,等. 基于時間序列高光譜遙感影像的田塊尺度作物產量預測[J]. 光譜學與光譜分析,2016,36(8):2585-2589.
Liu Huanjun, Kang Ran,Ustin S, et al.Study on the prediction of cotton yield within field scale with time series hyperspectral imagery[J]. Spectroscopy and Spectral Analysis, 2016, 36(8): 2585-2589. (in Chinese with English abstract)
[17] 吳瓊,齊波,趙團結,等. 高光譜遙感估測大豆冠層生長和籽粒產量的探討[J]. 作物學報,2013,39(2):309-318.
Wu Qiong, Qi Bo, Zhao Tuanjie, et al.A tentative study on utilization of canopy hyperspectral reflectance to esti-mate canopy growth and seed yield in soybean[J]. Acta Agronomica Sinica, 2013, 39(2): 309-318. (in Chinese with English abstract)
[18] 張松,馮美臣,楊武德,等. 基于高光譜植被指數的冬小麥產量監測[J]. 山西農業科學,2018,46(4):572-575.
Zhang Song, Feng Meichen, Yang Wude, et al.Monitoring of winter wheat yield based on hyperspectral vegetation index[J]. Shanxi Agricultural Science, 2018, 46(4): 572-575. (in Chinese with English abstract)
[19] Turner D, Lucieer A, Wallace L. Direct georeferencing of ultrahigh-resolution UAV imagery[J]. IEEE Transactions on Geoscience and Remote Sensing, 2014, 52(5): 2738-2745.
[20] 何彩蓮,鄭順林,萬年鑫,等. 馬鈴薯光譜及數字圖像特征參數對氮素水平的響應及其應用[J]. 光譜學與光譜分析,2016,36(9):2930-2936.
He Cailian, Zheng Shunlin, Wan Nianxin, et al. Potato spectrum and the digital image feature parameters on the response of the nitrogen level and its application[J]. Spectroscopy and Spectral Analysis, 2016, 36(9): 2930-2936. (in Chinese with English abstract)
[21] Zhou X, Zheng H, Xu X Q, et al. Predicting grain yield in rice using multi-temporal vegetation indices from UAV-based multispectral and digital imagery[J]. Isprs Journal of Photogrammetry & Remote Sensing, 2017(130):246-255.
[22] Gitelson A A, Kaufman Y J, Stark R, et al. Novel algorithms for remote estimation of vegetation fraction[J]. Remote Sensing of Environment, 2002, 80(1): 76-87.
[23] Bendig J, Yu K, Aasen H, et al. Combining UAV-based plant height from crop surface models, visible, and near infrared vegetation indices for biomass monitoring in barley[J]. International Journal of Applied Earth Observation & Geoinformation, 2015(39): 79-87.
[24] Kataoka T, Kaneko T, Okamoto H, et al. Crop growth estimation system using machine vision[C] IEEE/ASME International Conference on Advanced Intelligent Mechatronics, Aim, 2003: 1079-1083.
[25] Torres-Sánchez J, Pena J M, De Castro A, et al. Multi-temporal mapping of the vegetation fraction in early-season wheat fields using images from UAV[J]. Computers and Electronics in Agriculture, 2014(103): 104-113.
[26] Francesco C,Leonardo D,Donatella G, et al. Estimation of canopy attributes in beech forests using true colour digital images from a small fixed-wing UAV[J]. International Journal of Applied Earth Observation and Geoinformation, 2016(47): 60-68.
[27] Aasen H, Burkart A, Bolten A, et al. Generating 3D hyperspectral information with lightweight UAV snapshot cameras for vegetation monitoring: From camera calibration to quality assurance[J]. ISPRS Journal of Photogrammetry and Remote Sensing, 2015,108: 245-259.
[28] Chaoyang W, Zheng N, Quan T, et al. Estimating chlorophyll content from hyperspectral vegetation indices: Modeling and validation[J]. Agricultural and Forest Meteorology, 2008, 148(8/9): 1230-1241.
[29] Aparicio N, Villegas D, Araus J L, et al. Relationship between growth traits and spectral vegetation indices in durum wheat[J]. Crop Science Madison, 2002, 42: 1547-1555.
[30] Qi J, Chehbouni A, Huete AR, et al. A modified soil adjusted vegetation index[J]. Remote Sensing of Environment, 1994, 48(2): 119-126.
[31] Baret F, Guyot G , Major D J. TSAVI: A vegetation index which minimizes soil brightness effects on LAI and APAR estimation[C]12th Canadian Symposium on Remote Sensing Geoscience and Remote Sensing Symposium. 1989: 1355-1358.
[32] Gong P, Pu R, Biging G S, et al. Estimation of forest leaf area index using vegetation indices derived from hyperion hyperspectral data[J]. IEEE Transactions on Geoscience and Remote Sensing, 2003, 41(6): 1355-1362.
[33] 馮偉,朱艷,姚霞,等. 利用紅邊特征參數監測小麥葉片氮素積累狀況[J]. 農業工程學報,2009,25(11):194-201.
Feng Wei, Zhu Yan, Yao Xia, et al. Monitoring nitrogen accumulation in wheat leaf with red edge characteristics parameters[J]. Transactions of the Chinese Society of Agricultural Engineering (Transactions of the CSAE), 2009, 25(11): 194-201. (in Chinese with English abstract)
Comparison of winter wheat yields estimated with UAV digital image and hyperspectral data
Tao Huilin1,2,3,4, Feng Haikuan1,3,4※, Yang Guijun1,3,4, Yang Xiaodong1,3,4, Miao Mengke1,3,4,5, Wu Zhichao1,3,4,5, Zhai Liting1,3,4,5
(1.100097,; 2.,232001,; 3.100097,; 4.100097,; 5.454000,)
Accurate estimation of crops yield is of great significance in agricultural production and has a strong guiding significance for agricultural managers. It is necessary to use an effective technical means to estimate the yield of field crops quickly and accurately. Taking winter wheat in Xiaotangshan National Precision Agricultural Research Demonstration Base as the research object, this study compared the performance of unmanned aerial vehicle (UAV) digital image and hyperspectral data in winter wheat yield estimation. The field surveys and campaigns were conducted in three typical winter wheat growth stages including flagging, flowering and filling stages. The digital images and hyperspectral data were respectively acquired by digital camera and Cubert UHD 185 Firefly imaging spectrometer, which were mounted on a UAV platform. The wheat yield data were collected during harvest. Firstly, the typical digital image indices and hyperspectral parameters were extracted from UAV digital image and hyperspectral data, respectively. Then the correlation analyses between wheat measured yield and digital image indices and hyperspectral parameters were carried out. Nine digital image indices and hyperspectral parameters with high correlation were selected for each growth stages, respectively. The selected digital image indices and hyperspectral parameters were used as modeling factors and the yield were estimated bymultiple linear regression (MLR) and random forest (RF), and the models constructed by the two remote sensing data were compared to optimize the remote sensing data and model. The results showed that the digital image indices and hyperspectral parameters had significant correlation with the wheat measured yield. Among them, the correlation of the best index of different growth stages was the reflectance of the red and the best hyperspectral parameter of the three growth stages were transformed chlorophyll absorption reflectance index optimized soil adjusted vegetation index (TCARI/OSAVI), simple ratio vegetation (SR), and TCARI/OSAVI, respectively. Through the digital image indices, analyzing the effect of the modeling set, the accuracy of the MLR model was significantly better than the RF model in different growth stages,and the estimation accuracy of the two models was the highest during the filling stage and the lowest during the flagging stage.The best2of the MLR model was 0.71 (RMSE = 730.66 kg/hm2, NRMSE = 12.79%), and the best2of the RF model was 0.57 (RMSE = 894.16 kg/hm2, NRMSE = 15.65%), indicating that the advantages of the MLR model were more obvious.MLR and RF model verification effect and modeling effect remain the same. The performance of MLR and RF models had gradually increased to the filling stage to achieve the best. NRMSE reached 13.56% and 17.22%, respectively.The yield effect was estimated based on the spectral index. For MLR and RF models, the accuracy of model modeling was gradually improved, and the fitting effect was getting better and better. Among them,the best2of the MLR model was 0.77 and the NRMSE was 10.32%; the best2of the MLR model was 0.61, NRMSE was 14.79%, the estimation accuracy of MLR model was better than RF model in different growth stages.As the growth stage progresses, the verification2gradually increased, and RMSE and NRMSE gradually decreased. This result was consistent with the effect of the modeling set, indicating that the validation effect was relatively stable. So using UAV hyperspectral remote sensing data, the estimation model of winter wheat yield established by the MLR method can quickly and easily predict the yield of crops, and can effectively monitor the growth of crops and the performance of yield estimation models in different growth stages.
UAV; digital image; hyperspectral; winter wheat; yield; estimation; partial least squares; random forest
陶惠林,馮海寬,楊貴軍,楊小冬,苗夢珂,吳智超,翟麗婷. 基于無人機數碼影像和高光譜數據的冬小麥產量估算對比[J]. 農業工程學報,2019,35(23):111-118.doi:10.11975/j.issn.1002-6819.2019.23.014 http://www.tcsae.org
Tao Huilin, Feng Haikuan, Yang Guijun, Yang Xiaodong, Miao Mengke, Wu Zhichao, Zhai Liting. Comparison of winter wheat yields estimated with UAV digital image and hyperspectral data[J]. Transactions of the Chinese Society of Agricultural Engineering (Transactions of the CSAE), 2019, 35(23): 111-118. (in Chinese with English abstract) doi:10.11975/j.issn.1002-6819.2019.23.014 http://www.tcsae.org
2019-07-18
2019-10-24
國家自然科學基金(41601346,41871333)
陶惠林,主要從事農業定量遙感研究。Email:15755515505@163.com
馮海寬,助理研究員,主要從事農業定量遙感研究。Email:fenghaikuan123@163.com
10.11975/j.issn.1002-6819.2019.23.014
S252
A
1002-6819(2019)-23-0111-08
猜你喜歡
童話王國·奇妙邏輯推理(2024年5期)2024-06-19 16:03:38
礦山安全信息(2022年40期)2022-04-07 02:16:52
今日農業(2021年14期)2021-11-25 23:57:29
石油與天然氣地質(2021年1期)2021-02-22 14:14:44
中學生數理化·七年級數學人教版(2020年10期)2020-11-26 08:24:50
今日農業(2020年20期)2020-11-26 06:09:10
數學物理學報(2020年2期)2020-06-02 11:29:24
中國果業信息(2019年10期)2019-11-13 01:21:34
聚氯乙烯(2018年9期)2018-02-18 01:11:34
光學精密工程(2016年6期)2016-11-07 09:07:19