CFx-Ru 復合陰極材料的制備及在鋰一次電池中的應用
2020-02-11 09:00:02張伶瀟張麗娟希利德格
無機化學學報 2020年1期
張伶瀟 張麗娟 希利德格 李 釩
(北京市綠色催化與分離重點實驗室,環(huán)境與能源工程學院化學與化學工程系,環(huán)境安全和生物效應卓越中心,北京工業(yè)大學,北京 100124)
0 Introduction
In recent years, secondary batteries have attracted much attention due to the application of electric vehicles and portable electronic device[1-4]. However,with the development of military weapons, implantable medical devices, defence tools and aerospace devices,primary batteries with high energy density and high power density are indispensable[5-8]. Among various primary batteries, Li/CFxbatteries are one of the promising owing to their high theoretical specific energy (2 180 Wh·kg-1), high theoretical specific capacity (865 mAh·g-1), wide operating temperature range (-40~170 ℃), high open circuit voltage (3.0~3.2 V), long storage life and good safety performance[9-13].Unfortunately, Li/CFxbattery has a strong polarization,low voltage platform and poor high rate performance in the process of discharge, which is mainly from the poor electronic conductivity of CFxmaterials[14-17]. These unfavourable factors have limited the application and development of Li/CFxbatteries in nowadays society.
In order to solve these problems, many researchers have been carrying out different methods to improve the electronic conductivity of CFx. The usual ways are covering with the conductive carbon layer or conductive polymer to enhance the electrochemical performance of CFxmaterials. Zhang et al.[18]obtained the carbon-coated CFxby a heat treatment of a mixture of CFxand polyvinyl difluoride (PVDF). The specific discharge capacity of carbon-coated CFxwas 370 mAh·g-1at 2C, while that of uncoated CFxwas 260 mAh·g-1at the same rate. The coating carbon improved the connectivity of particles and facilitated the construction of electronic channels, thus accelerating the diffusion of lithium ions and electron transport. Li et al.[19]prepared the polyaniline-coated CFx(x=1) (CFx@PANI) with different thicknesses by using an in situ chemical oxidative polymerization method at 0 ℃. The CFx@PANI had a discharge specific capacity of 843 mAh·g-1at 0.1C. In particular, the discharge rate of CFx@PANI could reach up to 8C, which was much higher than that of pristine CFx. The improved electrochemical performance of the coated CFxmaterials came from the better conductivity of the polyaniline layer. Adding electrode materials with excellent conductivity such as MnO2[20], Ag2V4O11[21],LiV3O8[22]and MoO3[23]to CFxis a very effective method to improve the conductivity of cathode materials. For example, CFx∥MnO2exhibited the energy density of 1 814 Wh·kg-1and the power density of 6 599 W·kg-1at 5C[20], respectively. Another way to improve the electrochemical performance of CFxmaterials is to prepare sub-fluorinated graphite. Sun et al. synthesized a fluorographene (FG) material by solvothermal exfoliation of F-graphite with acetonitrile and chloroform.The exfoliated FG showed a high power density of 4 038 W·kg-1at 3C, which was much higher than that of F-graphite[24].Other methods such as acid treatment,alkali treatment or ball milling also achieved better performance[25-27].
In this work, we prepared CFx-Ru materials for the first time by a simple in-situ chemical modification.The introduction of Ru via the interaction between RuO2and CF2improved the conductivity of the material. Meanwhile, the reduction of inactive CF2on the surface of CFxis beneficial to the diffusion of lithium ions. Compared with the pristine CFx, CFx-Ru has a great improvement in specific capacity, energy density and discharge potential. This simple method provides a new way to solve the low rate performance of carbon fluoride materials.
1 Experimental
1.1 Synthesis of samples
CFx-Ru composites were prepared by a simple method of in situ modification. The preparation process was shown in Fig.1a.Firstly,0.3 g CFx(x=0.71,Products fluorinated carbon, FLUOROCHEMICAL CO., LTD)was dispersed in mixture of water/ethanol (1∶1, V∶V,30 mL) and stirred at room temperature for 30 min.0.019 g RuCl3·xH2O was added into the CFxsuspension. Then, 0.1 mol·L-1NaOH was dropped into the solution to keep the pH value at 8~9 and stirred at room temperature for 6 h. After the precipitation process,the mixture was filtered through a microporous membrane and washed thoroughly with deionized water and ethanol. Afterward, the mixture was dried overnight at 80 ℃. Finally, the mixture was treated at 450 ℃under N2flow for 3 h to obtain the CFx-Ru composites (Fig.1a). For comparison, samples were also prepared through the same steps as above except in the addition of pristine CFx, which was illustrated by Fig.1b (The latter XRD results confirmed that it was RuO2).
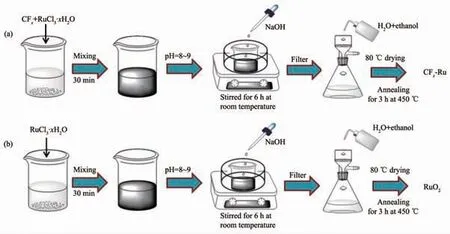
Fig.1 Schematic illustration for preparation of CFx-Ru (a) and RuO2(b) samples
1.2 Characterization
The phases were characterized by X-ray diffraction analysis (XRD, Bruker D8 Advance Diffractometer with Cu Kα radiation, λ=0.154 nm, target voltage was 40 kV, target current was 40 mA, scan speed was 0.5°·min-1, step size was 0.02°, and intensity data were collected within 2θ range of 10°~80°). The morphology and composition of the samples were characterized by scanning electron microscope (SEM) and energy dispersive X-ray spectroscopic (EDX) analysis on a Hitachi S-3400N. The chemical structure and element valence of pristine CFxand CFx-Ru were measured by X-ray photoelectron spectroscopy (XPS, Kratos Analytical Ltd, Axis Ultra). Thermo gravimetric analysis(TGA) was performed using a TG/DTA6300 thermal analyzer between 25 and 500 ℃with a heating rate of 5 ℃·min-1under N2flow. The specific surface area of samples was measured on a Brunauer-Emmett-Teller(BET, ASIQ COR 100-3).
1.3 Electrochemical test
Electrochemical properties of the samples were measured with CR2032 coin cells, which were assembled inside a NEWARE glove box (volume fraction of H2O <5×10⁻⁷, volume fraction of O2<5×10⁻⁷). For discharge performance testing, metal lithium as the anode, whatman glass fibre filter as separator and LiPF6in EC-DMC (1 ∶1, w/w) was used as electrolyte. The cathode electrode was synthesized through the following steps. The active material (80%(w/w)), the acetylene black (10% (w/w)) and the polyvinyl difluoride (PVDF, 10%(w/w)) were mixed and stirred in the N-methyl-2-pyrrolidone to form a uniform black slurry. The slurry was spread evenly on an Al foil and then dried at 80 ℃for 12 h. The coated Al foil was cut into discs with a diameter of 14 mm and the discs were dried in vacuum at 120 ℃for 24 h. Finally, the electrode was subjected to a constant current discharge test at a room temperature with a cut-off voltage of 1.5 V and different rates. The electrochemical impedance spectroscopy (EIS) data was obtained on an electrochemical working station(VMP3, Bio-Logic SA) at a frequency range of 100 kHz~10 MHz with 5 mV amplitude.
2 Results and discussion
2.1 Material characterization
Fig.2a showed the XRD patterns of pristine CFxand CFx-Ru, respectively. It was evident that the three typical wide peaks corresponding to the CFxphases at around 13.4°, 25.7° and 41.2°. The peak at around 25.7° could be assigned to the (002) reflection of graphite phases, which indicated a kind of layered type structure of pristine CFx[28-30]. The peak at about 2θ value of 13.4° could be indexed in a hexagonal system to the (001) reflection particularly for compounds with higher fluorine content[28,31-32]. The peak at 41.2° could be assigned to the (100) reflection, which was related to the plane length of the C-C bond in the reticular system[33-35]. The similar diffraction peaks at 2θ values of 13.4°, 25.7° and 41.2° had also appeared for CFx-Ru and thus indicated that the incorporation of Ru didnt change the structure of the pristine CFx.In addition, the diffraction peak of Ru could be clearly observed in the XRD pattern of CFx-Ru. As shown in Fig.2b, in the case where all other experimental conditions are the same except adding CFxwe got RuO2phase instead of elemental Ru. From this we inferred that CFxreacted with the modified materials to form metallic Ru and the reaction mechanism will be further studied.
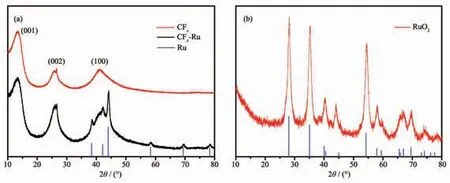
Fig.2 XRD patterns of (a) CFx, CFx-Ru and (b) RuO2

Fig.3 Photos and SEM images of (a, b) pristine CFx and (c, d) CFx-Ru
Fig.3 showed the morphology images of the pristine CFxand CFx-Ru samples. As shown in Fig.3a,the colour of the pristine CFxwas light gray, which indicated that the precursor has been highly fluorinated. After calcination with Ru-containning precursor the CFx-Ru samples turned into bright black(Fig.3c), which might relate with the decrease of F content in the materials. Fig.3b showed the typical layered structure of pristine CFxwith particle sizes in the range of 1~10 μm. Compared to the pristine CFx,the modified CFxmaterial (Fig.3d) was still a layered stacked structure and showed a clearer image. In addition, the morphology of the modified CFxexhibited more cracks like limestone, which would facilitate diffusion of lithium ion. However, Ru particles were not found in Fig.3d because of the sizes of Ru particles were very tiny. The existence of Ru in the modified material was also confirmed by energy dispersive X-ray spectroscopy (EDS) mapping (Fig.4)besides XRD results aforementioned. The C, F and Ru elements could be observed from the EDS elemental distribution map, further indicating that we had successfully prepared CFx-Ru materials. TEM images shown in Fig.5 gave a more intuitive distribution of Ru particles. It could be seen that the fine Ru nanoparticles were dispersed on the CFxsupport.However, the red areas in the Fig.5 showed that the Ru particles behaved with a slight agglomeration on the surface and edges of the CFxmaterial.
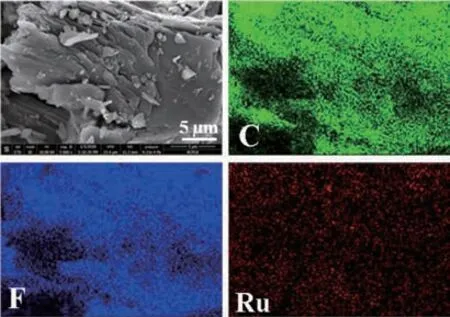
Fig.4 EDS mappings of the modified sample CFx-Ru
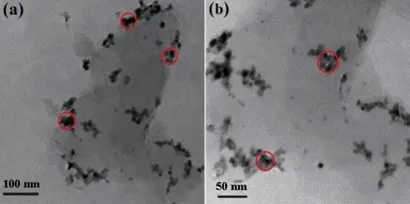
Fig.5 TEM images of CFx-Ru
X-ray photoelectron spectroscopy (XPS), known as electron spectroscopy for chemical analysis (ESCA),was used for a semi-quantitative analysis technique of surface chemical properties of materials. From the above results we concluded that certain functional groups on the surface of CFxappear to react with the modified material. In order to explored the reaction mechanism, we performed XPS analysis on the materials before and after modification. Fig.6a showed the detailed elemental composition information acquired from the XPS survey spectra. Compared with the pristine CFxsample, the modified material showed extra Ru signal besides C and F. From the Ru3d XPS spectrum in Fig.6b, two peaks at 280.34 and 284.51 eV ascribed to Ru3d5/2and Ru3d3/2could be found,which meant that the Ru on the surface of modified material had the same chemical environment as elementary Ru[36]while the binding energy of Ru3d5/2in RuO2was 281 eV[37].Fig.6c and 6d showed that the F1s peaks were located at 688.53 and 688.41 eV,respectively for pristine CFxand modified CFx. The small shift towards lower binding energy for C-F revealed a change in the chemical environment of the F atoms, which reflected that the parts of the covalent C-F bonds were transformed into a semi-ionic bond after modification of Ru[38]. Fig.6e and 6f showed the C1s peaks of pristine and modified CFx. The peaks around 286.5 and 284.80 eV were due to sp3C-C bonds and sp2C=C bonds[39-40]and peaks around 291.4 and 289.6 eV ascribed to C-F2bonds and C-F bonds,respectively[39,41-42]. The peak area ratio of C-F2to C-F for pristine CFxwas estimated at 0.4 while only 0.24 for CFx-Ru, namely 40%(n/n) loss after modification,which meant reduction of C-F2inactive group. The ratios of F to C were calculated too, and the detailed results were shown in Table 1. It was very clear that the ratio of F to C of the modified CFxwas decreased compared with that of pristine CFx(from 1.15 to 1).
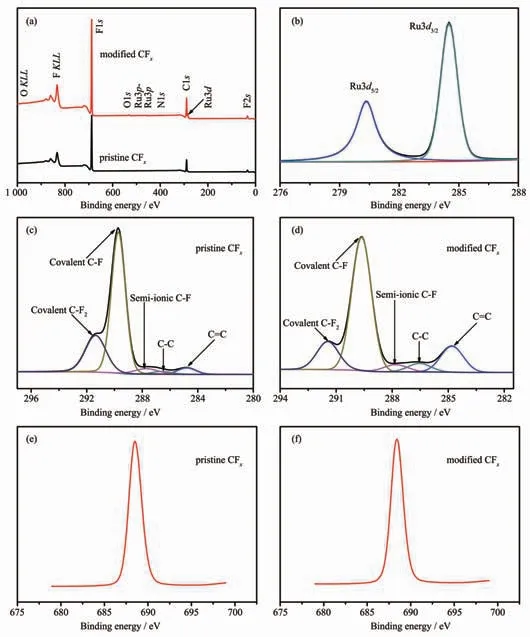
Fig.6 XPS spectra: (a) survey spectra, (b) Ru3d, (c, d) C1s and (e, f) F1s

Table 1 Peak locations (eV) and assignments for CFx and CFx-Ru
Fig.7 showed the TGA curves of pristine CFxand CFx-Ru composites, which were performed in N2atmosphere with a heating rate of 5 ℃·min-1. In addition,all samples were heated to 450 ℃and kept in 450 ℃for 3 h. As shown in Fig.7, it can be obviously observed that the pristine CFxexhibited a weight loss of 11.31%(w/w) at around 450 ℃, resulted from the evaporation of fluorocarbons during the thermal decomposition process, such as C2F4[43-44]. Interestingly,the TGA curve of CFx-Ru sample showed a weight loss of 17.84%(w/w) at around 450 ℃, which was higher than that of pristine CFx. According to the literature reports[45-47], Ru complexes, as a kind of effective defluorination reagents, could reduce the activation energy barrier of C-F bond and activate C-F bond.Combined with the XRD and XPS results, we concluded that RuO2reacted with CF2distributed on the edges or surfaces of CFxduring the calcination.This reaction consumed CF2and produced elemental germanium, which maked the modified material exhibited a lower fluorocarbon ratio and greater weight loss. This process could be described by Equation (1):

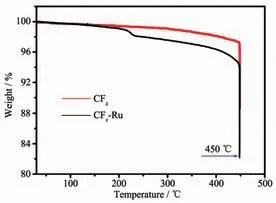
Fig.7 TGA curves of CFx and CFx-Ru recorded at 5 ℃·min-1 under nitrogen
Generally, the surface structure and pore size distribution of materials had an important influence on the physicochemical properties, and the surface area and pore size might change during the modification.Therefore, The BET specific surface area and pore size distribution of all samples were studied by nitrogen adsorption techniques and the results were shown in Fig.8 and Table 2. Fig.8 showed the mesoporous characteristics of CFxand CFx-Ru. The pore size of the modified CFxwas slightly larger than that of pristine CFx(Fig.8a and 8c), which might be due to the cracks generated on the surface of the CFx-Ru.This result was consistent with the images of SEM.The corresponding typical Ⅳisotherms of before and after Ru modification were shown in Fig.8b and 8d,and the specific surface areas of 257 and 353 m2·g-1,respectively for the CFxand CFx-Ru, calculated from the isotherm were displayed in Table 2. The larger specific surface area could effectively improve the contact area between the electrode material and the electrolyte, which was favourable for the diffusion of lithium ions and increased the lithium storage capacity of the material.
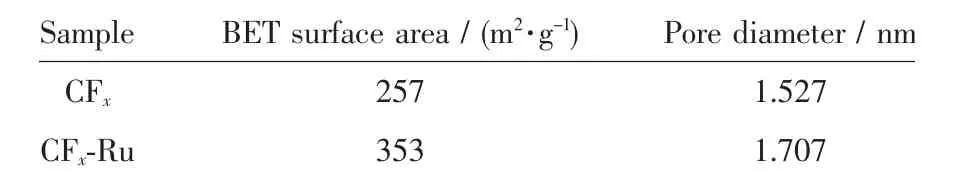
Table 2 Surface area of CFx and CFx-Ru
2.2 Electrochemical performance test

Fig.8 BJH pore size distribution of (a) pristine CFx and (c) CFx-Ru; N2 adsorption-desorption isotherms of (b) pristine CFx and (d) CFx-Ru

Fig.9 Galvanostatic discharge curves of (a) CFx and (b) CFx-Ru; (c) Average potential as a function of discharge rate and (d) the Ragone plot of the pristine CFx and CFx-Ru composites
The electrochemical performances of both pristine CFxand CFx-Ru composites electrodes were evaluated against Li in standard CR2032 type coin cells.Fig.9a and 9b showed the galvanostatic discharge curves of the pristine CFxand CFx-Ru composites at different current rates from 0.05C to 5C. As shown in Fig.9a, the specific capacity of pristine CFxwas 665 mAh·g-1at 0.05 C and 611 mAh g-1at 0.5C. Even at a 1C rate only a marginal attenuation was obviously seen in the discharge capacity and voltage platform.However, a drastic decrease happened at a 5C rate with a capacity of only 217 mAh·g-1. Compared with the pristine material, CFx-Ru composites exhibited higher rate capability and its discharge capacity was 693 mAh·g-1at 0.05C and 669 mAh·g-1at 0.5C,respectively.The specific capacity and voltage platform of the CFx-Ru composites had been significantly improved compared to those of pristine CFx. A capacity up to 605 mAh·g-1at a rate of 5C had been obtained. The excellent electrochemical performance of CFx-Ru composites might benefit from the following aspects. First, the increase of semi-ionic C-F bonds and the deposition of Ru on the surface of pristine CFximproved the conductivity of the cathode material during modification process. Secondly, CF2on the surface of CFxwas considered to be an inactive group which hindered the diffusion of lithium ions[27].The reduction of the CF2content was beneficial to solve the transmission disorder of lithium ions, thereby contributed to the improvement of the rate performance and capacity performance of the material. Thirdly, the larger specific surface of the CFx-Ru composites could provide more electrochemically active sites, and thus resulted in better electrochemical performance.
Fig.9c displayed the change of average discharge potential with C-rate both for the pristine CFxand CFx-Ru composites. It was obvious that the average potential of pristine CFxdeclined drastically as increasing discharge rate, and its average potential was only 1.7 V at a discharge rate of 5C. Compared with pristine CFx, the CFx-Ru composites revealed a higher average potential of 2.5 V at 0.05C and of up to 2 V even at a rate of 5C. In order to depict the electrochemical performance of the pristine CFxand modifed CFx, the energy and power densities displayed in the Ragone plot (Fig.9d). It could be observed that the energy density decreased with the increasing of power density.The calculated maximum energy densities were 1 575 and 1 697 Wh·kg-1for the pristine CFxand modifed CFxat 0.05C, respectively. Compared with the CFx-Ru composites, the energy density decreased seriously with the increase of discharge rate for pristine CFxdue to the decline of the discharge capacity and average potential. The pristine CFxshowed energy and power densities were 371 Wh·kg-1and 7 418 W·kg-1at the rate of 5C, respectively,while the corresponding values of 1 197 Wh·kg-1and 8727 W·kg-1could be achieved for CFx-Ru.
EIS technology was applied to further investigate the effect of Ru modification on the electrochemical performance of CFxmaterials. Fig.10a showed the Nyquist plot, and the inset indicated the equivalent circuit used to fit the impedance data. As shown in Fig.10a, the EIS curve of each sample was composed of a slanted straight line in the low frequency region and a depressed semicircle in the high frequency region. The semicircle represented the charge transfer resistance of lithium ions from the electrolyte to the surface of the cathode material of the battery system,expressed by Rct; the low frequency linear impedance was attributed to the diffusion impedance of lithium ions in the cathode material, expressed by Zw. The linear relationship between Zre(Real impedance) and the square root of frequency (ω-0.5) were shown in Fig.10b, and the slope of this line was related to Warburg factor(σw).And also the lithium ion diffusion coefficients(DLi) of CFxand CFx-Ru materials were calculated according to the commonly used equation[48]. Detailed data were listed in Table 3. It could be seen from the Table 3 that the charge transfer resistance of CFx-Ru composite (161 Ω) was lower than that of the original CFxmaterial (220 Ω). Meanwhile, the former showed a higher DLiof 2.07×10⁻¹¹than 4.68×10⁻¹²cm2·s-1for the latter, which could benefit the kinetic behaviour during discharging. These data could indicate that the metal Ru modification could improve the electron transfer ability and lithium ion diffusion ability of the material, thereby improved the discharge specific capacity of the electrode material and the discharge voltage platform.

Fig.10 Impedance spectra of the CFx and CFx-Ru composites: (a) Nyquist plots and equivalent circuit;(b) Graph of Zre plotted as a function of ω-1/2 at low frequency
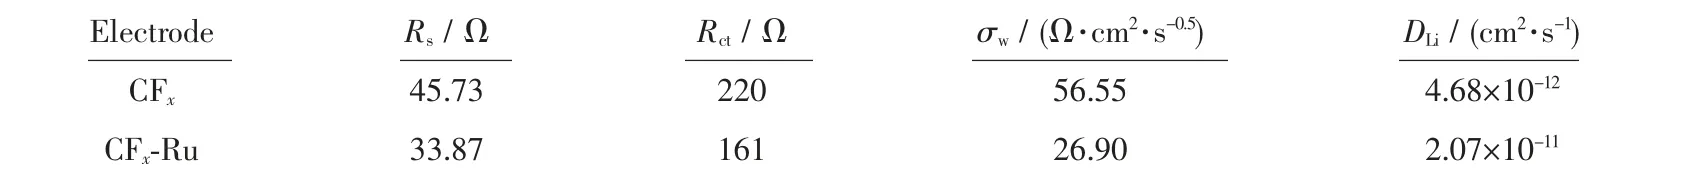
Table 3 Rs, Rct, σw and DLi values of the two electrodes prepared with CFx and CFx-Ru
3 Conclusions
In summary, we have successfully synthesized CFx-Ru materials by a simple in-situ composite method.CFx-Ru composites exhibited specific capacity of 605 mAh·g-1, maximum power density of 8 727 W·kg-1and energy density of 1 197 Wh·kg-1at a current density of 5C, which are much higher than those of pristine CFx. The reaction mechanism between CFxmaterials and Ru-containing precursor has been thoroughly investigated by XRD, XPS, and TGA et al.The structure, morphology, specific surface area and pore size distribution of the materials have also been studied in detail to reveal the reasons for their good performance. The excellent electrochemical performance of CFx-Ru materials may be explained by the reduction of nF/nCand the introduction of metal Ru via the process of modification, which improves the conductivity of the material. In addition, the larger specific surface area and pore size are beneficial to the Li+diffusion and electron transfer, which significantly reduces the charge transfer impedance and improves the Li+diffusion coefficients.
猜你喜歡
中老年保健(2021年12期)2021-08-24 03:30:40
中國傳媒大學學報(自然科學版)(2021年1期)2021-06-09 08:43:00
中國生殖健康(2020年6期)2020-02-01 06:28:50
新世紀智能(英語備考)(2019年12期)2020-01-13 06:07:18
中國生殖健康(2019年11期)2019-01-07 01:28:02
中國生殖健康(2018年6期)2018-11-06 07:09:28
科技知識動漫(2017年7期)2017-08-09 19:52:45
科技知識動漫(2017年5期)2017-05-11 21:34:16
科技知識動漫(2017年4期)2017-04-15 22:24:55
科技知識動漫(2017年2期)2017-02-06 20:59:46