基于近紅外光譜的沼液揮發性脂肪酸含量快速檢測
2020-12-03 02:24:46劉金明郭坤林張鴻瓊李文哲許永花
農業工程學報 2020年18期
關鍵詞:特征
劉金明,郭坤林,甄 峰,張鴻瓊,李文哲,許永花
·農業生物環境與能源工程·
基于近紅外光譜的沼液揮發性脂肪酸含量快速檢測
劉金明1,2,3,郭坤林2,甄 峰1,3,張鴻瓊1,4,李文哲1,4,許永花5※
(1. 東北農業大學工程學院,哈爾濱 150030;2. 黑龍江八一農墾大學電氣與信息學院,大慶 163319;3. 中國科學院可再生能源重點實驗室,廣州 510640;4. 黑龍江省寒地農業可再生資源利用技術及裝備重點實驗室,哈爾濱 150030;5. 東北農業大學電氣與信息學院,哈爾濱 150030)
揮發性脂肪酸(Volatile Fatty Acids,VFA)作為厭氧發酵過程的重要中間產物,其在厭氧反應器中的累積能夠反映出產甲烷菌的不活躍狀態或厭氧發酵條件的惡化。為了實現對農牧廢棄物厭氧發酵進行過程分析和狀態監控,將近紅外光譜(Near Infrared Spectroscopy,NIRS)與偏最小二乘(Partial Least Squares,PLS)相結合構建玉米秸稈和畜禽糞便厭氧發酵液乙酸、丙酸和總酸含量快速檢測模型。將競爭自適應重加權采樣法(Competitive Adaptive Reweighted Sampling,CARS)與遺傳模擬退火(Genetic Simulated Annealing,GSA)算法相結合構建CARS-GSA算法對沼液中的乙酸、丙酸和總酸進行特征波長優選,原始光譜數據1 557個波長點經預處理和波長優選后,得到乙酸、丙酸和總酸特征波長變量分別為135、101和245個,建立的回歸模型驗證決定系數分別為0.988、0.923和0.886,預測均方根誤差(Root Mean Squared Error of Prediction,RMSEP)分別為0.111、0.120和0.727,相對分析誤差分別為9.685、3.685和3.484,與全譜建模相比RMSEP分別減少了17.78%、15.49%和1.22%,能夠滿足農牧廢棄物厭氧發酵過程發酵液中乙酸和丙酸含量的快速檢測需求,基本滿足總酸的檢測需求。結果表明,通過構建CARS-GSA算法優選乙酸、丙酸和總酸的敏感波長變量,參與建模的波長點數量顯著減少,有效降低了變量維度和模型復雜度,提升了回歸模型檢測精度和預測能力,為快速準確檢測沼液VFA提供了新途徑。
厭氧發酵;揮發性脂肪酸;快速檢測;近紅外光譜;偏最小二乘;遺傳模擬退火算法;競爭自適應重加權采樣
0 引 言
揮發性脂肪酸(Volatile Fatty Acids,VFA)作為厭氧發酵過程的重要中間產物,為產甲烷階段提供了底物[1]。產甲烷菌主要利用VFA形成甲烷,只有少部分甲烷由二氧化碳和氫氣生成,但二氧化碳和氫氣生成甲烷時也經過高分子有機物形成VFA的中間過程[2]。VFA在厭氧反應器中的積累能反映出產甲烷菌的不活躍狀態或厭氧發酵條件的惡化,較高的VFA濃度對產甲烷菌有抑制作用,過高的VFA濃度甚至會導致厭氧發酵發生“酸敗”[3]。在反應器運行過程中,發酵液的VFA濃度常用作厭氧發酵過程的重要監控指標[4]。通過監測發酵液中VFA的變化情況,可以很好地了解有機物的降解過程以及產甲烷菌的活性和系統的運行情況[5]。為了對厭氧發酵狀態進行有效監控,有必要對發酵液的VFA含量進行快速、準確測定。
傳統的VFA檢測方法主要有精餾法、高效液相色譜法、氣相色譜法和各種滴定技術[5-6]。但傳統檢測方法存在處理時間長、設備操作復雜等問題,難以滿足厭氧發酵過程中通過快速測定VFA實現發酵過程狀態監測的需求。針對厭氧發酵過程狀態監測對VFA快速檢測的需求,相關學者深入研究了快速滴定法[7]、新型色譜技術[8]、電化學傳感器[9]、生物傳感器[10]和光譜分析技術[11]在VFA快速檢測方面的應用。光譜分析技術因其簡便、快捷、無損、低成本的優勢,已在發酵液VFA檢測方面得到了廣泛應用[12-13],其中以近紅外光譜(Near Infrared Spectroscopy,NIRS)定量分析技術的應用最為廣泛[14-16]。在應用NIRS對水體中的VFA含量進行快速檢測方面,主要以光譜預處理方法和多元定量校正方法的研究為主,在VFA特征波長優選方面尚需進一步拓展,以消除不相關和非線性波長點對模型精度的影響。
當前,NIRS特征波長優選方法正朝著多種特征波長優選方法相結合的方向發展,將區間偏最小二乘法(Interval Partial Least Squares,iPLS)[17]、協同區間偏最小二乘法(Synergy iPLS,SiPLS)[18]、反向區間偏最小二乘法(Backward iPLS,BiPLS)[19]、連續投影算法[20]、競爭自適應重加權采樣法(Competitive Adaptive Reweighted Sampling,CARS)[21]等特征波長優選算法與遺傳算法(Genetic Algorithm,GA)[22]、模擬退火算法(Simulated Annealing Algorithm,SA)[23]、粒子群優化算法[24]等智能優化算法相結合進行NIRS特征波長變量優選已成為重要研究方向[25-27]。在NIRS定量分析方面,GA因其強大的特征波長優選能力已得到廣泛應用[28-29],但GA存在早熟問題且進化后期搜索效率低。
遺傳模擬退火(Genetic Simulated Annealing,GSA)算法是對GA的改進,通過結合SA的溫度參數設計適應度函數,引入Metropolis擾動解選擇復制策略,有效利用GA強大搜索能力的同時解決了GA的兩點不足,在NIRS特征波長優選方面取得了較好的應用效果[30]。GSA在與iPLS、SiPLS和BiPLS相結合進行特征波長優選方面的性能也顯著優于GA[30-32],但在使用iPLS、SiPLS和BiPLS進行特征譜區優選時,難以避免譜區內部存在冗余波長點。這些不相關和非線性的冗余波長點導致GSA編碼過長,嚴重影響了GSA特征波長點二次搜索的性能。
因此,本文針對以秸稈和糞便為原料的厭氧發酵過程中,沼液VFA快速檢測的需求,提出基于NIRS建立VFA快速檢測模型,并將GSA與CARS相結合構建CARS-GSA算法進行VFA特征波長優選,有效解決iPLS、SiPLS和BiPLS敏感波段初步定位過程中存在冗余波長點的問題,進而獲取滿足實際檢測需求的有效特征波長變量,以提高VFA快速檢測模型的效率和精度。
1 材料與方法
1.1 樣品采集與制備
試驗用玉米秸稈取自東北農業大學校內試驗田,豬糞取自哈爾濱市三元畜產實業公司,牛糞取自哈爾濱市宇峰奶牛養殖農民專業合作社,接種物取自黑龍江省寒地農業可再生資源利用技術及裝備重點實驗室。將采集的玉米秸稈自然風干后一部分經鍘草機切成10 mm的秸稈段備用,另一部分經錘片式粉碎機(10 mm篩網)粉碎成秸稈粉備用。分別以秸稈段、秸稈粉、牛糞、豬糞、秸稈粉豬糞混合物(按總固體(Total Solid,TS)比1∶1)為厭氧發酵原料,以實驗室500 L發酵罐常年馴化正常產氣的牛糞厭氧發酵液為接種物,進行批式厭氧發酵試驗。秸稈、牛糞、豬糞和接種物的TS濃度分別為86.02%、26.62%、31.22%和4.76%,按TS接種比1∶1,調整厭氧發酵原料和接種物添加量,使5種原料對應的發酵系統起始TS濃度分別為7%、6%、8%、7%和7%。在中溫(36±1)℃恒溫水浴槽中,分別采用5和10 L下口瓶作為反應器,進行2個批次的厭氧發酵試驗,有效發酵容積分別為3.5和7 L。試驗過程中每天定時對厭氧發酵反應器進行手搖攪拌2次,混勻料液的同時避免浮渣結殼。為了獲取有代表性的VFA濃度數據樣本,采集發酵液樣品主要在批式厭氧發酵前半程進行。5 L發酵罐從裝樣后第2天開始,每天8:00采集發酵液樣品40 mL存放于3個15 mL離心管中,共計采樣16次。為防止料液TS濃度變高,對厭氧發酵過程產生不良影響,于第8天補水300 mL。10 L發酵罐從裝樣后第2天開始采樣,共計采樣15次,不需補水;共計采集與制備發酵液樣品155個,于-20℃冰箱冷凍保存。
1.2 光譜數據采集
發酵液冷凍樣品溶解后在冷凍離心機中以12 000 r/min離心10 min后,取上清液待測。使用Nicolet公司的Antaris II型傅里葉近紅外光譜儀對采集樣品進行透射光譜掃描,光譜采集范圍4 000~10 000 cm-1(1 000~2 500 nm),分辨率為8.0 cm-1,樣品掃描32次,數據保存格式為lg(1/T),背景每小時掃描一次,裝樣方式為1 mm光程石英比色皿前置通道掃描。在保持室內溫濕度基本穩定的情況下,每個樣品裝樣3次,取3次掃描平均值作為樣品的原始光譜。原始光譜的波長數量為1 557個,數據點間距為3.86 cm-1,起始波數為10 001.03 cm-1,結束波數為3 999.64 cm-1。
1.3 VFA測定
使用安捷倫GC-6890N氣相色譜儀測定厭氧發酵過程中沼液的VFA濃度。采用外標法建立VFA標準曲線,先制備乙酸、丙酸、丁酸、異丁酸和異戊酸的混合標準溶液,再使用去離子水稀釋至6種不同濃度,并測定不同濃度標準溶液各成分對應的出峰時間和積分面積。將混合溶液的保留時間與單品的保留時間進行比較,根據已知標準溶液中各物質的濃度和積分時間繪制標準曲線。對溶解、離心并采集透射光譜數據后的厭氧發酵液樣品上清液進行VFA含量測定。將其與25%偏磷酸溶液按體積比10∶1進行混合,然后再以12 000 r/min離心10 min后取上清液,將上清液使用0.45m超濾膜過濾,取濾液進行VFA濃度測定。
1.4 波長優選方法
1.4.1 CARS算法
CARS算法基于“適者生存”的原則,將蒙特卡洛采樣(Monte-Carlo Sampling,MCS)、指數衰減函數和自適應加權采樣(Adaptive Reweighted Sampling,ARS)相結合獲取波長子集,基于偏最小二乘(Partial Least Squares,PLS)回歸系數絕對值的大小獲取一系列變量組合,并選擇交叉驗證均方根誤差(Root Mean Squared Error of Cross Validation,RMSECV)值最小的子集作為特征波長。CARS在迭代過程中引入MCS和ARS 2個隨機因素,難以保證每次優選結果的一致性。可以采用多次運行CARS算法,每次都選中的波長點代表著光譜數據中與待測目標屬性相關性高的波長點,選定這些多次都選中波長作為特征波長,能夠建立高性能的回歸模型。
1.4.2 CARS-GSA算法
CARS-GSA算法以CARS優選后的特征波長為輸入,采用GSA算法對CARS優選結果進行再優化,以剔除CARS優選結果中相關性較差的波長點,從而進一步提高建模性能。CARS-GSA以CARS優選后特征波長點數為碼長,以PLS回歸模型的折RMSECV為目標函數,按初始種群個數約為碼長的三分之一進行二進制編碼和種群初始化。“1”和“0”分別表示該波長點對應的數據“是”、“否”選中參與運算。在確定初始溫度、退溫操作,并計算適應度函數值后,執行多個輪次的GSA選擇、交叉、變異和Metropolis選擇復制進化操作,完成NIRS特征波長點的優選。多次執行GSA算法對CARS優選結果進行再優化,并選擇多次重復選中的波長點作為特征波長變量建立PLS回歸模型,能夠得到較高的回歸模型性能。
1.5 回歸模型建立及評價


本文算法包括光譜預處理、樣本集劃分、特征波長優選及回歸模型構建等全部在Matlab R2012b軟件平臺中實現。
2 結果與分析
2.1 采集數據分析
在采用安捷倫GC-6890N氣相色譜儀測定155個發酵液樣本的VFA濃度時,得到81個乙酸濃度有效數據、78個丙酸濃度有效數據和87個總酸濃度有效數據(總酸濃度為乙酸、丙酸、丁酸、異丁酸和異戊酸質量分數之和)。對獲得的VFA樣本有效濃度數據進行四分位數分析,并繪制箱線圖如圖1所示。
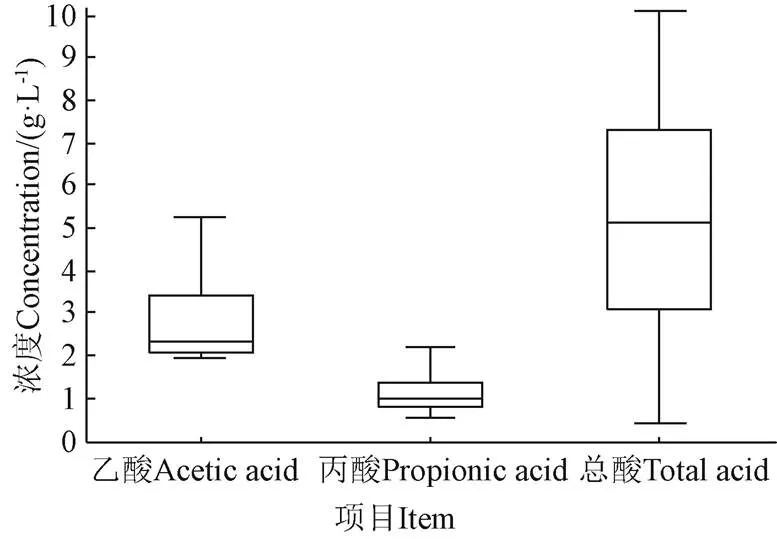
圖1 樣本VFA濃度箱線圖
由圖1可知,乙酸樣本在低濃度區域占比較大,丙酸樣本略微偏向低濃度區域,總酸樣本分布比較均勻。乙酸樣本偏離嚴重的原因在于厭氧發酵產乙酸、產甲烷平衡期產甲烷菌能夠及時將生成的乙酸轉化為甲烷和二氧化碳,進而使平衡期階段(在整個發酵周期中時間占比較大)的乙酸濃度偏低。
為消除光譜區域中平頂峰對建模結果的影響,先剔除原始光譜數據中波數4 933.02~5 295.57 cm-1的95個波長點,再用剩余的1 462個有效波長點建立乙酸、丙酸和總酸回歸模型,并對不同光譜預處理方法下的回歸模型性能進行評測。經計算比較后確定乙酸濃度回歸模型采用的光譜預處理方法為MSC+SG,丙酸回歸模型采用的光譜預處理方法為SG+MSC,總酸回歸模型采用的光譜預處理方法為FD+SNV+SG。樣品原始光譜及預處理后的乙酸、丙酸和總酸光譜數據的平均光譜如圖2所示。
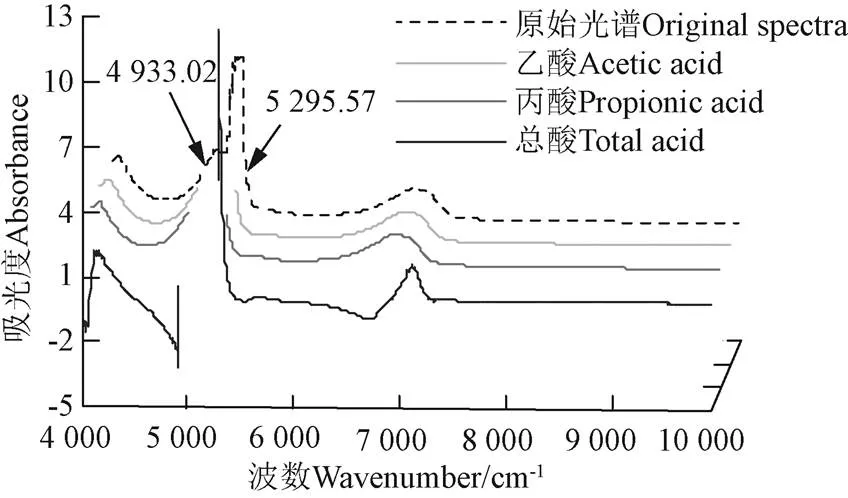
圖2 樣品光譜數據
對81個乙酸樣品的原始光譜依次進行MSC和SG平滑處理后,使用SPXY法劃分為60個校正集樣本和21個驗證集樣本;對78個丙酸樣品的原始光譜數據依次進行SG平滑和MSC處理后,使用SPXY法劃分為60個校正集樣本和18個驗證集樣本;對87個總酸樣品的原始光譜數據依次進行FD、SNV和SG平滑處理后,使用SPXY法劃分為70個校正集樣本和17個驗證集樣本。乙酸、丙酸和總酸濃度值如表1所示。

表1 樣品VFA濃度
注:SD是Standard deviation的縮寫,NS是Number of sample的縮寫。
Note: SD is short for standard deviation, NS is short for number of sample.
2.2 特征波長優選
2.2.1 CARS特征波長優選
在使用CARS優選乙酸回歸模型特征波長時,先執行500輪次CARS算法,再按重復選中次數遞增的方式選取RMSEP最小時對應的特征波長優選結果作為CARS的特征波長(記為CARS500)。執行500次CARS算法共得到乙酸特征波長383個以波數表示,下同,選中次數最多的特征波長波數為4 416.19 cm-1,對應著乙酸-CH3基團的組合頻,選中次數為457次。選中次數較多的特征波長點主要分布在4 000~4 600、4 750~4 930、5 300~5 500、5 750~6 050、6 750~7 100和7 500~7 800 cm-1區域。其中4 000~4 600 cm-1對應著乙酸-CH3基團的組合頻,4 750~4 930 cm-1對應著C=O和-OH基團的組合頻,5 300~5 500 cm-1對應著-COOH基團的一級倍頻,5 750~6 050 cm-1對應著-CH3基團的一級倍頻,6 750~7 100 cm-1對應著C=O和-OH基團的二級倍頻,7 500~7 800 cm-1對應著-CH3基團的二級倍頻。CARS500優選特征波長與乙酸平均光譜如圖3所示。
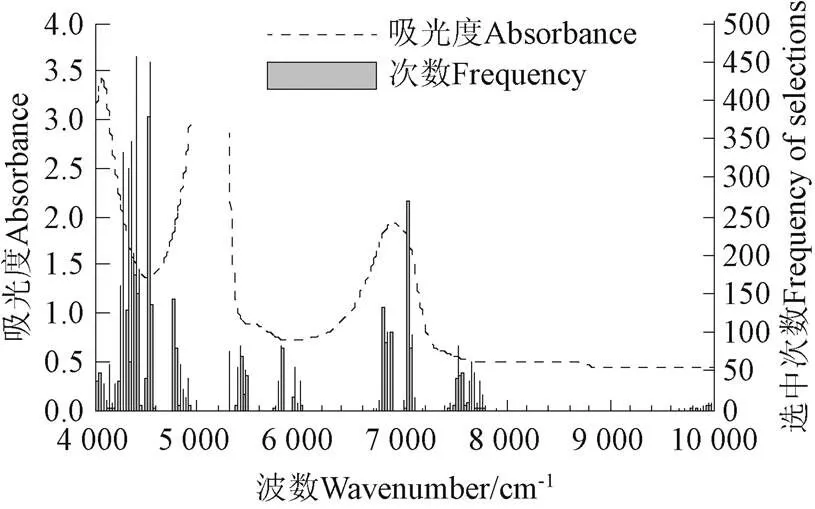
圖3 CARS500優選乙酸特征波長
為分析不同重復選中次數下,CARS500優選特征波長的建模性能,建立RMSECV、RMSEP和波長點個數隨重復選中次數的變化關系,如圖4所示。
由圖4可知,RMSECV隨著選中波長點個數的減少整體上呈先迅速減少、再波浪狀向前、最后跳躍式快速上升的形式,其中波長點數為120時,RMSECV得到最小值0.163,對應重復選中次數為39次。RMSEP隨選中波長點個數減少整體呈鋸齒型變化并逐漸增加的形式,其中重復選中次數為30、選中波長數量為142時,所建PLS回歸模型的RMSEP獲得最小值為0.116。采用RMSEP最小時對應的142個波長點作為CARS500優選的乙酸特征波長。
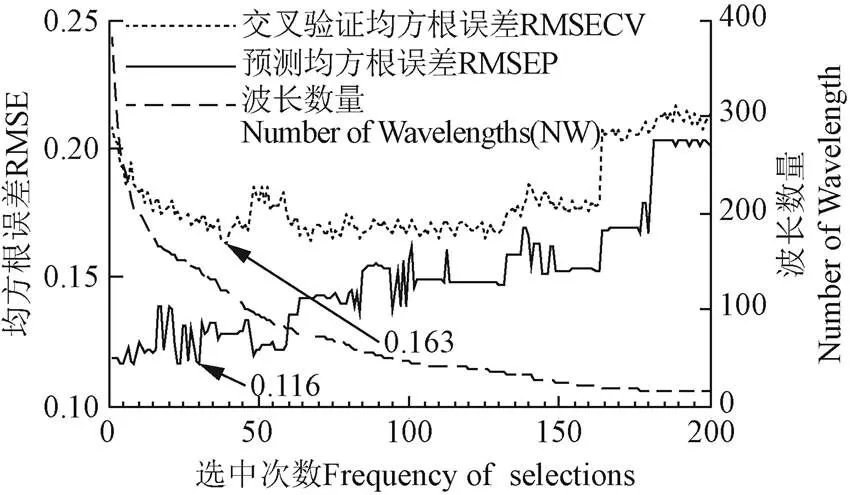
圖4 RMSE、波長數量和選中次數間的關系
2.2.2 CARS-GSA特征波長優選
在使用CARS-GSA優選發酵液乙酸特征波長時,以CARS500優選的142個波長點為碼長隨機生成50個染色體構建初始種群,執行GSA算法進行特征波長點二次優選。GSA算法的初溫確定系數取100,退溫系數取0.9,進化代數取100,交叉概率取0.7,變異概率取0.01,鄰域解擾動位數取10。連續執行算法50次,優選的乙酸特征波長中選中35次以上的波長共計14個。其中,波數4 057.49、4 319.77、4 354.48、4 358.33、4 362.19、4 366.05、4 408.48、4 412.33、4 416.19、4 420.05、4 531.90和4 539.61 cm-1對應著-CH3基團的組合頻,波數4 925.30 cm-1對應著C=O基團的組合頻,波數5 311.00 cm-1對應著-COOH基團的一級倍頻。CARS-GSA優選特征波長與乙酸平均光譜如圖5所示。
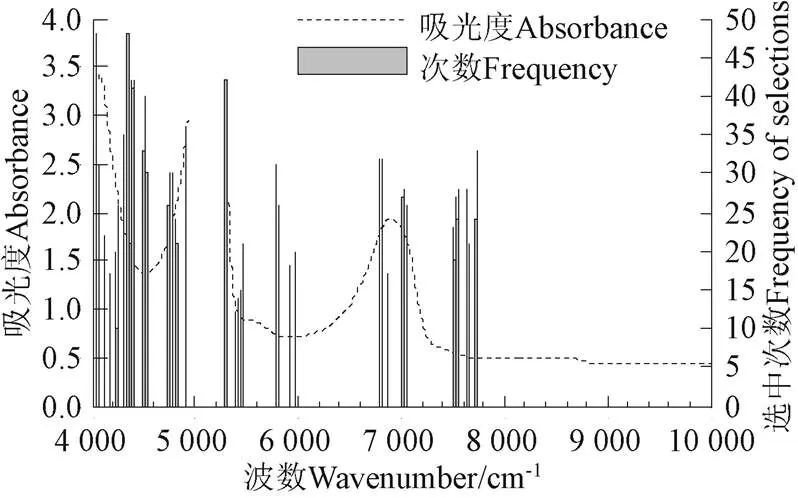
圖5 CARS-GSA優選乙酸特征波長
為分析CARS-GSA優選特征波長的建模性能,建立RMSECV、RMSEP與波長點個數間的對應關系,如圖6所示。由圖6可知,RMSECV和RMSEP隨選中波長點個數增加整體上呈先迅速減少、再趨于平緩、最后略有上升的趨勢,但RMSECV的最小值要早于RMSEP出現。RMSECV最小值對應的波長點數為54、重復選中次數為26,RMSEP最小值對應的波長點數為135、重復選中次數為10,說明僅以RMSECV最小確定特征波長的方式容易導致回歸模型產生過擬合的問題。因此,選擇RMSEP最小時對應的135個選中波長作為CARS-GSA優選的乙酸特征波長。由圖3和圖5中RMSECV和RMSEP最小值的對比可知,CARS-GSA優選特征波長的建模性能優于CARS-500的建模性能。
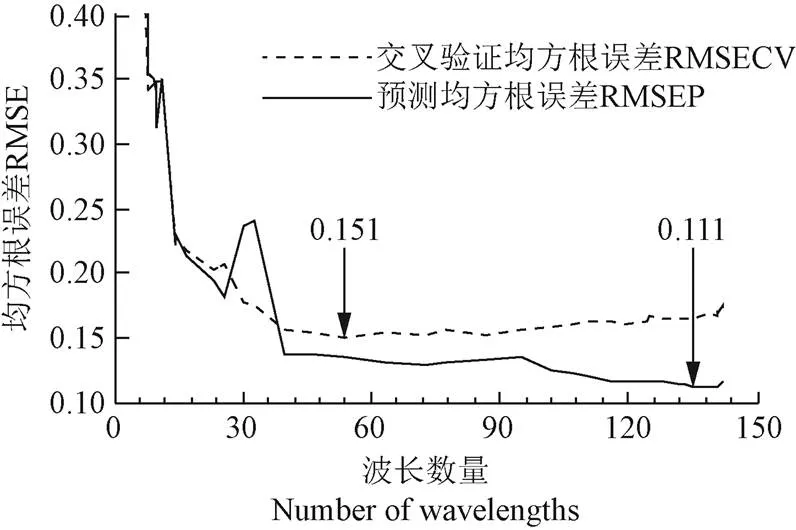
圖6 RMSE與波長數量間的關系
2.2.3 特征波長優選結果
按上述方法執行CARS500和CARS-GSA進行丙酸和總酸特征波長優選,得到101個丙酸特征波長和245個總酸特征波長。乙酸、丙酸和總酸特征波長分布情況如圖7所示。
由圖7可知,VFA特征波長全部位于8 000 cm-1以下的中低頻區域,其中4 000~4 933、5 296~5 600和6 600~7 200 cm-1區域分布的特征波長點最多,這3部分正好對應著光譜數據中吸收峰較強、分辨率較好的區域。丙酸特征波長在4 100~4 500 cm-1區域有53個,對應著-CH2和-CH3基團的組合頻;在4 000~4 900 cm-1區域有7個,對應著C=O和-OH基團的組合頻;在5 300~5 320 cm-1區域有2個,對應著-COOH基團的一級倍頻;在5 670~5 700 cm-1區域有9個,對應著-CH2基團的一級倍頻;在6 000~6 070 cm-1區域有13個,對應著-CH3基團的一級倍頻;在6 860~7 060 cm-1區域有17個,對應著C=O、-CH2和-OH的二級倍頻。總酸特征波長在4 000~4 720 cm-1區域有139個,對應著C-C、C=O、-CH、-CH2和-CH3基團的組合頻;在4 800~4 930 cm-1區域有27個,對應著C=O和-OH基團的組合頻;在5 300~5 380 cm-1區域有19個,對應著-COOH基團的一級倍頻;在5 930~6 010 cm-1區域有11個,對應著-CH、-CH2和-CH3基團的一級倍頻;在6 590~6 600 cm-1區域有2個,對應著C=O基團的二級倍頻;在6 730~7 200 cm-1區域有47個,對應著C=O、-CH、-CH2、-CH3和-OH的二級倍頻。通過分析乙酸、丙酸和總酸特征波長可知,CARS-GSA與CARS500優選特征波長結果具有很好的一致性,CARS-GSA只是剔除掉CARS500優選特征波長中選中次數較少的相關性較差波長點。
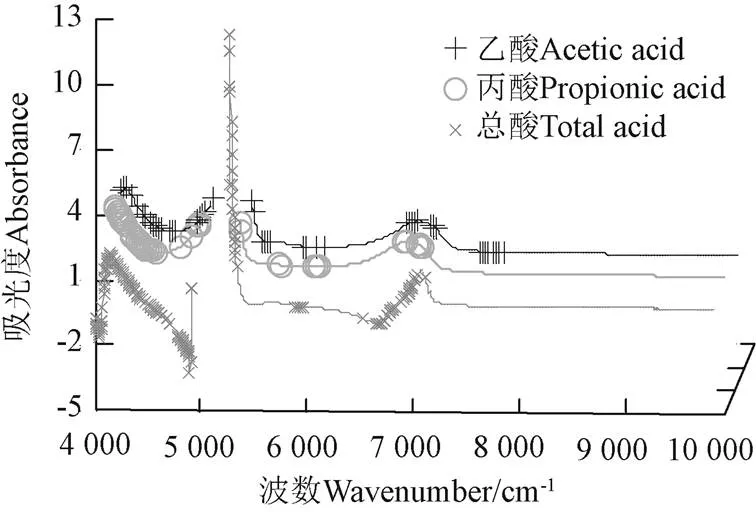
圖7 VFA特征波長優選結果
2.3 回歸模型評價與分析
為評測2種波長優選算法的性能,以CARS500和CARS-GSA優選后的特征波長變量作為PLS回歸模型的輸入,建立沼液VFA定量回歸模型,并與全譜建模結果(Full-PLS)、單次CARS(運行10次取最佳結果)優選特征波長的建模效果進行對比,結果如表2所示。
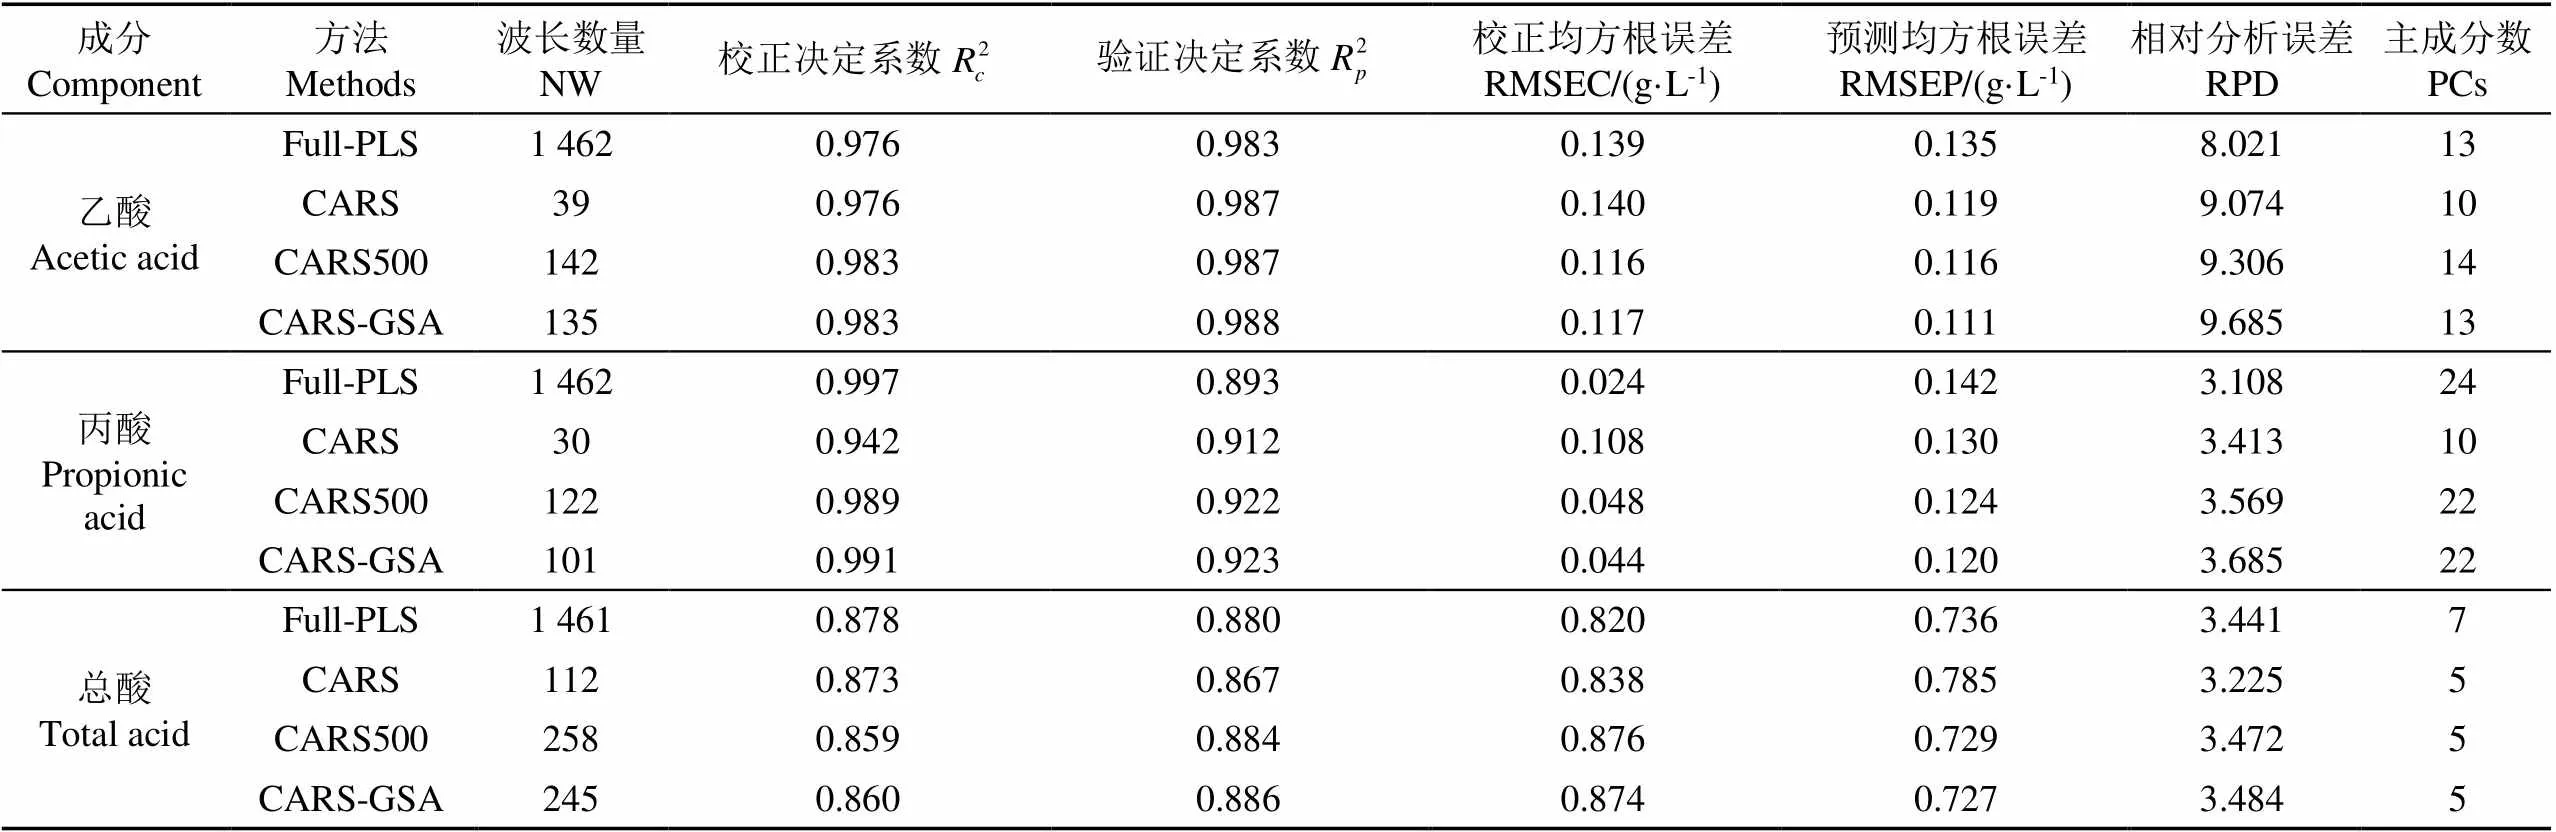
表2 VFA PLS回歸模型評價指標
注:PCs是principal components的縮寫。
Note: PCs is short for principal components.
由表2可知,在單次CARS優選特征波長建立的VFA回歸模型中,乙酸和丙酸CARS回歸模型的性能優于全譜建模,而總酸CARS回歸模型的性能弱于全譜建模。原因在于乙酸和丙酸的結構相對簡單,CARS能夠快速定位到相關性高的特征波長點,而總酸的結構相對復雜,不同基團對應的特征波長點數量較多,當使用CARS剔除波長點時可能去掉某些相關性較高的特征波長點,導致建模性能受到影響。多次執行CARS算法進行特征波長優選可以解決單次CARS算法優選總酸特征波長建模性能較差的問題。
采用CARS-GSA作為厭氧發酵過程中發酵液乙酸、丙酸和總酸濃度的特征波長優選方案,以優選后的特征波長分別建立乙酸、丙酸和總酸濃度PLS回歸模型并進行性能評測,其結果如圖8所示。
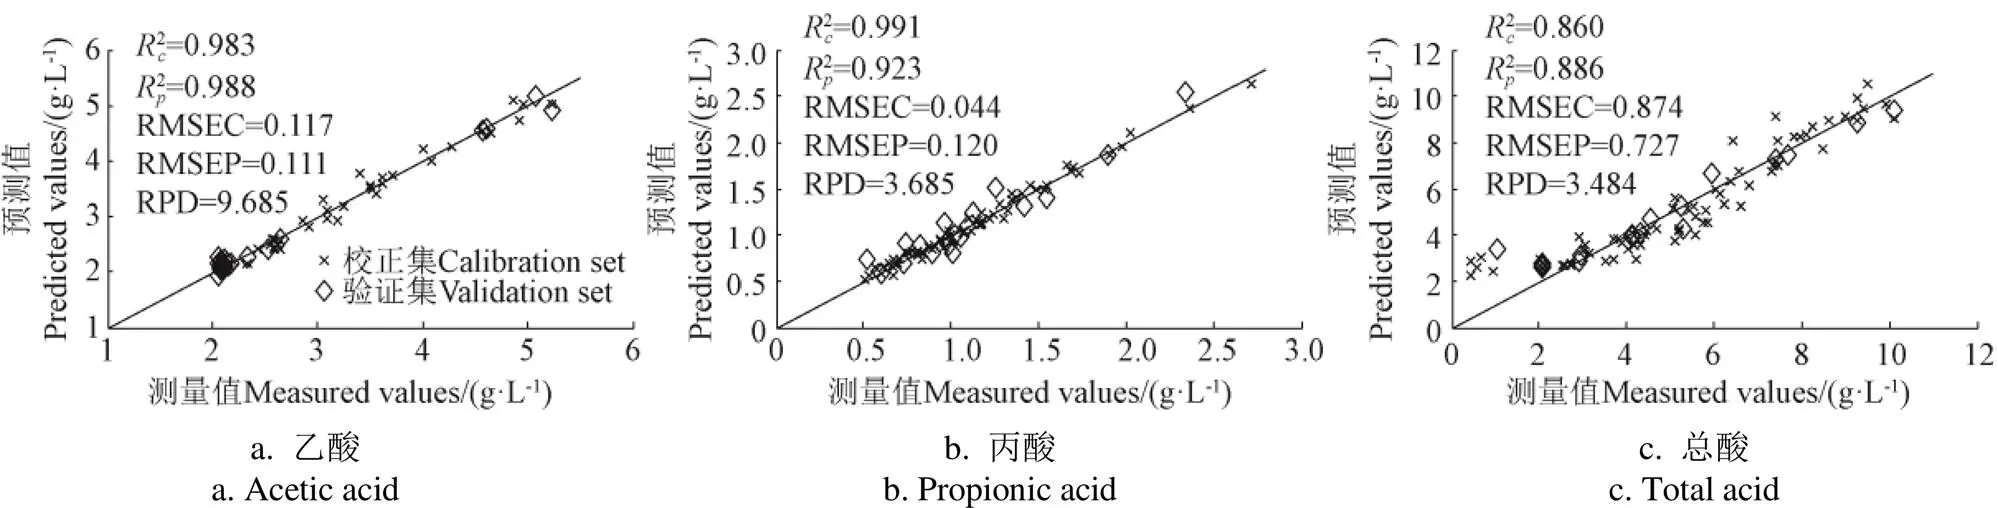
圖8 VFA實測值與預測值分布

3 結 論
1)本研究采用NIRS結合化學計量學方法進行沼液VFA的快速檢測,構建模型進行特征波長優選,建立的乙酸、丙酸和總酸PLS回歸模型驗證決定系數分別為0.988、0.923和0.886,預測均方根誤差分別為0.111、0.120和0.727,且RPD都大于3,能夠滿足農牧廢棄物厭氧發酵過程中對發酵液乙酸和丙酸濃度的快速檢測需求,基本滿足總酸濃度的檢測需求。
2)CARS500在發酵液VFA濃度NIRS特征波長優選方面具有良好的性能,通過多次執行CARS算法并選取重復選中波長點作為特征波長的方式能夠有效提高建模精度和效率,并在一定程度上解決了CARS算法優選特征波長結果的隨機性問題。
3)CARS-GSA采用GSA對多次CARS優選的特征波長進行二次優化,能夠有效去除CARS500優選波長中相關性較弱的冗余波長點,在提高建模精度和檢測效率的同時,確立了乙酸、丙酸和總酸相關基團與其特征波長的對應關系和特征波長在光譜區間內的分布規律。
[1]史風梅,徐洪濤,盧玢宇,等. 溫度對養殖廢水厭氧發酵初期產酸的影響及其原因分析[J]. 農業工程學報,2018,34(增刊):42-47. Shi Fengmei, Xu Hongtao, Lu Binyu, et al. Effects of temperature on production of volatile fatty acids in mesophilic anaerobic fermentation of swine wastewater and its cause analysis[J]. Transactions of the Chinese Society of Agricultural Engineering (Transactions of the CSAE), 2018, 34(Supp.): 42-47. (in Chinese with English abstract)
[2]于佳動,趙立欣,馮晶,等. 序批式秸稈牛糞混合厭氧干發酵過程物料理化及滲濾特性[J]. 農業工程學報,2019,35(20): 228-234. Yu Jiadong, Zhao Lixin, Feng Jing, et al. Physicochemical and percolating characteristics of sequencing batch dry anaerobic digestion of straw-cow manure mixture[J]. Transactions of the Chinese Society of Agricultural Engineering (Transactions of the CSAE), 2019, 35(20): 228-234. (in Chinese with English abstract)
[3]宋香育,張克強,房芳,等. 工藝措施對豬糞秸稈混合厭氧干發酵產氣性能的影響[J]. 農業工程學報,2017,33(11):233-239. Song Xiangyu, Zhang Keqiang, Fang Fang, et al. Influences of different technological strategies on performance of anaerobic co-digestion of pig manure with straw in solid-state[J]. Transactions of the Chinese Society of Agricultural Engineering (Transactions of the CSAE), 2017, 33(11): 233-239. (in Chinese with English abstract)
[4]Sbarciog M, Giovannini G, Chamy R, et al. Control and estimation of anaerobic digestion processes using hydrogen and volatile fatty acids measurements[J]. Water Science and Technology, 2018, 78(10): 2027-2035.
[5]Chatterjee B, Radhakrishnan L, Mazumder D. New approach for determination of volatile fatty acid in anaerobic digester sample[J]. Environmental Engineering Science, 2018, 35(4): 333-351.
[6]Lahav O, Morgan B E. Titration methodologies for monitoring of anaerobic digestion in developing countries: A review[J]. Journal of Chemical Technology and Biotechnology, 2004, 79(12): 1331-1341.
[7]Hey T, Sandstrom D, Ibrahim V, et al. Evaluating 5 and 8 pH-point titrations for measuring VFA in full-scale primary sludge hydrolysate[J]. Water SA, 2013, 39(1): 17-22.
[8]Ward A J, Bruni E, Lykkegaard M K, et al. Real time monitoring of a biogas digester with gas chromatography, near-infrared spectroscopy, and membrane-inlet mass spectrometry[J]. Bioresource Technology, 2011, 102(5): 4098-4103.
[9]Peris M, Escuder-Gilabert L. On-line monitoring of food fermentation processes using electronic noses and electronic tongues: A review[J]. Anal Chim Acta, 2013, 804: 29-36.
[10]Yu Z, Leng X, Zhao S, et al. A review on the applications of microbial electrolysis cells in anaerobic digestion[J]. Bioresource Technology, 2018, 255: 340-348.
[11]Nguyen Duc, Gadhamshetty Venkataramana, Nitayavardhana Saoharit, et al. Automatic process control in anaerobic digestion technology: A critical review[J]. Bioresource Technology, 2015, 193: 513-522.
[12]Bruni E, Ward A J, Kocks M, et al. Comprehensive monitoring of a biogas process during pulse loads with ammonia[J]. Biomass & Bioenergy, 2013, 56: 211-220.
[13]Falk H M, Reichling P, Andersen C, et al. Online monitoring of concentration and dynamics of volatile fatty acids in anaerobic digestion processes with mid-infrared spectroscopy[J]. Bioprocess and Biosystems Engineering, 2015, 38(2): 237-249.
[14]Stockl Andrea, Lichti Fabian. Near-infrared spectroscopy (NIRS) for a real time monitoring of the biogas process[J]. Bioresource Technology, 2018, 247: 1249-1252.
[15]Nespeca Maurílio Gustavo, Rodrigues Caroline Varella, Santana Kamili Oliveira, et al. Determination of alcohols and volatile organic acids in anaerobic bioreactors for H2production by near infrared spectroscopy[J]. International Journal of Hydrogen Energy, 2017, 42(32): 20480-20493.
[16]Li L, Peng X Y, Wang X M, et al. Anaerobic digestion of food waste: A review focusing on process stability[J]. Bioresource Technology, 2018, 248: 20-28.
[17]Rato Tiago J, Reis Marco S. Multiresolution interval partial least squares: A framework for waveband selection and resolution optimization[J]. Chemometrics and Intelligent Laboratory Systems, 2019, 186: 41-54.
[18]鄒小波,張俊俊,黃曉瑋,等. 基于音頻和近紅外光譜融合技術的西瓜成熟度判別[J]. 農業工程學報,2019,35(9): 301-307. Zou Xiaobo, Zhang Junjun, Huang Xiaowei, et al. Distinguishing watermelon maturity based on acoustic characteristics and near infrared spectroscopy fusion technology[J]. Transactions of the Chinese Society of Agricultural Engineering (Transactions of the CSAE), 2019, 35(9): 301-307. (in Chinese with English abstract)
[19]Zareef M, Chen Q S, Ouyang Q, et al. Prediction of amino acids, caffeine, theaflavins and water extract in black tea using FT-NIR spectroscopy coupled chemometrics algorithms[J]. Analytical Methods, 2018, 10(25): 3023-3031.
[20]張亞坤,羅斌,宋鵬,等. 基于近紅外光譜的大豆葉片可溶性蛋白含量快速檢測[J]. 農業工程學報,2018,34(18):187-193. Zhang Yakun, Luo Bin, Song Peng, et al. Rapid determination of soluble protein content for soybean leaves based on near infrared spectroscopy[J]. Transactions of the Chinese Society of Agricultural Engineering (Transactions of the CSAE), 2018, 34(18): 187-193. (in Chinese with English abstract)
[21]王巧華,梅璐,馬美湖,等. 利用機器視覺與近紅外光譜技術的皮蛋無損檢測與分級[J]. 農業工程學報,2019,35(24): 314-321. Wang Qiaohua, Mei Lu, Ma Meihu, et al. Nondestructive testing and grading of preserved duck eggs based on machine vision and near-infrared spectroscopy[J]. Transactions of the Chinese Society of Agricultural Engineering (Transactions of the CSAE), 2019, 35(24): 314-321. (in Chinese with English abstract)
[22]Jiang H, Xu W, Chen Q. Comparison of algorithms for wavelength variables selection from near-infrared (NIR) spectra for quantitative monitoring of yeast (Saccharomyces cerevisiae) cultivations[J]. Spectrochimica Acta Part A: Molecular and Biomolecular Spectroscopy, 2019, 214: 366-371.
[23]Ye Dandan, Sun Laijun, Zou Borui, et al. Non-destructive prediction of protein content in wheat using NIRS[J]. Spectrochimica Acta Part A: Molecular and Biomolecular Spectroscopy, 2018, 189: 463-472.
[24]Zhu Y W, Chen X Y, Wang S M, et al. Simultaneous measurement of contents of liquirtin and glycyrrhizic acid in liquorice based on near infrared spectroscopy[J]. Spectrochimica Acta Part A: Molecular and Biomolecular Spectroscopy, 2018, 196: 209-214.
[25]楊瑋,李民贊,鄭立華,等. 冬棗氮素含量預測模型中特征波長選擇方法的應用[J]. 農業工程學報,2015,31(增刊2):164-168. Yang Wei, Li Minzan, Zheng Lihua, et al. Application of spectral screening method on prediction model of nitrogen content of jujube leaves[J]. Transactions of the Chinese Society of Agricultural Engineering (Transactions of the CSAE), 2015, 31(Supp.2): 164-168. (in Chinese with English abstract)
[26]朱瑤迪,張佳燁,李苗云,等. 肽聚糖對肉制品中產氣莢膜梭菌芽孢萌發率影響及預測[J]. 農業工程學報,2020,36(4): 287-293. Zhu Yaodi, Zhang Jiaye, Li Miaoyun, et al. Effect of different peptidoglycan on clostridium perfringens spore germination and quantitative prediction[J]. Transactions of the Chinese Society of Agricultural Engineering (Transactions of the CSAE), 2020, 36(4): 287-293. (in Chinese with English abstract)
[27]Yun Y H, Bin J, Liu D L, et al. A hybrid variable selection strategy based on continuous shrinkage of variable space in multivariate calibration[J]. Analytica Chimica Acta, 2019, 1058: 58-69.
[28]Yang M, Xu D, Chen S, et al. Evaluation of machine learning approaches to predict soil organic matter and ph using vis-NIR spectra[J]. Sensors, 2019, 19(2): 263.
[29]Song J, Li G, Yang X. Optimizing GA-PLS model of soluble solids content in Fukumoto navel orange based on Vis-NIR transmittance spectroscopy using discrete wavelet transform[J]. Journal of the Science of Food and Agriculture, 2019, 99(11): 4898-4903.
[30]劉金明,初曉冬,王智,等. 玉米秸稈纖維素和半纖維素NIRS特征波長優選[J]. 光譜學與光譜分析,2019,39(3):743-750. Liu Jinming, Chu Xiaodong, Wang Zhi, et al. Optimization of characteristic wavelength variables of near infrared spectroscopy for detecting contents of cellulose and hemicellulose in corn stover[J]. Spectroscopy and Spectral Analysis, 2019, 39(3): 743-750. (in Chinese with English abstract)
[31]劉金明,程秋爽,甄峰,等. 基于GSA的厭氧發酵原料碳氮比NIRS快速檢測[J]. 農業機械學報,2019,50(11): 323-330. Liu Jinming, Cheng Qiushuang, Zhen Feng, et al. Rapid determination of C/N ratio for anaerobic fermentation feedstocks using near infrared spectroscopy based on GSA[J]. Transactions of the Chinese Society for Agricultural Machinery, 2019, 50(11): 323-330. (in Chinese with English abstract)
[32]Liu Jinming, Li Nan, Zhen Feng, et al. Rapid detection of carbon-nitrogen ratio for anaerobic fermentation feedstocks using near-infrared spectroscopy combined with BiPLS and GSA[J]. Applied Optics, 2019, 58(18): 5090-5097.
Rapid determination of volatile fatty acids in biogas slurry based on near infrared spectroscopy
Liu Jinming1,2,3, Guo Kunlin2, Zhen Feng1,3, Zhang Hongqiong1,4, Li Wenzhe1,4, Xu Yonghua5※
(1.,,150030,; 2.,,163319,; 3.,510640,; 4.,150030,; 5.,,150030,)
Volatile Fatty Acids (VFA), serving as important intermediate products in Anaerobic Digestion (AD), have been considered as the key variables in most AD monitoring strategies, as they respond to incoming imbalances, indicating the buffer capacity of digesters to process disturbance and imminent digester failure that caused by sudden operational changes. In order to ensure efficient operation of AD while improve the utilization rate of raw materials, it is necessary to accurately monitor and evaluate the operation state of biogas engineering, via detecting the concentrations of VFA in the process of biogas production with corn stover and animal manure as feedstocks. Previously, the rapid detection models of Acetic Acid (AA), Propionic Acid (PA) and Total Acid (TA) in biogas slurry have been constructed, using the Near Infrared Spectroscopy (NIRS) technique combined with the Partial Least Squares (PLS), aiming to overcome the time consuming and high-cost in the traditional chemical analysis method. However, a prediction model can trigger the high complexity and low accuracy, due to the spectroscopic data generally includes quantities of invalid redundant information. In this study, an integrated algorithm was presented, based on the Competitive Adaptive Reweighted Sampling (CARS) and genetic simulated annealing algorithm (GSA), to optimize the characteristic wavelength variables of AA, PA, and TA, and thereby to improve the efficiency and precision of NIRS detection models. An AD experiment was carried out with corn stover, pig manure and cow manure as feedstocks, where 155 samples of biogas slurry were collected. The NIRS data of biogas slurry was acquired in a transmittance mode using the AntarisTMII FT-NIR spectrophotometer equipped with a quartz cuvette. A Gas Chromatography (GC) system was used to measure the VFA of biogas slurry, where 81 valid data of AA, 78 valid data of PA, and 87 valid data of TA were obtained to establish the regression model. One segment of the spectrum with 95 wavelength points was removed from 4 933.02 to 5 295.57 cm-1, and 1462 wavelength variables remained, mainly due to the saturation of spectrum can be caused by the strong combination band of -OH from water. The spectral preprocessing methods were selected, according to the mean relative error of calibration set. Correspondingly, the samples were divided into the calibration set and validation set, using Sample Set Portioning based on Joint X-Y Distances (SPXY) algorithm. The number of characteristic wavelength variables for AA, PA, and TA were 135, 101, and 245, respectively. The PLS regression models were established with the characteristic wavelengths of AA, PA, and TA, where the results were the coefficients of multiple determination for prediction is 0.988, root mean squared error of prediction (RMSEP) of 0.111, and the residual predictive deviation (RPD) of 9.685 for AA, coefficients of multiple determination for prediction is 0.922, RMSEP of 0.120, and RPD of 3.685 for PA, coefficients of multiple determination for prediction is 0.886, RMSEP of 0.727, and RPD of 3.484 for TA. Meanwhile, compared with the whole spectrum model, the RMSEP in the CARS-GSA model decreased by 17.78%, 15.49%, and 1.22%, respectively, showing that the number of wavelengths significantly decreased after the optimization, whereas, the performance of regressive model was obviously higher than that of the whole wavelengths. The results demonstrate that the CARS-GSA model can fulfil the requirement of rapid detection for AA and PA concentrations in biogas slurry during anaerobic fermentation with agricultural waste as feedstocks, while basically meet the detection requirement of TA concentration. The CARS-GSA model also can be used to enhance the forecasting capability of the model, while reduce its complexity. The findings can provide a new way to improve the accuracy and robustness of prediction model, base on optimizing sensitive wavelengths for AA, PA, and TA, further for rapid and accurate measurement of VFA concentrations in biogas slurry.
anaerobic digestion; volatile fatty acids; rapid determination; near infrared spectroscopy; partial least squares; genetic simulated annealing algorithm; competitive adaptive reweighted sampling
劉金明,郭坤林,甄峰,等. 基于近紅外光譜的沼液揮發性脂肪酸含量快速檢測[J]. 農業工程學報,2020,36(18):188-196.doi:10.11975/j.issn.1002-6819.2020.18.023 http://www.tcsae.org
Liu Jinming, Guo Kunlin, Zhen Feng, et al. Rapid determination of volatile fatty acids in biogas slurry based on near infrared spectroscopy[J]. Transactions of the Chinese Society of Agricultural Engineering (Transactions of the CSAE), 2020, 36(18): 188-196. (in Chinese with English abstract) doi:10.11975/j.issn.1002-6819.2020.18.023 http://www.tcsae.org
2020-05-10
2020-06-28
中國科學院可再生能源重點實驗室(Y907k81001);國家重點研發計劃(2019YFD1100603);黑龍江省博士后面上資助(LBH-Z19087);黑龍江八一農墾大學三橫三縱支持計劃(ZRCQC202007);黑龍江八一農墾大學學成人才科研啟動計劃(XDB202006)
劉金明,博士,副教授,主要從事光譜分析技術在農業領域的應用研究。Email:jinmingliu2008@126.com
許永花,副教授,主要從事光譜分析技術方面的研究。Email:xyhsy@126.com
10.11975/j.issn.1002-6819.2020.18.023
O657.33
A
1002-6819(2020)-18-0188-09
猜你喜歡
數學小靈通·3-4年級(2024年2期)2024-05-15 02:02:28
中學生數理化(高中版.高考數學)(2022年3期)2022-04-26 14:04:16
數學年刊A輯(中文版)(2020年1期)2020-05-19 00:30:36
空間科學學報(2020年2期)2020-04-01 03:50:40
瘋狂英語·新策略(2019年10期)2019-12-13 08:43:28
中等數學(2019年8期)2019-11-25 01:38:14
當代陜西(2019年10期)2019-06-03 10:12:04
新聞傳播(2018年11期)2018-08-29 08:15:24
數學小靈通·3-4年級(2017年9期)2017-10-13 08:10:54
廣西科技大學學報(2016年1期)2016-06-22 13:10:38
