Effect of Two Kinds of Similarity Factors on Principal Component Analysis Fault Detection in Air Conditioning Systems
2021-09-07 06:31:04YANGXuebin楊學賓HERuru何如如WANGJiLUOWenjun羅雯軍
YANG Xuebin(楊學賓), HE Ruru(何如如), WANG Ji(王 吉), LUO Wenjun(羅雯軍)
1 College of Environmental Science and Engineering, Donghua University, Shanghai 201620, China
2 Shanghai Division, China Ship Development and Design Center, Shanghai 201108, China
Abstract: Screening similar historical fault-free candidate data would greatly affect the effectiveness of fault detection results based on principal component analysis(PCA). In order to find out the candidate data, this study compares unweighted and weighted similarity factors (SFs), which measure the similarity of the principal component subspace corresponding to the first k main components of two datasets. The fault detection employs the principal component subspace corresponding to the current measured data and the historical fault-free data. From the historical fault-free database, the load parameters are employed to locate the candidate data similar to the current operating data. Fault detection method for air conditioning systems is based on principal component. The results show that the weighted principal component SF can improve the effects of the fault-free detection and the fault detection. Compared with the unweighted SF, the average fault-free detection rate of the weighted SF is 17.33% higher than that of the unweighted, and the average fault detection rate is 7.51% higher than unweighted.
Key words: similarity factor(SF); fault detection; principal component analysis(PCA); historical candidate data; air conditioning system
Introduction
The energy saving potential of fault detection diagnosis (FDD) can be up to 10%-40% of heating ventilating and air conditioning (HVAC) energy consumption[1]. At present, FDD methods are mainly divided into three categories[2]: model-based, knowledge-based and data-driven. The model-based method needs to develop a simulation model, and the process is relatively complex. The knowledge-based method needs a large number of credible expert experience. And the data-driven method is not to establish an accurate system model, but to mine the recorded historical data[3]. The most commonly used data-driven methods[4]include principal component method, partial least squares method, support vector machine, artificial neural network and so on.
Principal component analysis (PCA) has been widely used in fault detection for air conditioning systems. Wang and Xiao[5]employed PCA method to detect air conditioning sensor faults. Jin and Du[6]applied PCA method to detect the fixed deviation faults of temperature and flow sensors in variable air volume systems. Beghietal.[7]used PCA to detect the faults in water chiller. Gajjaretal.[8]defined the load limit of some variables in the principal component as zero, and then carried out fault detection. Hassanpouretal.[9]combined the first law of thermodynamics with PCA to detect faults in HVAC systems. Wangetal.[10]decomposed the data space into molecular space and residual subspace, and employed fractional matrix in PCA residual subspace to develop Bayesian model. Lietal.[11]applied statistical methods to eliminate singular points, and used PCA to detect sensor faults in nuclear power plants. Hanetal.[12]used wavelet transform to eliminate redundancy and noise in original data and improved the quality of PCA modeling data. Huetal.[13]proposed Bagging algorithm to eliminate wrong data and improved the stability of PCA fault detection. Huetal.[14-15]proposed an adaptive PCA method to automatically delete the wrong data in the original data and to improve the fault detection efficiency. Guoetal.[16]developed a Satizky-Golay method to smooth the original data, which was combined with PCA for fault detection of variable refrigerant flow systems.
Unfortunately, most of the current research works mainly focused on the improvement and application of PCA method itself, or even used simulation data rather than field data. Also, some works took historical operation data as training data, but did not consider the historical fault-free candidate data and even the weights among various variables in actual systems.
This study investigated the unweighted and weighted PCA similarity factors (SFs). Considering outdoor meteorological parameters and indoor load parameters, the similar candidate data were searched from historical fault-free database, and then were applied to PCA fault detection. The field data from ASHRAE 1312 were employed to test two calculating methods.
1 Pattern Matching(PM) Model
The PM method selects historical fault-free operating data which are similar to the current operating condition. The moving window divides the historical data into many data windows at a certain moving speed[17]. Each moving window has the same size as the current measured window. The SF is calculated to represent the degree of similarity between each moving window and current measured window. The first five data windows with the highest SFs are selected to form a reference for PCA fault detection.
1.1 Load parameter variables
Air conditioning systems are usually installed with temperature, humidity, flow and other sensors to measure system performance[18]. However, some variables reflecting air conditioning loads, such as solar irradiance, photoelectric power of equipment or lighting, the number of occupants, might not be available. After the air continuously enters the room, the cooling load or heating load is removed and the temperature gradually approaches the set-point. Once the system reaches equilibrium, the heat and moisture content also reach a balance[19]. Therefore, the measuring parameters can replace the unavailable load parameters. The enthalpy of outdoor air can reflect the climatic conditions to a certain extent[20], and the balance of heat and humidity in a room can reflect the operating load of the air condition. The air enthalpy can be calculated by temperature and humidity. As shown in Table 1, temperature, humidity and air flow rate are selected as indoor load parameters.

Table 1 Selection of meteorological and indoor load parameters
1.2 SF
SF is used to characterize the proximity between current measured data and historical operation data. The current measured data are defined asS, and the historical candidate data are defined asH. Both are composed ofnvariables andmdata, respectively. Assume thatk1andk2are the principal components ofSandH, respectively. The eigenvector matrix with the firstkprincipal component space ofLandMcan be used to calculate the PCA SF[21].
(1)
whereLdenotes principal component space ofS,Mmeans principal component space ofH, andkis the number of principal components.
PCA model needs a similarity with the variance described by each principal component direction. The data variance ofkprincipal components varies greatly and each principal component is equally weighted. This cannot reflect the difference between different principal components. The square root of the corresponding eigenvalue is used to represent the difference between the principal components. The formula of weighted SF[22]is
(2)
1.3 Moving window
The moving window, which has the same size as current measured data[23], slides forward at moving speedw. If a window moves one step,wobservations will be skipped. Historical fault-free database is divided into many data windows. The sizes of moving window and moving speed determine the number of data windows and corresponding SFs.
All SFs are sorted from large to small. The windows with the top largest similarity factors are selected as a historical candidate pool. The duplicate data must be deleted and replaced by new data which are selected from the window with next largest SFs.
2 Fault Detection Method
In the actual system, the combination of variables can describe the physical process or event more accurately than a single variable[24]. Figure 1 shows the flow chart of the fault detection method. Principal components can convert complex variables into a set of unrelated or orthogonal variables. The square prediction error (SPE) is used as the fault judgment scale[25]. The SPE with a confidence level of 95% is used to detect whether the system fault or not. If the value of SPE is less than that of the threshold, it means that the system has no fault, otherwise the system is faulty.
QSPE=‖e‖2≤Qα,
(3)
(4)

Assumed that the data window of current measured data are 60 data points, and the moving speed is 10 data points. The SF is calculated one time when the moving window slides forward one step. The SPE between current measured data and historical candidate data are calculated to check whether the system is faulty or not. The fault detection rate[15]is used to evaluate the effect of fault detection.
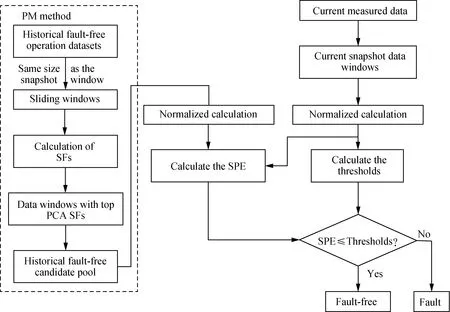
Fig. 1 Flow chart of the fault detection method
3 Results and Discussion
The stable running time of air conditioning systems is 10:00-18:00 every day, and the data are collected every one minute. Based on the first law of thermodynamics, selecting 12 operating performance parameters[5]to build up the PCA fault detection model, such as temperature, flow rate, power and fan speed.
3.1 Fault-free condition
The window of current data are defined as 60 data points recorded in one hour. During the stable running time, the data window is recorded from 10:00-11:00 to 17:00-18:00. Other data except the current measured data are used as the historical reference data.
Figure 2 shows the fault-free detection results under two kinds of PCA SFs. On May 2, the average fault detection rate is 13.75%, that is, no fault symptom is detected. For the unweighted SF calculating method, SPEs during 12:00-13:00, 14:00-15:00, 16:00-17:00 and 17:00-18:00, are larger than 60% and even up to 100%, which means fault detected in these time periods. Fortunately, for the weighted method, SPEs only during 10:00-11:00 and 14:00-15:00 are higher than 50%, and no fault symptom is detected in the most of time periods. On August 25 and February 17, the average fault detection rates are 18.13% and 0.42%, respectively. And there is no fault in these two days.
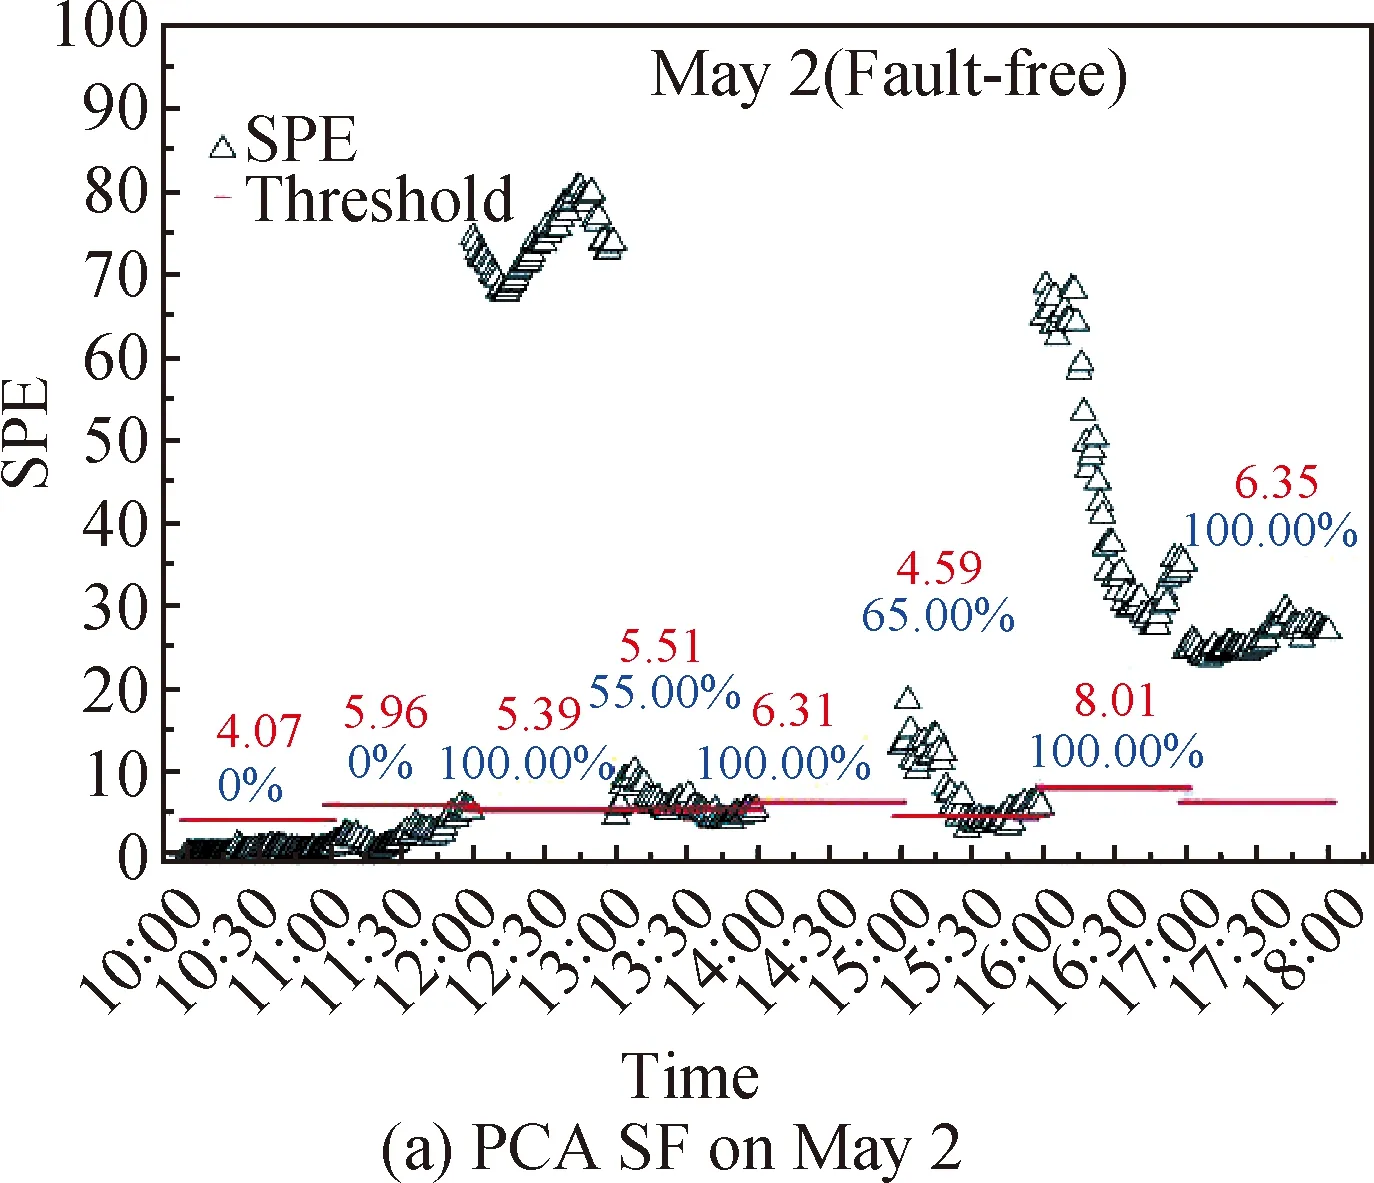
Fig. 2 Fault-free detection results under unweighted and weighted SFs (The red data mean the value of threshold,and the blue data are the fault detection rate)
3.2 Fault condition
Figure 3 shows the fault detection results under two kinds of PCA SFs. The current measured window is obtained from 10:00 to 18:00 hourly. All the data form 10:00 to 18:00 under fault-free condition are used as the historical fault-free database.
On May 27, the average fault detection rates for unweighted and weighted SF calculating methods, are 71.46% and 81.25%, respectively. For the unweighted SF calculating method, the fault detection rates during 10:00-11:00 and 11:00-12:00 are 7.70% and 5.39%, respectively, which means that no fault symptom is detected in these time periods. For the weighted method, however, the fault detection rates during 10:00-11:00 and 15:00-16:00 are 36.67% and 3.33%, respectively. Low detection rates cannot detect the generated fault symptom. On August 20, the average fault detection rates are 26.88% for the unweighted and 50.42% for the weighted. On February 8, the average fault detection rates are 61.25% for the unweighted and 73.96% for the weighted, respectively.
4 Performance Evaluation of Fault Detection
The unweighted SF only considerskprincipal components, and the influence of each component is the same. The weighted SF weights the eigenvalue corresponding to each principal component by squared root.
Table 2 and Table 3 list the comparison of fault-free and fault detection results under two SFs. For fault-free condition, the fault-free detection rates of weighted SF are more than 78.33%. On May 2 and May 5, the fault detection rates of unweighted SF are more than 50%. The fault detection rates of weighted SF are not significantly better than those of unweighted.
Table 4 evaluates the fault-free and fault detected rates of two PCA SFs. The weighted SFs are obviously better than the unweighted. The average detection rates of fault-free and fault are 17.33% and 7.51%, respectively. If the threshold is defined as 70%, the percentage of correct detection days for the weighted is 44.44% and 8.34% higher than that of the unweighted. If the threshold is defined as 60%, the percentage of correct detection days of weighted is 22.22% and 16.66% higher than that of unweighted.
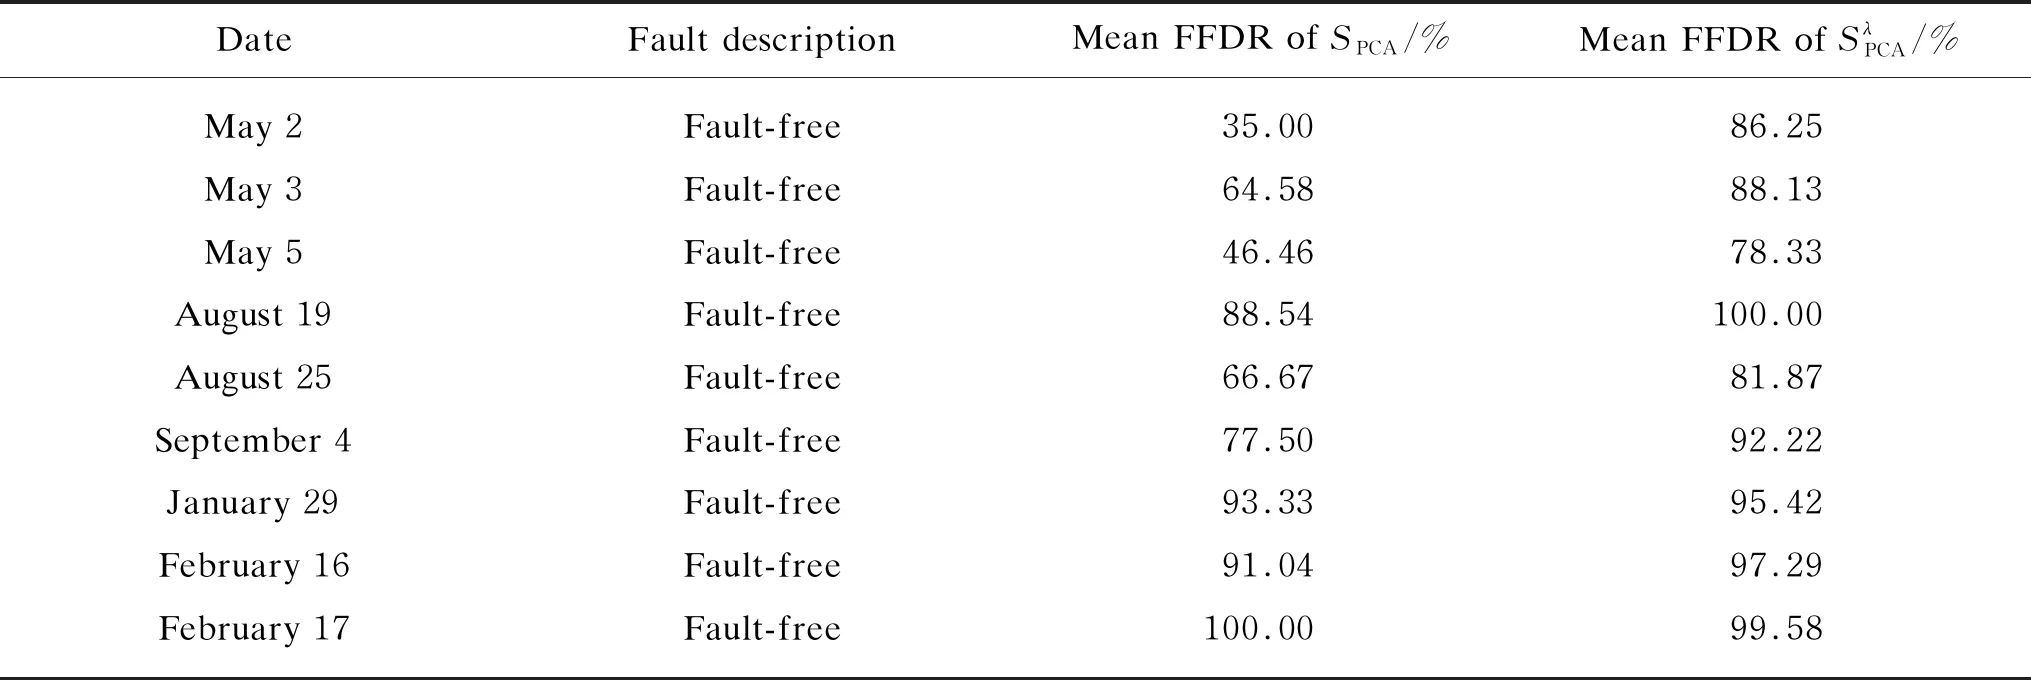
Table 2 Comparison of fault-free detection results of two SFs
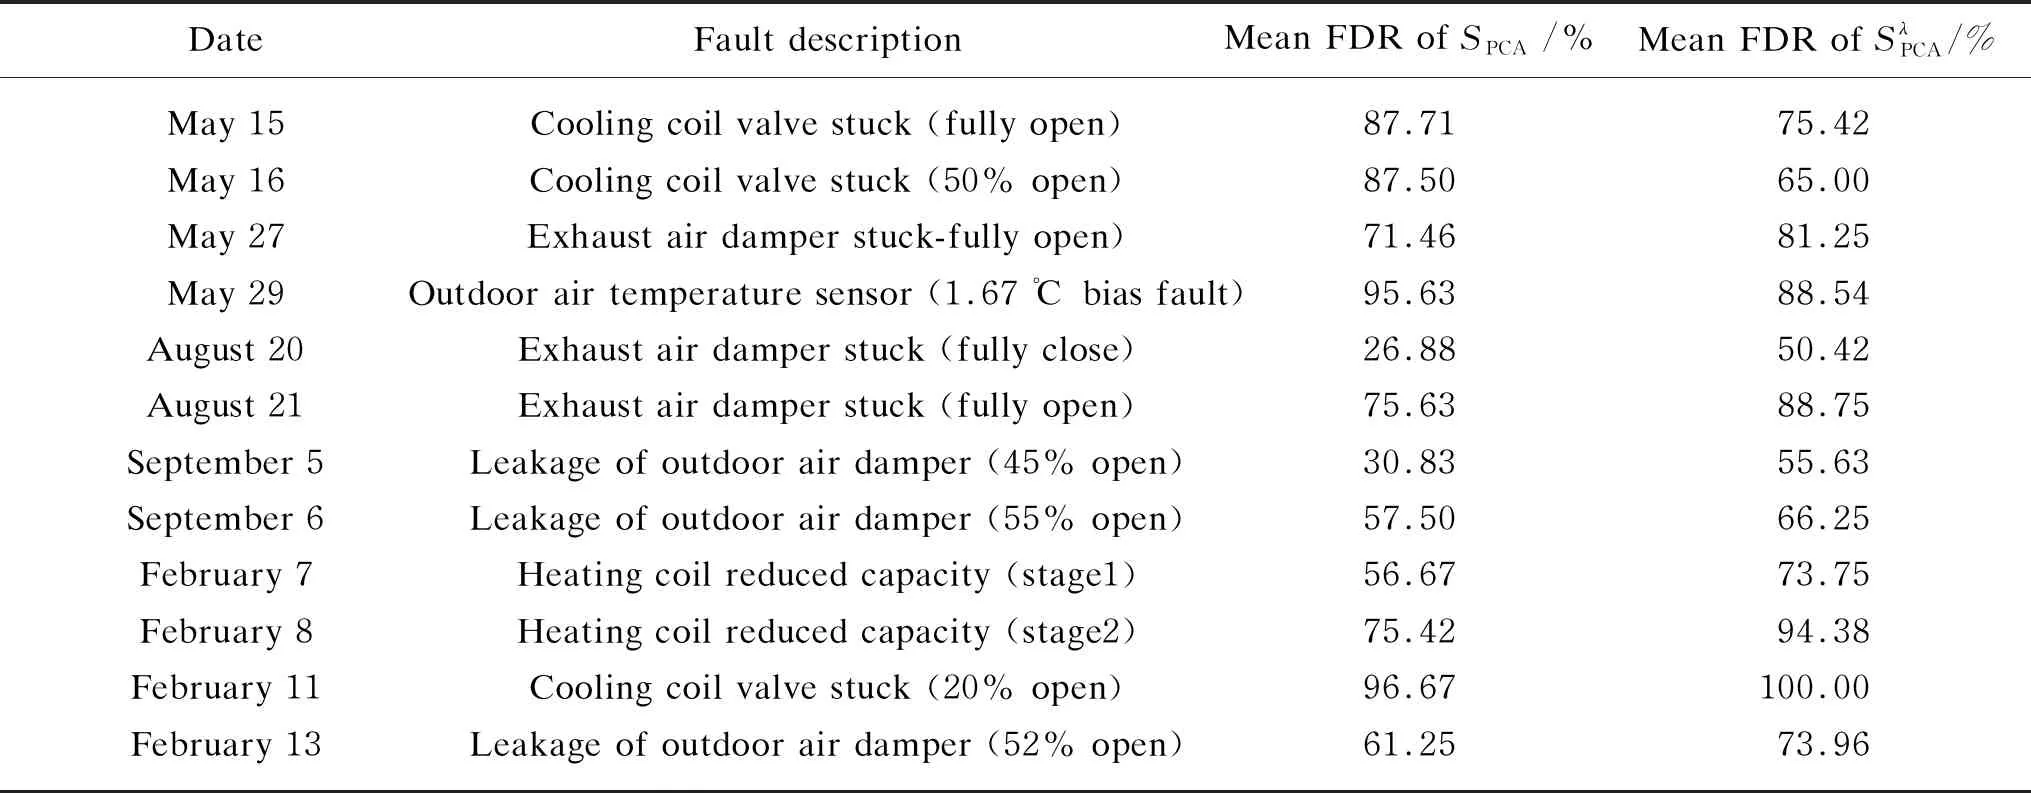
Table 3 Comparison of fault detection results of two similarity factors
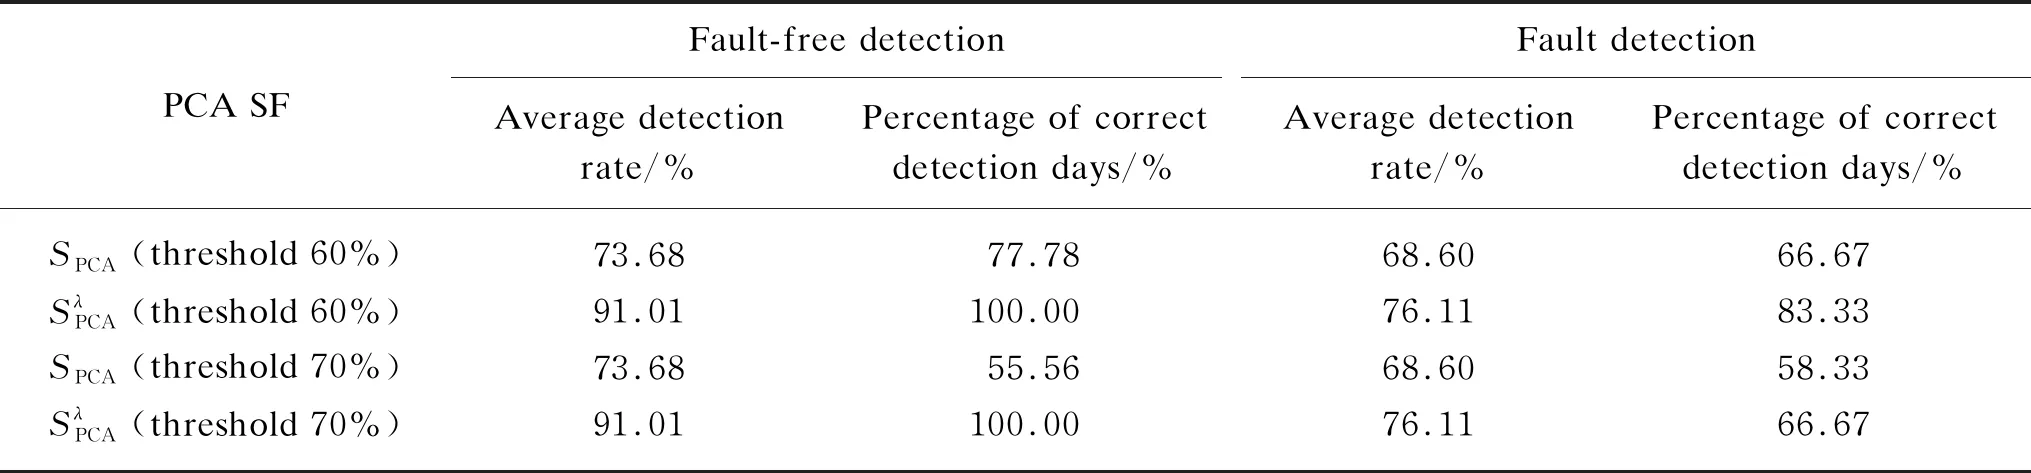
Table 4 Evaluation of fault-free and fault detected rates of two SFs
5 Conclusions
This paper compares two methods for calculating PCA SFs: unweighted and weighted. The weighted SF takes into account the difference of each principal component weight and uses the square root of eigenvalue of each principal component to assign the weight. Both methods are combined with PCA for fault detection in air conditioning systems. The main conclusions are as follows.
(1) Considering the square root errors to represent the difference between the principal components, the weighted SF presents much better fault-free and fault detection effects than the unweighted.
(2) Compared with the unweighted, the average fault-free detection rate and the average fault detection rate are 17.33% and 7.51%, which are higher than the unweighted SF, respectively.
(3) If the threshold is 70%, the percentages of correct fault-free and fault detection days of the weighted are 44.44% and 8.34% higher than that of the unweighted. If the threshold is 60%, the percentages of correct fault-free and fault detection days of the weighted are 22.22% and 16.66% higher than that of the unweighted.
 Journal of Donghua University(English Edition)2021年3期
- Journal of Donghua University(English Edition)的其它文章
- Hardware-in-the-Loop Simulation of Vibration Control of Stay Cables with Damper Based on dSPACE System
- One Class of the Least Congruences on Completely Regular Semigroups
- Abundant Exact Solutions for Differential-Difference Equations Arising in Toda Mechanics
- Linear Dynamical System over Finite Distributive Lattice
- Optimal Reactive Power Compensation of Distribution Network to Prevent Reactive Power Reverse
- Raoultella terrigena RtZG1 Electrical Performance Appraisal and System Optimization