Discharge characteristic of very high frequency capacitively coupled argon plasma?
2021-09-28 02:18:04GuiQinYin殷桂琴JingJingWang王兢婧ShanShanGao高閃閃YongBoJiang姜永博andQiangHuaYuan袁強華
Chinese Physics B 2021年9期
Gui-Qin Yin(殷桂琴),Jing-Jing Wang(王兢婧),Shan-Shan Gao(高閃閃),Yong-Bo Jiang(姜永博),and Qiang-Hua Yuan(袁強華)
Key Laboratory of Atomic and Molecular Physics&Functional Materials of Gansu Province,College of Physics and Electronic Engineering,Northwest Normal University,Lanzhou 730070,China
Keywords:very high frequency discharges,capacitively coupled plasma,particle-in-cell/Monte-Carlo collisions
1.Introduction
The plasma-enhanced chemical vapor deposition(PECVD)is widely applied to the film deposition,surface modification,etc.due to a high plasma density and a low ion bombardment energy which are conducive to achieving reasonable processing rate and less damage to the substrate.[1–3]Some researches[4]have shown that the high driving frequency of capacitively coupled plasma(VHFCCP(30 MHz–300 MHz))system has some advantages over traditional 13.56-MHz capacitive discharge,which can generate unique gas-phase chemistry and have different processes of excitation,dissociation,and ionization.[5]These sources are beneficial to controlling the morphology of film.[6–8]
Lieberman et al.[9]analytically solved the full set of Maxwell’s equations and found that when the driving frequency is very high,there are three factors,i.e.,the standing wave effect,the skin effect,and the edge effects,which affect the plasma uniformity.Han et al.[10]used a fiber Bragg grating sensor and a hairpin resonance probe to observe the standing wave effect through experiments of the VHF-CCP.Wilczek et al.[11]found that the plasma density increased with the driving frequency increasing in a step form because two energetic electron beams were generated at the edge of sheath,and that the electronic heating mode changed from theα-mode into a low-density resonant heating mode.The higher the harmonics in the bulk plasma,the more the heated low-energy electrons will be.[12]Meanwhile,Sarveshwar Sharma et al.[12]also found a similar phenomenon,that is,the plasma density increased by increasing the discharge voltage at a pressure of 5 mTorr(1 Torr=1.33322×10²Pa).In addition,Sarveshwar et al.[13]showed the influence of driving frequency on the ion energy distribution function under similar conditions.[13]Their research indicated that the plasma density and ion energy could be controlled separately through adjusting the driving frequency and voltage.
Amanatides et al.[14]found that as frequency rises,the electron drift velocity and electron density increase.Ahn et al.[15]found that when the frequency is lower(9 MHz–27.12 MHz),the electron temperature increases,but the electron density is almost the same or decreases in the capacitively coupled discharge.Zhu et al.[16]found that at fixed radio frequency(RF)power,the electron density increased with the driving frequency increasing,and then was saturated after transition frequency.Above this transition frequency,all electron densities keep unchanged at the frequency ranging from 13.56 MHz to 156 MHz in capacitively coupled argon plasmas.Abdel-Fattah[17]discussed the discharge characteristics of helium plasma at different frequencies(13.56 MHz–96 MHz).The plasma density and electron temperature reached their corresponding maximum values when the frequency was between 27 MHz to 56 MHz,then they showed a downward trend with frequency increasing.The EEPF at a low frequency of 13.56 MHz was Maxwellian and changed into a bi-Maxwellian in the middle frequency range and recovered to Maxwellian distribution at a frequency above 76 MHz.At low pressure in VHF,the long mean free path,nonlocal and nonlinear dynamics changed the electron distribution.These parameters such as densities,fluxes,temperatures,and power densities were related to discharge characteristic.[18]Simulation results[19]showed that as the frequency rises,the standing wave effect becomes distinct and the surface wavelength decreases sharply.Whereas,the change of sheath width showed the opposite trend.The transient electric field was observed and created higher harmonics in the bulk plasma.The plasma density and the electron temperature showed a nonlinear change with the increase of discharge voltage,and the two change trends were opposite.[20]At present,the discharge mechanisms in VHF-CCP are not very well understood due to their complex non-linear behavior.Thus,the investigation of plasma discharge parameters in VHF-CCP is very crucial for further applications.
In this paper,the influences of drive frequency and power on electron density and temperature of argon VHF-CCP are investigated.The Ar plasma is generated in the PECVD reactor at a gas pressure of 40 mTorr.The power varies from 20 W to 70 W.The RF source works at 13.56 MHz,40.68 MHz,94.92 MHz,and 100 MHz,respectively.The mean electron temperature and electron density are calculated by using the spectral intensity of the Ar spectral line.The PIC/MCC module is used to simulate the electron density,electric potential distribution,and EEPF under the experimental conditions.
2.Experimental equipment
Figure 1 shows the schematic of our CCP reactor,which is similar to that described in detail in Ref.[21].So,our reactor is described briefly here in this work.The PECVD chamber is composed of a stainless steel chamber whose length and width were both 23 cm and whose height was 22 cm.Plasma was generated between two square plate electrodes,each square side being 15-cm long.The spacing between the two plate electrodes is 2 cm.In this work,the RF power is applied to the upper electrode,while the lower electrode and the reactor wall are both grounded.The argon gas flow rate was fixed at 30 sccm(Here,sccm stands for standard cubic centimeter per minute)by the gas mass flowmeter.The gas pressure was 40 mTorr that was controlled by the gas system consisting of four reading systems.The optical emission spectra were measured by using Avaspec-2048-8 spectrometer and the measured spectrum intensity was fed into the computer.

Fig.1.Schematic diagram of capacitively coupled plasma reactor.
3.Method
3.1.Calculated method of electron temperature
In a local thermodynamic equilibrium plasma,the value of electron excitation temperature(Texc)satisfies the following equation:

Here,Iijis the spectral line intensity,λijis the wavelength,giis the statistical weight of the upper level,Aijis the radiative transition probability,k is the Boltzmann constant,Texcis the electron excitation temperature,and C is a constant.The slope of the Boltzmann equation can be used to calculate the electron excitation temperature Texc.[22,23]
In a non-local thermodynamic equilibrium state plasma,the electron temperature(Te)is different from the electron excitation temperature(Texc).In this case,the EEPF divergence caused by Maxwellian and excitation/de-excitation mechanisms might not be controlled exclusively by electronic collisions.The electron impact excitation/de-excitation follows corona balance.The electron temperature can be obtained by the modified Boltzmann method of corona balance.[22,24]The corona balance is defined by the following equation:[25–27]

where X1iis the rate coefficient describing electron impact excitation from the ground level 1 to level i,[28–30,32]∑i>jAijis the accumulative transition probability for spontaneous emission from the higher level i to all the other lower levels j,and Ne,N1,Niare the electron density,ground level population density,and excited state population density,respectively.
The Nican be given from

where hc0/4πλijis the energy gap between levels i and j,and Iijis relative intensity of photons per unit volume between the energy levels i and j.Note,we suppose the plasma is optically thin.
Furthermore,X1ican be expressed as a simple expression related to Te[28–32]

Using Eqs.(2)–(4),we can obtain the following equation to solve Te:
where D is a constant.
3.2.Method of calculating electron density
In the plasma,the change in the spectral line intensity,caused by the absorption and emission process,can be described by the following equation:[33]
Here,kλ(λ)is the absorption coefficient and jλ(λ)is the emission coefficient which is an important decisive parameter of these processes,[34]and Iλ(λ)is the spectral intensity.
Under the experimental conditions of this work,the plasma can still be considered optically thin.So we ignore the self-absorption and then equation(6)can be simplified into


and

Based on the above derivation,equation(8)can be written as
A solution with physical meaning can be obtained through Eq.(11)as follows:[36]

3.3.Simulation method
The electric potential distribution,the EEPF,and the electron density are simulated by using the model of particlein-cell/Monte-Carlo collisions(PIC/MCC).The model is developed in the Vsim 8.0 simulation package,and the 1D3V and electrostatic model are used in the simulation here in the present study.The spacing between the electrodes is 2 cm and the simulation region is divided into a grid consisting of 400 cells.The background neutral gas temperature is fixed at 300 K.Charged particles,e and Ar+,are used as macro particles in the calculation.A macro particle represents 5×10⁵real particles initially.What is more,the particle merging algorithm may be used when the macro particle number exceeds a certain value.It is assumed that both electrodes can perfectly absorb the electrons and ions,and that their secondary electrons are ignored.The code takes into account the important collision types which are presented in Table 1.[37]The cross sections used in the above reactions are cited from the LXCat database.
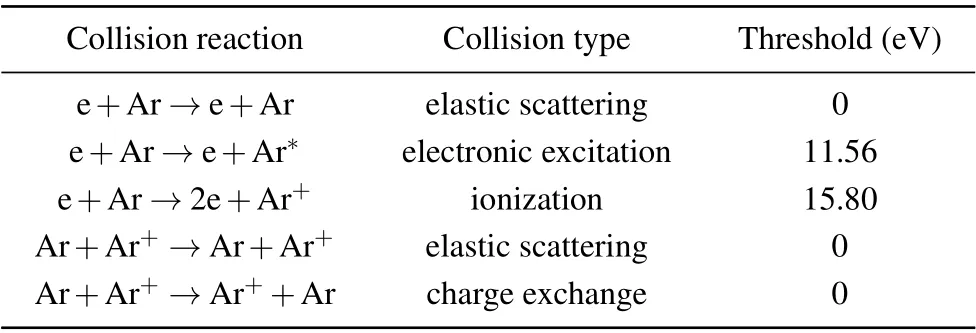
Table 1.All collision reactions,collision types,and their corresponding threshold values,the considered in the model.
4.Results and discussion
4.1.Experimental results
Figure 2 shows the optical emission spectra of the argon plasma at power 50 W,frequency 40.68 MHz,and gas pressure 40 mTorr.The electron temperatures are determined by Eq.(5)through selecting Ar spectral lines as indicated in the following Table 2.
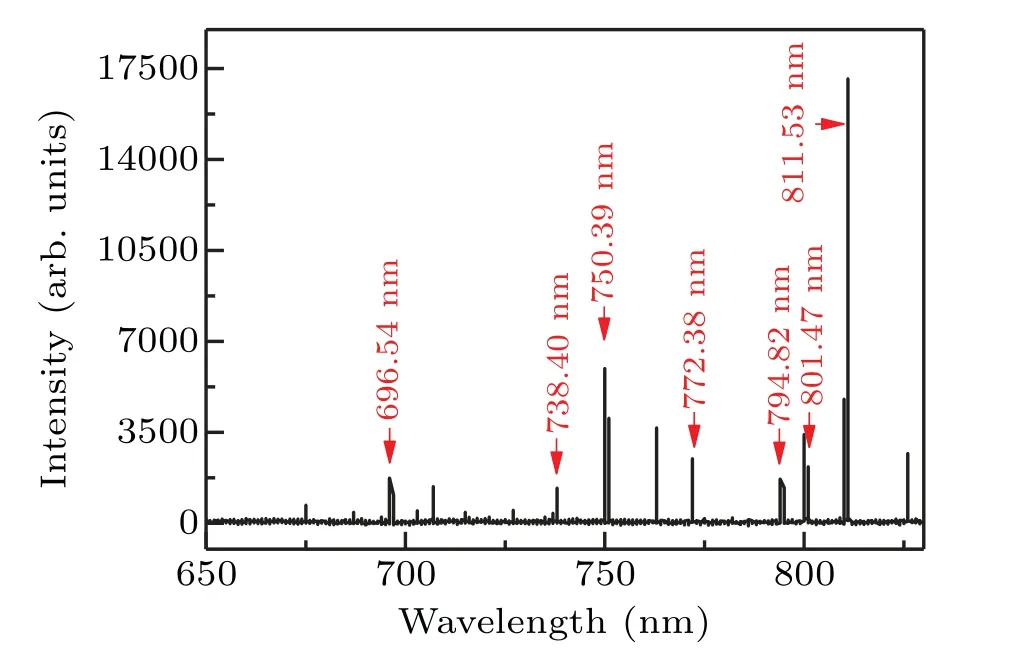
Fig.2.Optical emission spectra of argon at power 50 W,frequency 40.68 MHz,and pressure 40 mTorr.
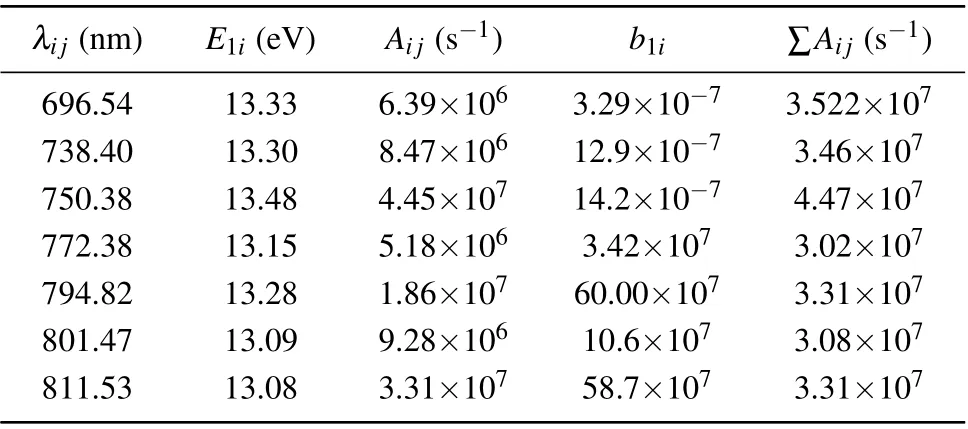
Table 2.Data of Ar spectral lines.[28]
Figure 3 shows the variations of electron temperature with power at four different frequencies and 4 mTorr.The results clearly show the electron temperatures decrease with the increase of power at different frequencies.Moreover,the electron temperature decreases more obviously with the increase of power at frequency 40.68 MHz.The electron temperature decreases more slowly when frequency is higher(94.92 MHz and 100 MHz),and the electron temperature of 94.92 MHz is almost the same as that at 100 MHz.There is a transition temperature when the frequency is 13.56 MHz.This phenomenon can be explained by the fact that the electron density is low when the power is low,so the electron mean free path is longer and the electron energy comes from the electrical field of sheath.As the power increases,the electron density increases.The collisions between electrons and neutral gas become more frequent,which leads the electron to lose energy and lower temperature.

Fig.3.Variations of electron temperature with power at four different frequencies and gas pressure 40 mTorr.
The change trend of the electron temperature is consistent with the experimental conclusion given by Ahn et al.[15]There are disparate heating mechanisms in the cases of 94.92 MHz and 100 MHz because of electromagnetic effect.The electron temperature of 40.68 MHz is higher than those at other frequencies under the same power value.
Figure 4 shows that the electron densities increase with the increase of power at four different frequencies when the gas pressure is 4 mTorr.The electron densities increase with the increase of power and decrease with the increase of frequency in low frequencies(13.56 MHz and 40.68 MHz).The electron densities increase with the increase of power when the frequencies are high(94.92 MHz and 100 MHz).They have no big changes at 94.92 MHz or at 100 MHz,which is similar to the scenario of electron temperature.This is mainly due to the fact that more energy will be produced with power increasing,thereby increasing the probability of collisions between particles,and the ionization rate as well.Therefore,the electron density increases with the augment of power.
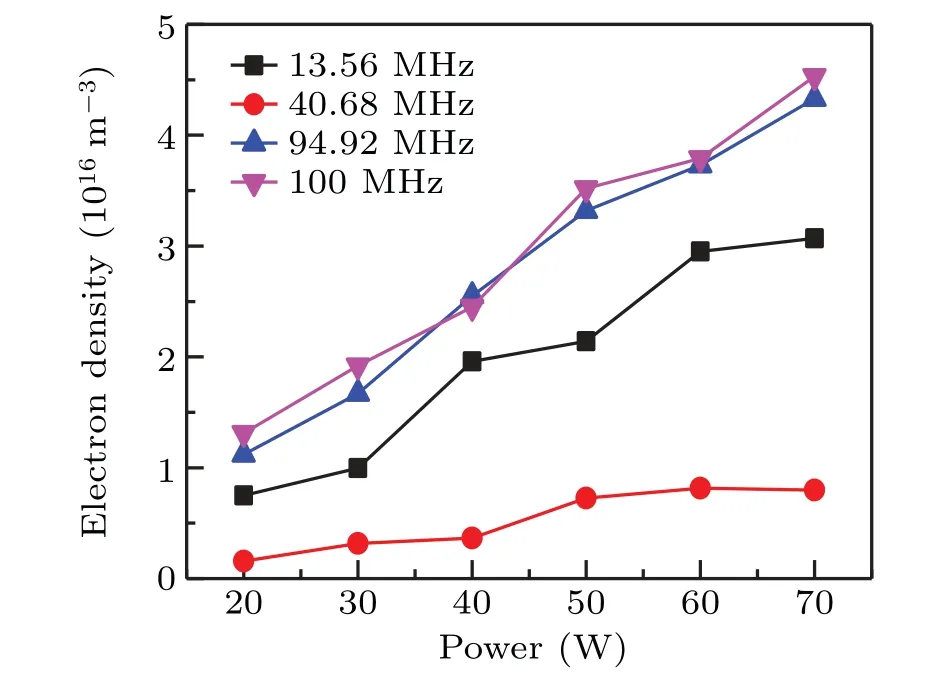
Fig.4.Variations of electron density with power at four different frequencies and gas pressure 40 mTorr.
4.2.PIC/MCC simulation results
Figure 5 shows the variations of electron density in the discharge center with power at four different frequencies and gas pressure 40 mTorr,obtained by PIC/MCC simulation.The variation trends are the same as those of experimental results.The electron density increases as the driving frequency increases.The results are in agreement with those given by Tagra et al.[38]
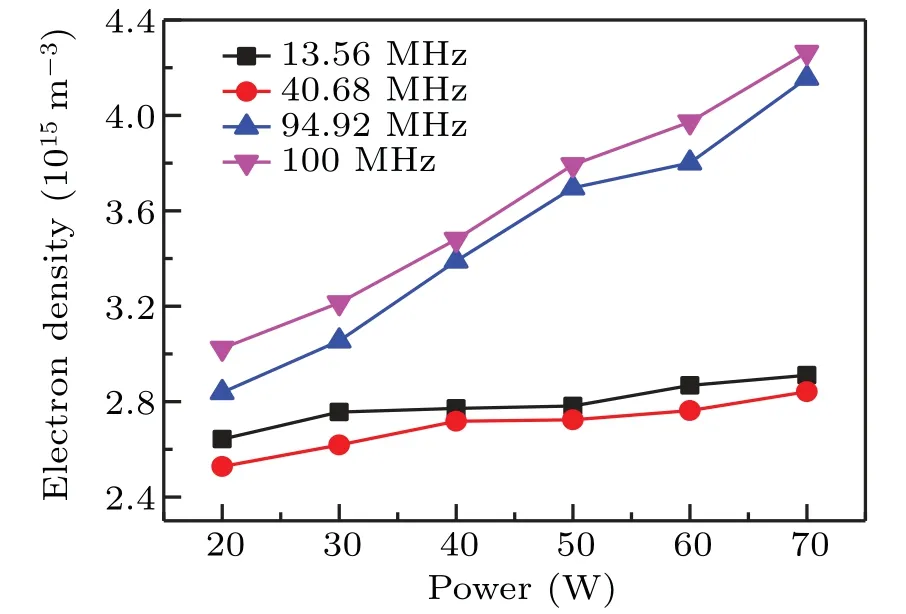
Fig.5.Variations of simulated electron density with power at four different frequencies and gas pressure 40 mTorr.
Figures 6(a)and 6(c)describe the electric potential distributions of various frequencies at 30 W and 60 W when the gas pressure is 40 mTorr.The electric potential of the bulk plasma at 40.68 MHz is lower than that at low frequency 13.56 MHz.The electric potential of the bulk plasma at 100 MHz is higher than those at remaining frequencies.Figures 6(b)and 6(d)show the electric potential distributions as a function of power at 40.68 MHz and 100 MHz,respectively,when the gas pressure is 40 mTorr.When the frequency is 40.68 MHz,the electric potential of the bulk plasma increases from 18 V to 77 V with power increasing from 20 W to 70 W as indicated in Fig.6(b).It can also be observed that the sheath width increases with the increase of power.The stochastic heating dominates when power is low.The wider sheath leads the ionization rate to increase,so the electron density increases with power increasing.
Figures 7(a)and 7(c)show the EEPFs at 30 W and 60 W for different driving frequencies when the gas pressure is 40 mTorr.The EEPF of 13.56 MHz and 40.68 MHz are both bi-Maxwellian with a large population of low-energy electrons.The high-energy electron population at 94.92 MHz and 100 MHz are significantly higher than at lower frequencies(13.56 MHz and 40.68 MHz).The EEPF of 94.92 MHz and 100 MHz are almost the same and both are nearly Maxwellian with a large population of high-energy electrons.

Fig.6.Electric potential distributions at(a)30 W and(c)60 W for four different frequencies,and(b)40.68 MHz and(d)100 MHz for different power values.

Fig.7.Electron energy probability functions at(a)30 W and(c)60 W for different frequencies,and(b)40.68 MHz and(d)100 MHz for different power values.
Figures 7(b)and 7(d)display the EEPFs as a function of power at 40.68 MHz and 100 MHz when the gas pressure is 40 mTorr.In the case of 40.68 MHz,the high-energy electron population increases with the the augment of power.By contrast,low-energy electron population does not change significantly.Nevertheless,the EEPF is basically unchanged with the increase of power in the case of 100 MHz.The trend of EEPF of 13.56 MHz and 94.92 MHz are similar to the EEPF of 40.68 MHz and 100 MHz,respectively.
Furthermore,comparing with the case of 13.56 MHz,the high-energy electron population of 40.68 MHz is high.This means that the average energy of electrons at 40.68 MHz is larger than at 13.56 MHz.
5.Conclusions
The discharged characteristics of VHF capacitively coupled argon plasma are studied through optical emission spectra and PIC/MCC.The influence of driving frequency and power on electron density and electron temperature at a low pressure of 40 mTorr are discussed.As the power increases,the mean electron temperature shows a downward trend and the electron density shows an upward trend.However,their change trends are nonlinear with frequency.When the frequency is lower,the mean electron temperature increases,and the electron density decreases as the frequency increases.When the frequency is higher,the electron temperature starts to drop and the electron density rises as frequency increases.At 94.92 MHz and 100 MHz,the obtained electron densities are the same,so are the electron temperatures.The electron temperature goes up to a maximum value and the electron density comes down to a minimum value when the driving frequency is 40.68 MHz.From the simulation results,the generation of the transition frequency(40.68 MHz)is mainly due to the changes of the potential distribution and EEPF of the argon plasma,which lead to the transition of electron heating mode.These discharge characteristics and related parameter settings of RF argon plasma provide a reference for plasma etching and other relevant applications.
- Chinese Physics B的其它文章
- Origin of anomalous enhancement of the absorption coefficient in a PN junction?
- Protection of isolated and active regions in AlGaN/GaN HEMTs using selective laser annealing?
- First-principles study of plasmons in doped graphene nanostructures?
- Probing thermal properties of vanadium dioxide thin films by time-domain thermoreflectance without metal film?
- An improved model of damage depth of shock-melted metal in microspall under triangular wave loading?
- Signal-to-noise ratio of Raman signal measured by multichannel detectors?