Numerical simulation of ultrashort-pulse reflectometry (USPR) on EAST
2023-12-18 03:54:52XiaofengYU俞瀟烽RanCHEN陳冉XiaoliangLI李小良YilunZHU朱逸倫CalvinDOMIERXingleiRUAN阮行磊TaihaoHUANG黃泰豪JinGUO郭晉ZiyuLIN林子鈺GuoshengXU徐國盛ShifengMAO毛世峰NevilleLUHMANNJRandMinyouYE葉民友
Plasma Science and Technology 2023年12期
Xiaofeng YU (俞瀟烽) ,Ran CHEN (陳冉) ,Xiaoliang LI (李小良),* ,Yilun ZHU (朱逸倫) ,Calvin W DOMIER ,Xinglei RUAN (阮行磊) ,Taihao HUANG (黃泰豪),Jin GUO (郭晉),Ziyu LIN (林子鈺),Guosheng XU (徐國盛),Shifeng MAO (毛世峰),Neville C LUHMANN JR and Minyou YE (葉民友),*
1 School of Nuclear Science and Technology,University of Science and Technology of China,Hefei 230026,People’s Republic of China
2 Institute of Plasma Physics,Chinese Academy of Sciences,Hefei 230031,People’s Republic of China
3 University of California at Davis,1 Shields Avenue,Davis CA 95616,United States of America
Abstract The microwave reflectometer is a popular non-intrusive plasma density diagnostic instrument on tokamaks that provides centimeter and millisecond level resolution.The ultrashort-pulse reflectometer (USPR) achieves plasma density measurement by emitting a chirped wave containing a broadband signal and measuring the time of flight from different frequency components.A USPR system is currently being built on EAST (Experimental Advanced Superconducting Tokamak) to meet the needs of diagnostic of the pedestal density evolution,such as high-frequency small edge-localized modes.In order to predict the density reconstruction of the EAST USPR system,this work presents a numerical simulation study of the beam propagation of the chirped wave of extraordinary waves (X-mode) in the plasma based on Python.The electron density profile has been successfully reconstructed by the reflection signal interpretation.The small gap between the right-hand cut-off layer and the electron cyclotron resonance layer,due to the low plasma density on the plasma edge,causes unexpected leakage from the transmitting microwave beam to the pedestal and the core region.This kind of‘tunneling’ effect will cause the reflected signal to have energy loss in the low-frequency band.The study also discusses the influence of the poloidal magnetic field on the reflected signal.The spatial variation of the poloidal magnetic field will lead to the conversion between extraordinary(X) waves and ordinary (O) waves,which leads to energy loss in the reflected signals.The simulation results show that the‘tunneling’effect and the O-X mode conversion effect have little effect on the EAST USPR system.Therefore,the currently designed transmit power meets the working requirements.
Keywords: reflectometer,pedestal density profile,beam mode conversion
1.Introduction
The reflectometer is a well-established diagnostic for measuring electron density profiles and fluctuations in magnetic confinement plasmas [1].In microwave reflectometry,broadband electromagnetic waves propagate into the plasma.The wave propagation will be reflected on the cut-off layer,related to frequency,and received by a microwave detector.The plasma properties along the propagation path can be inferred from the phase delay or flight time of the electromagnetic waves [1-5].
Compared with swept-frequency reflectometers,the ultrashort-pulse reflectometer (USPR) provides another solution for high temporal resolution density measurement with certain advantages [6].An ultrashort pulse is generated and launched to plasma by the USPR transmitter.The pulse with narrow time width causes a broadband frequency probing beam.The single ultrashort pulse provides the full frequency coverage for a wider range of density measurement [7].Since the broadband microwave frequencies are generated quasisimultaneously,this provides incomparable high temporal resolution for density profile evolution measurement,such as edge-localized modes [8].Therefore,ultrashort-pulse reflectometry can improve the spatiotemporal resolution of plasma diagnosis.References [3] and [4] give a comprehensive introduction to reflectometers.Plasma reflectometers enable diagnosis by detecting the phase delay and time of flight(TOF)of reflected electromagnetic waves.Electromagnetic waves in magnetized plasmas have two fundamental modes,ordinary(O) wave and extraordinary (X) wave.The electric field polarization direction of the ordinary mode is parallel to the external magnetic field,while the electric field polarization direction of the extraordinary mode is perpendicular to the external magnetic field.There are two cut-off frequencies for the extraordinary mode,known as left-hand cut-off frequenciesωL=-ωce/2+,and right-hand cut-off frequenciesωR=ωce/2+,whereωceis the electron Larmor frequency andωpeis the plasma frequency[9,10].Based on the observed relation between frequencies and the corresponding time delays (or phase changes),the plasma density profile or magnetic field profile can be inferred[11,12].
In this paper,we discuss the numerical simulation of the USPR on EAST.We hope to use the simulation program to predict the results of density reconstruction before experiments,and estimate the possible impact of some physical effects on the results.We introduce the EAST ultrashort-pulse reflectometer system,numerical calculation model and inversion algorithm based on the research in section 2.Section 3 presents the 1D and 2D simulation results based on our test density profiles and their comparison.Section 4 introduces the simulation results of ultrashort-pulse microwave based on the EAST real density profile and magnetic field profile,and interprets and analyzes the influences of tunneling effect and O-X-mode conversion effect on the reflected signal.Section 5 summarizes the main results and briefly discusses our future work plan.
2.USPR system and numerical model
2.1.EAST’s USPR system
The EAST USPR system,as shown in figure 1,is composed of a baseband transmitter,millimeter-wave subsystem,receiver and multiple-channel TOF electronics modules.The baseband transmitter can generate 3-4 ns duration chirp with frequencies spanning 10-17 GHz [13,14].In the millimeter-wave (mmwave) subsystem,the transmitted chirps are generated by frequency multiplying the baseband chirp,and launched into plasma.The reflected signal is then received and downconverted back to microwave (5-18 GHz) frequencies.The receiver is composed of a 16-channel high-resolution receiver and two 8-channel standard resolution receivers.The TOF of reflected signals is simultaneously measured at multiple frequencies by a filter and a TOF module.
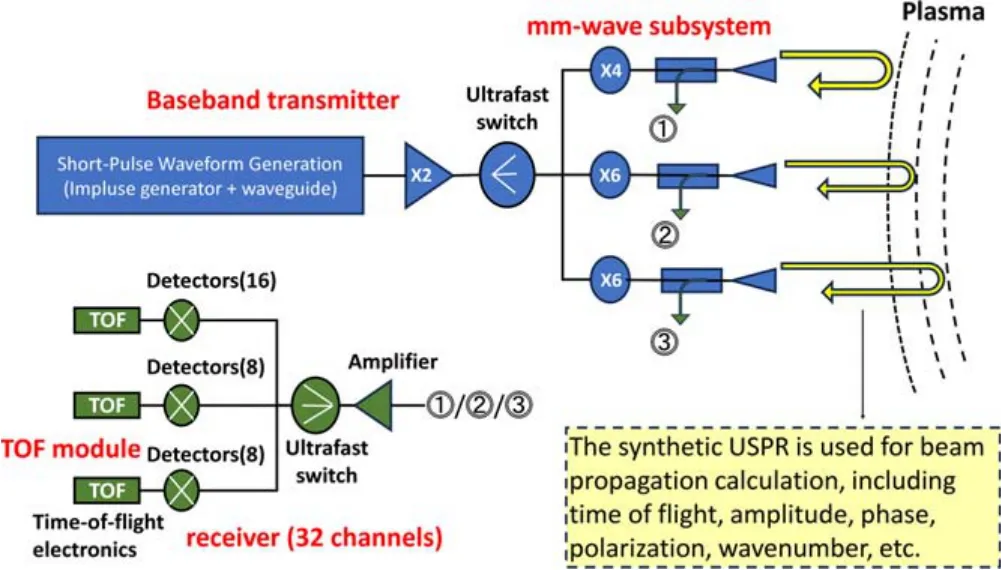
Figure1.System of the EAST USPR containing four modules:baseband transmitter,mm-wave subsystem,receiver and TOF module.
2.2.Numerical model
The propagation of ultrashort pulsed microwaves in plasma can be described by the electric field wave equation (derived from Maxwell’s equations [15]) under the cold plasma approximation:

In some previous studies,in the process of component expansion of the above equations,the third term (divergence term)of the electric field wave equation is directly component expanded.The result of this treatment is that the system of equations will contain the spatial second-order mixed partial derivatives of the electric fieldand[18,19].The test results show that this easily brings about numerical instability,resulting in the divergence of the electric field during the propagation process,as shown in figure 2.To solve the problem,we use the Gauss theorem of the electric field in Maxwell’s equations,express the third term (divergence term) as the density perturbation of the plasma,and introduce the plasma continuity equation in the form of perturbation to describe the time evolution of density perturbation,which is as follows:

Figure2.Numerical instability caused by a spatial second mixed partial derivative(arbitrary unit).These three figures show the cross-section of a 2D wave packet at different times.(a)Normal Gaussian wave packet when t=0,(b)significant instability occurs when t=145,(c)the field is completely divergent when t=160.
The system of equations (2)-(4) can also fully describe the propagation of the electric field in the plasma,and the test results in figure 3 show that the instability in figure 2 can be eliminated.
2.3.Inversion algorithm
The USPR system performs density reconstruction by interpretation of the TOF of microwaves of different frequencies in the plasma.The density inversion algorithm used in the model is based on the formula for calculating the TOF of microwaves in the plasma:
wherevgis the group velocity of the microwave,xc(ω) is the position of the cut-off layer of the microwave at each frequency andτ(ω) is the flight time of the microwave at each frequency in the plasma.For the ordinary mode,Its form is relatively simple.Using the Abel transform,the density inversion formula can be obtained:
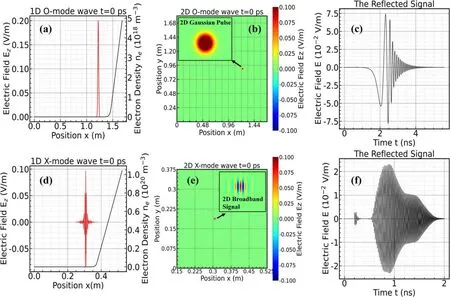
Figure4.Initial signal and density profile.(a)Initial O-mode pulse of 1D simulation and electron density profile,(b)initial O-mode pulse of 2D simulation,(c)reflected signal of O-mode,(d)initial X-mode pulse of 1D simulation and electron density profile,(e)initial X-mode pulse of 2D simulation,(f) reflected signal of X-mode.
For extraordinary waves,the form ofvgis very complicated,so there is no simple inverse transformation in analytical form,and the density inversion formula can only be obtained numerically [17]:
3.Simulation result and data interpretation
When testing 1D and 2D simulation programs,we set the plasma density profile to a monotonically increasing distribution.The density profile chosen is,
wherex0is a reference point,ne0is a reference electron density andLsis a scale length for the profile.In 2D simulations,the density profile is simplified to be uniform in the y direction,i.e.the plasma curvature is not considered.The magnetic profile chosen is,
whereB0is a reference magnetic field andLbis a scale length for the profile.We set the incident microwave of the O-mode to a simple Gaussian wave packetE(x,t=0)=exp[ -(x-xp)2/](1D simulation) andE(x,t=0)=exp{ -[(x-xp)2+(y-yp)2]/}(2D simulation),wherexpandypcorrespond to the initial position of the wave packet andpτis the spatial broadening of the wave packet [19].The X-mode incident microwave uses the same Gaussian wave packet setting,but uses a numerical filter to filter out components below 52 and above 92 GHz (the USPR system is operated in X-mode with frequency coverage from 52-92 GHz),see figures 4(a) and (b) for the O-mode,and figures 4(d)and(e)for the X-mode.The O-mode and X-mode microwaves are simulated by 1D and 2D programs,and in these programs the perfect absorption boundary is set so that no microwave will be reflected by the boundary.Figures 4(c)and(f)show the reflected signals of the O-mode and X-mode microwaves,respectively.
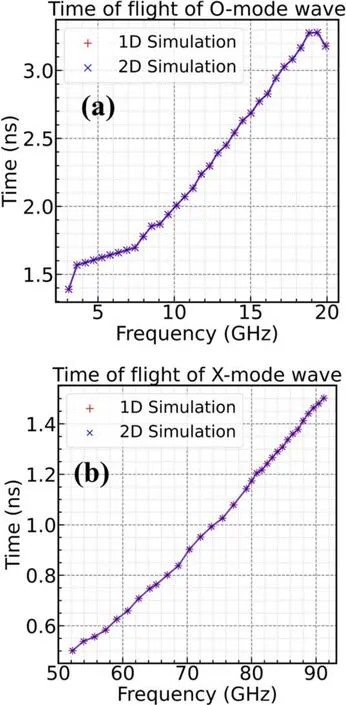
Figure5.Comparison of TOF versus frequency between 1D and 2D simulations for (a) O-mode and (b) X-mode waves.
The reflected signal is filtered by a numerical filter to obtain the TOF of microwaves of different frequencies in the plasma.Figure 5(a) shows a comparison of the frequencydependent TOF for the O-mode microwaves in the plasma between 1D and 2D simulations (The low-frequency microwave is reflected from the exponential density profile,and the high-frequency microwave is reflected from the linear density profile so that there is a turning point in figure 5(a)near 7 GHz).Figure 5(b) is the comparison of the results for the X-mode microwaves.It can be seen that the results of 1D simulation and 2D simulation are identical.Therefore,in the following research,we mainly use a 1D simulation program with less computational complexity.
4.Simulation based on the EAST density profile
4.1.Simulation results
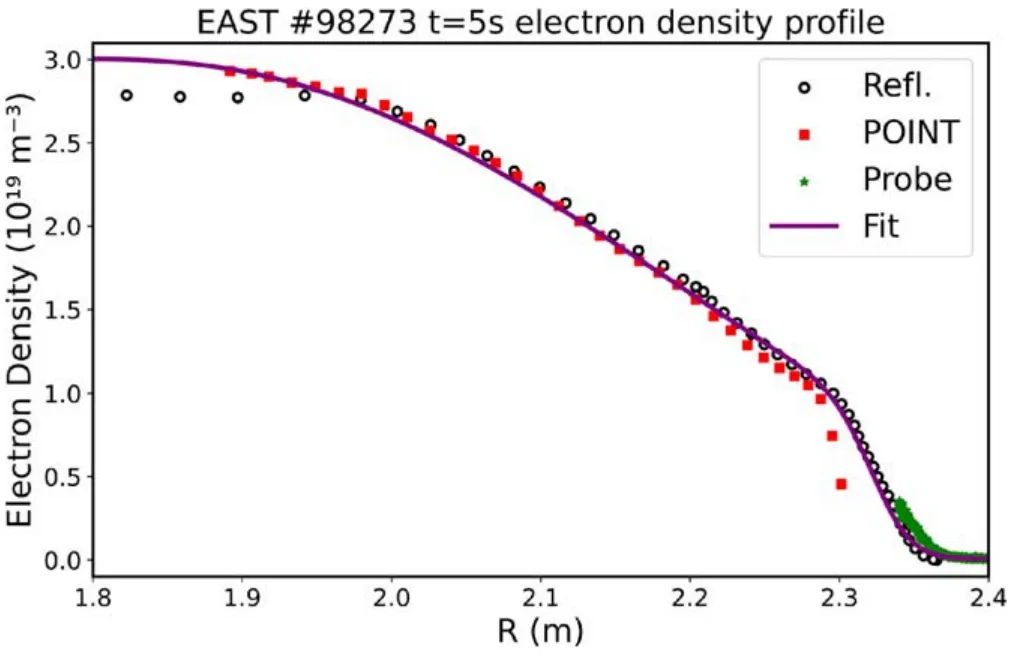
Figure6.Electron density profiles of EAST based on the fitting of data from three diagnostic devices.Black circle: data from sweptfrequency reflectometry.Red square:data from POINT(Polarimeter INTerferometer).Green star: data from probe.Purple solid line:fitted density profile.
A typical plasma electron density profile covering the core,pedestal and scrape-off layer (SOL) is shown in figure 6(purple curve),which is obtained in EAST shot #98273 based on the joint calibration of the data from three diagnostic devices.The following numerical simulations of the propagation of the ultrashort pulsed microwaves are performed based on this profile.
Figure 7 shows some initial profile settings for the simulation.Figure 7(a) is the plasma density profile set based on the fitting results of figure 6 and we do not consider the case of density perturbations here,figure 7(b)is the plasma toroidal magnetic field profile,figure 7(c) is the spatial distribution of the cut-off frequency of the ordinary mode and the left-hand and right-hand cut-off frequencies of the extraordinary mode,figure 7(d) is the spatial distribution of the incident X-mode microwave and its corresponding right-hand cut-off frequency.In order to mimic the simulation of the actual USPR system,a numerical filter is used in the program to filter the incident X-mode microwaves so that the frequency components included are in the range of 52-92 GHz.
Figure 8 shows the obtained simulation results.Figure 8(a)is the reflected signal received by the detector,figure 8(b)is the variation of the TOF of the microwave in the plasma with the frequency obtained after filtering.The reflected signal can be roughly divided into three parts,namely I,II and III in figure 8(a).Among them,part I is the earliest,which corresponds to part B in figure 8(b),and its reflection area is the pedestal area where the plasma density increases rapidly.The reflection of part III is the latest,which corresponds to part A in figure 8(b),and its reflection area is the SOL area with low plasma density.Part II corresponds to part C in figure 8(b),and its reflection area is approximately the core area.Figure 8(c)is the inversion density obtained using the density reconstruction algorithm,which can be well matched with the density profile that we set.
4.2.Tunneling effect
The energy spectrum of the initial wave and the reflected wave(see figure 8(a))is compared in figure 9.It is found that for microwaves with a frequency higher than 50 GHz,the energy is almost completely reflected,but for microwaves with a frequency lower than 50 GHz,the energy reflection ratio decreases with the decrease in the microwave frequency until almost no reflection occurs.
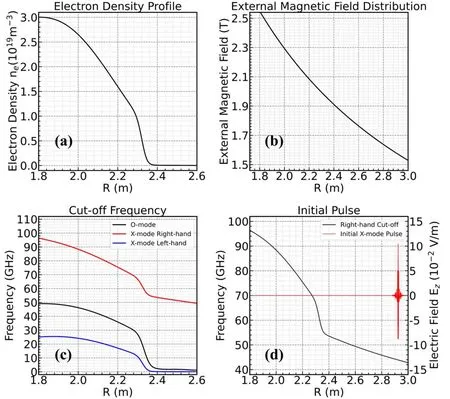
Figure7.Initial setting of simulation.(a) Electron density profile,(b) toroidal magnetic field distribution of EAST at It=11024.1 A,(c) O-mode and X-mode cut-off frequency distributions,(d) initial X-mode pulse and its cut-off frequency profile.
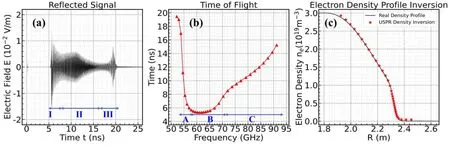
Figure8.Simulation result.(a) Reflected signal of the USPR,(b) TOF as a function of frequency,(c) electron density profile inversion.
After testing the evolution process of microwaves of various frequencies in the plasma,it is found that a considerable part of the energy of microwaves with frequencies below 50 GHz passes through the cut-off point and continues to propagate into the core area without reflection as occurs in tunneling.

Figure9.Tunneling effect phenomenon.(a)Energy spectrum of reflected signal,(b)energy spectrum of transmitted signal,(c)the green part in (b).Black solid line: the energy spectrum of incident signal.Red solid line: the energy spectrum of reflected/transmitted signal.Blue dotted line:50 GHz.Microwave on the left side of the blue dotted line(frequency <50 GHz)will undergo obvious tunneling,while the right side (frequency >50 GHz) will not.
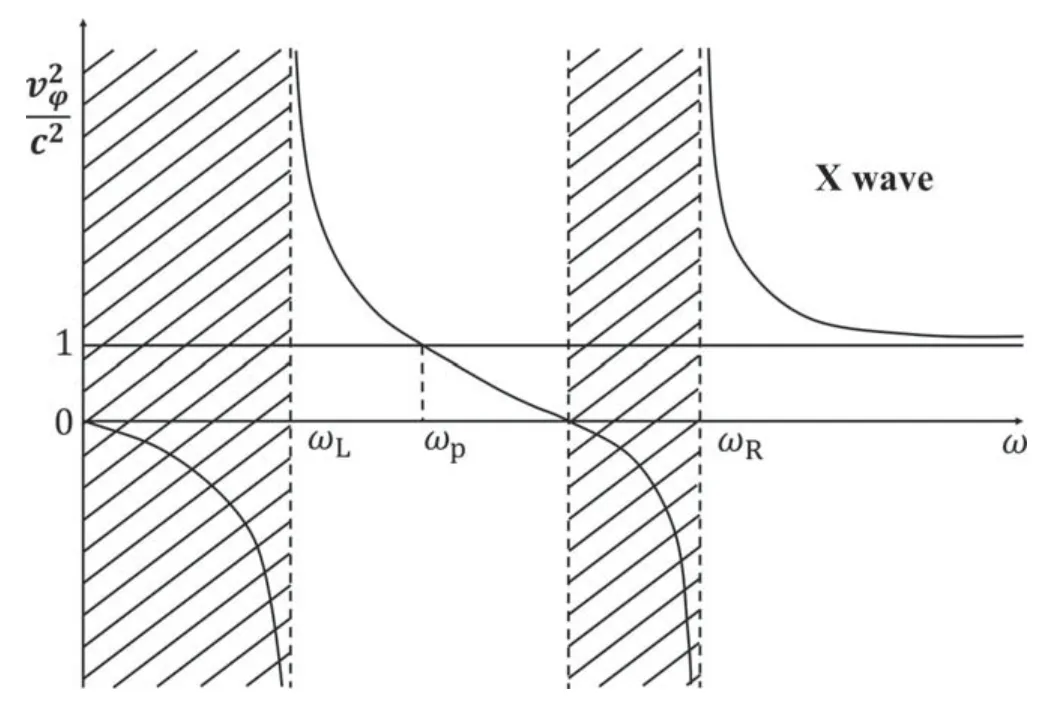
Figure10.Dispersion relation (phase velocity) of extraordinary mode wave.Wave cannot travel in shaded areas.
The explanation of this phenomenon should start from the dispersion relationship of extraordinary waves.Figure 10 shows the dispersion relationship of extraordinary waves in plasma [9],whereωRcorresponds to the cut-off point of microwave,andωhcorresponds to the resonance point of microwave.After the X-mode microwave reaches its cut-off point,its wave vector ?kbecomes a pure imaginary number,and after the microwave passes through the resonance point,its wave vector becomes a real number again.Thus,the decay of the microwave occurs in the region between the cut-off point and the resonance point (We call this area the ‘actual decay layer’),and the microwave energy will be reflected at the cut-off point,which is exactly the physical principle on which the reflectometer is based.In this study,microwaves with frequencies lower than 50 GHz have their reflection points in a region with very low plasma density so that their cut-off points are very close to the resonance points.In this case,some microwaves have already passed through the resonance points before they decay to zero,and enter the area that can normally propagate forward again so that this part of the energy that has not completely decayed can no longer be reflected.Therefore,the spatial proximity of the resonance point and the cut-off point in the low-density plasma region is the main reason for the tunneling effect.
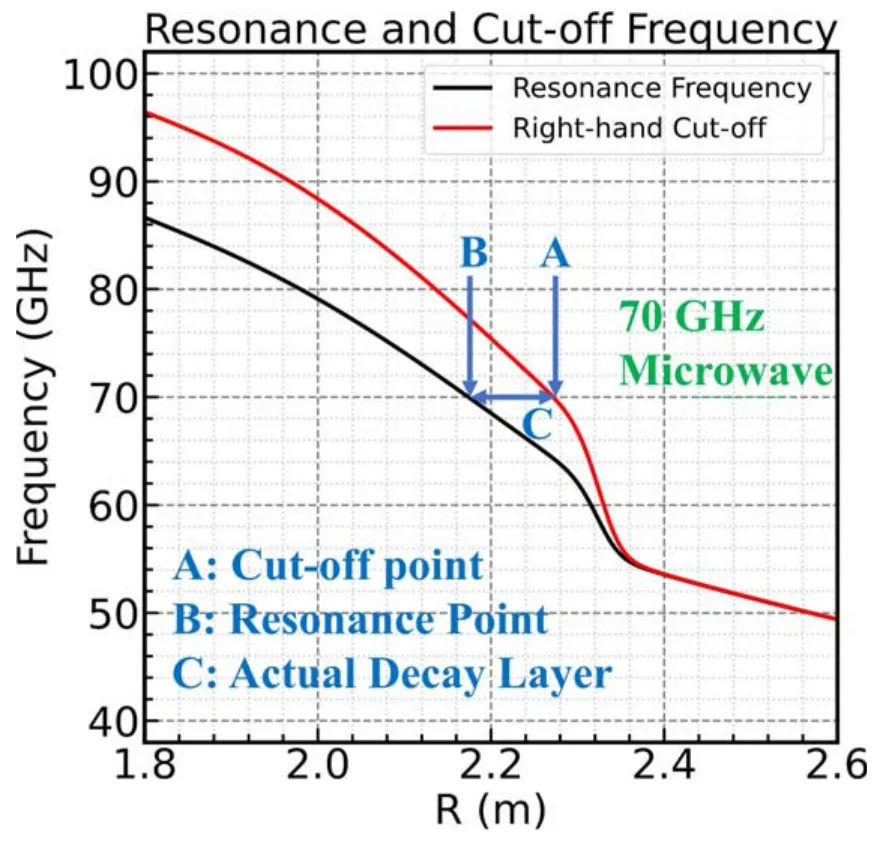
Figure11.Resonance point,cut-off point and actual decay layer for 70 GHz wave.
We also give a theoretical calculation based on this explanation.Figure 11 shows the right-hand cut-off frequency distribution and resonant frequency distribution corresponding to the profile set in our simulation.In this figure,we take 70 GHz microwave as an example to show its cut-off point,resonance point and the so-called actual decay layer.According to the dispersion relation of X-mode wave,
We can obtain its wave vector:
When the microwave enters the actual decay layer,the square of the wave vector becomes a negative number,and the wave vector becomes a pure imaginary number:
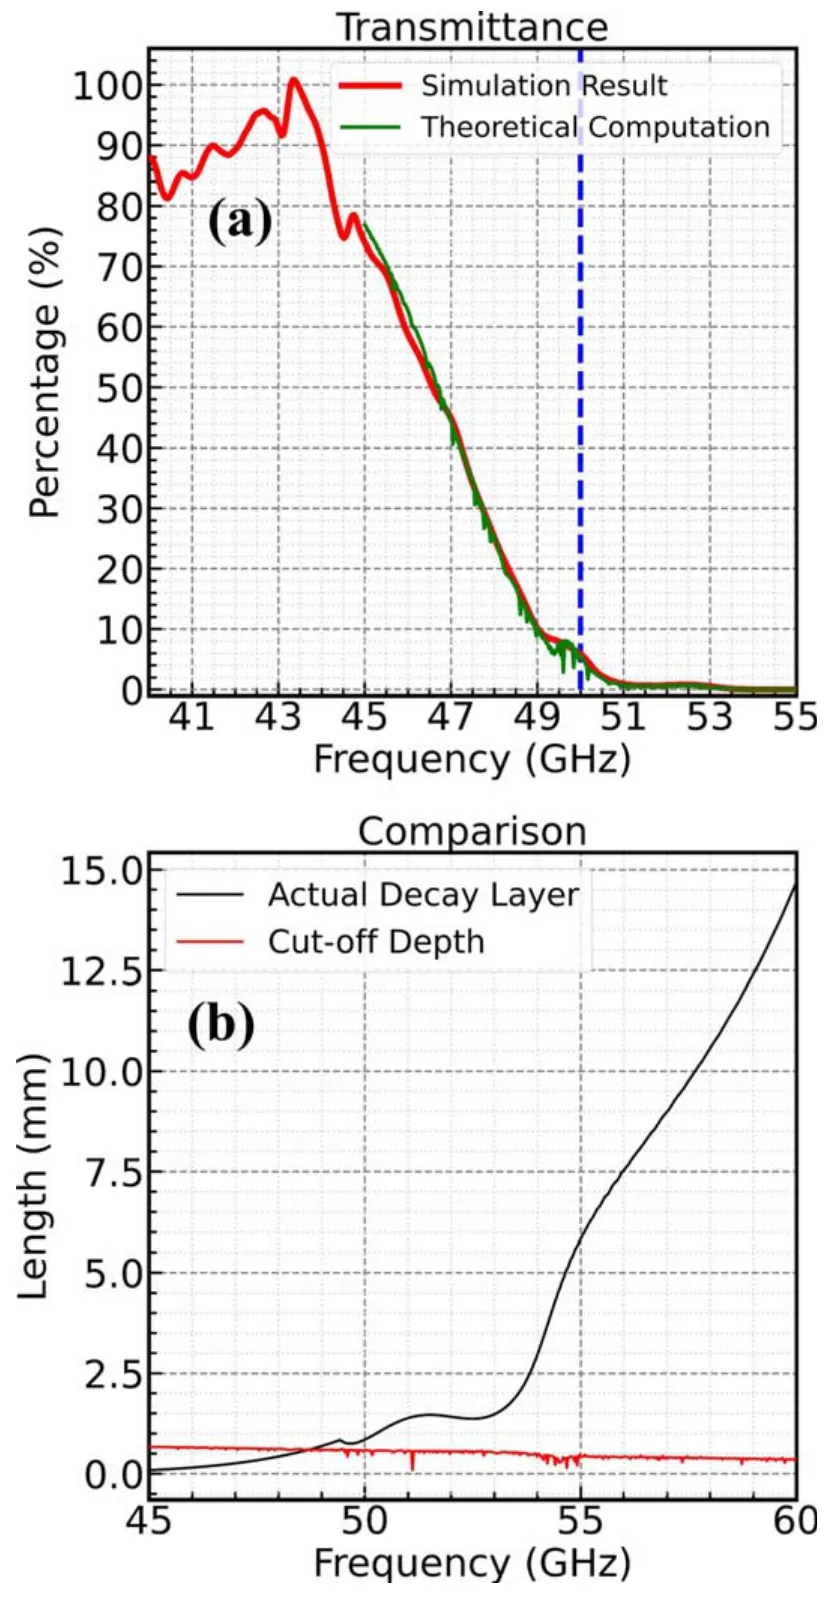
Figure12.Theoretical explanation for the tunneling effect.(a)Comparison of theoretical value and simulation results of microwave transmittance,(b)comparison between the actual decay layer and the cut-off depth.
We consider a beam of plane waves:
In the actual decay layer,
Whereαis the decay constant (α=α(x)is an x-dependent function),
We can calculate the average value ofαin the actual decay layer by integrating,
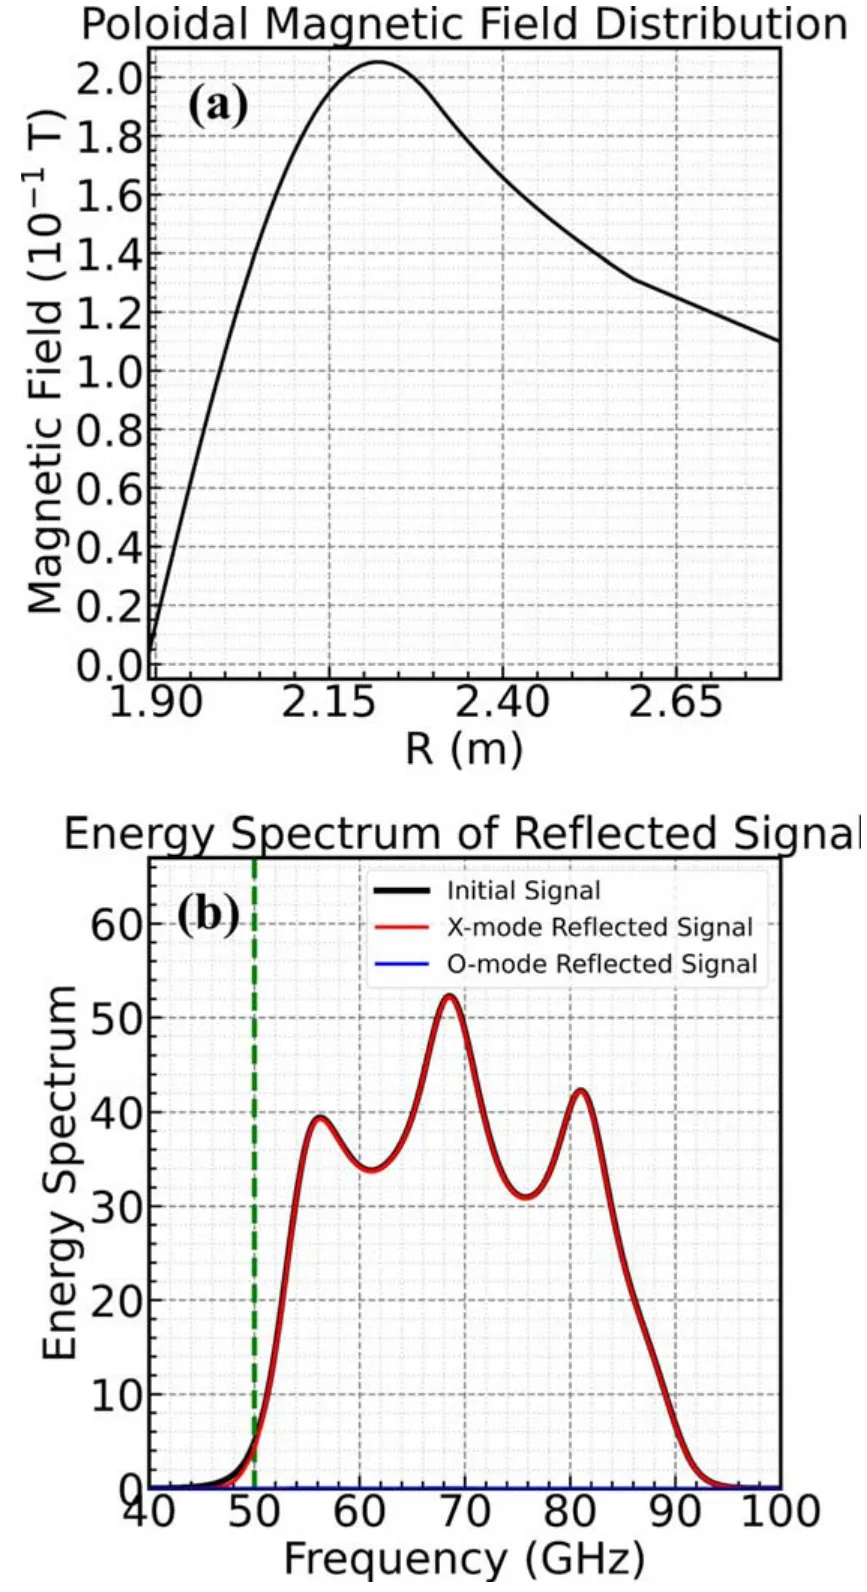
Figure13.O-X-mode conversion.(a) Poloidal magnetic fielddistribution,(b) energy spectrum of reflected signal.Green dotted line: 50 GHz.
In this way,the microwave after passing through the decay area can be estimated by the following formula:
Thus,the energy transmittance is,
We can obtain the energy transmittance calculated by equation (18),and compare this result with the energy transmittance we obtain by simulation (calculated using the data in figure 9(b)).This result is shown in figure 12(a),and these two transmittance results fit well.
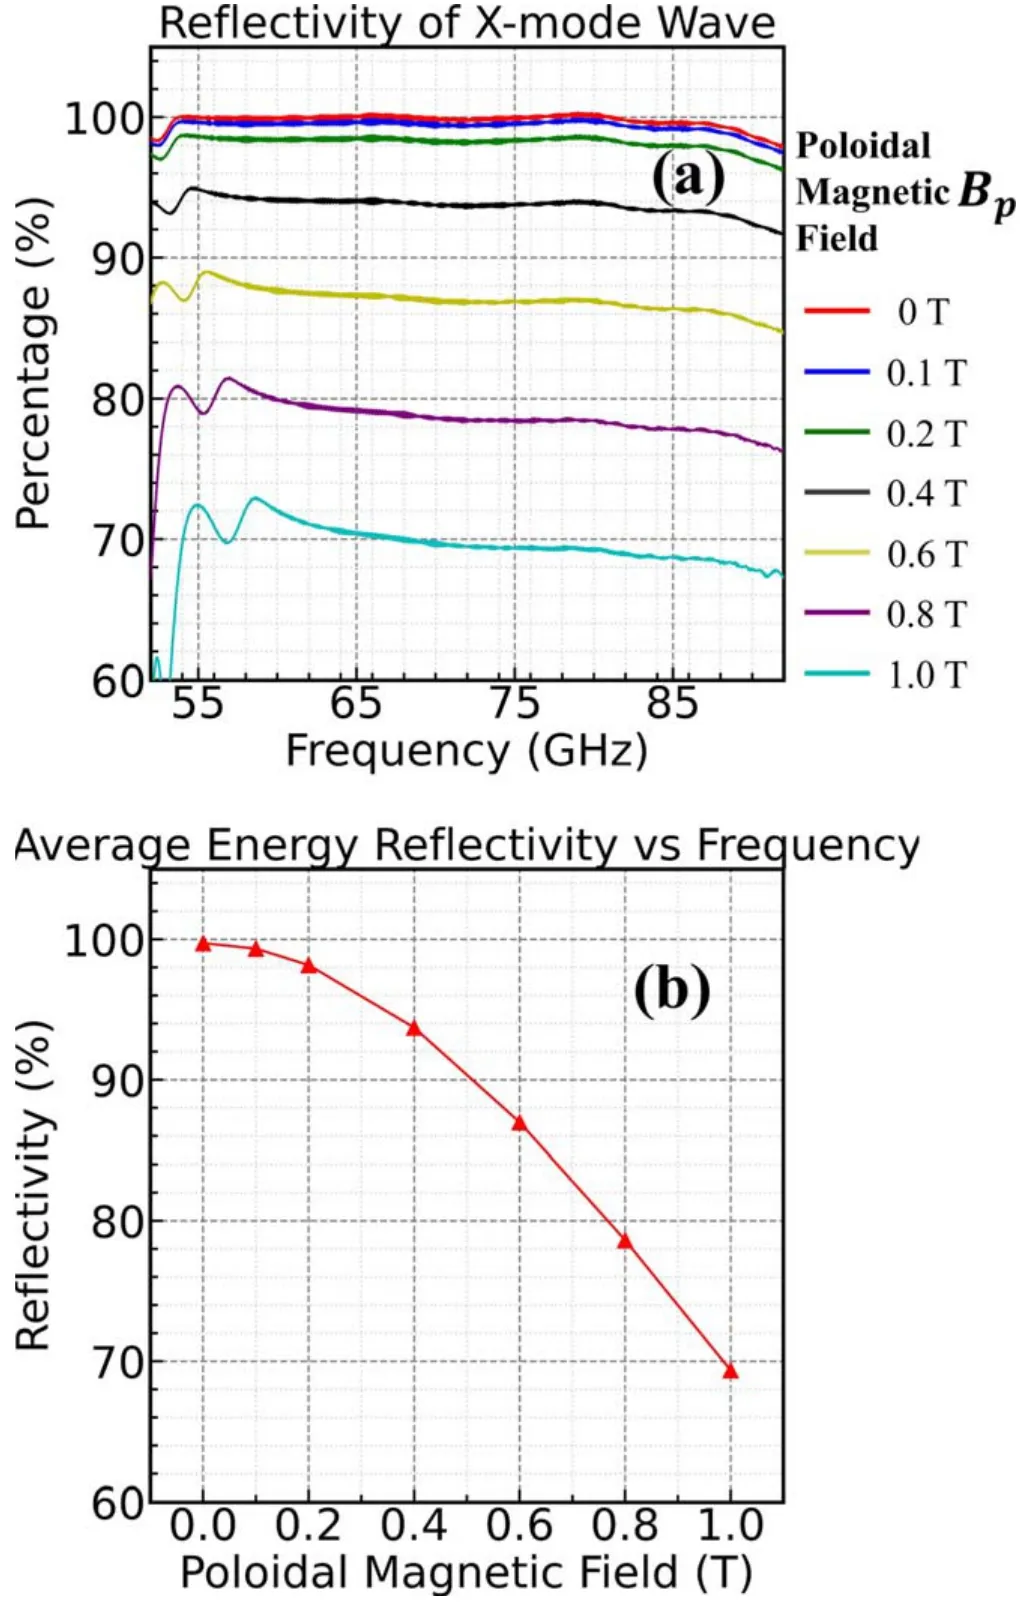
Figure14.Results of X-mode reflectivity under poloidal magnetic field scanning.(a) Reflectivity of X-mode wave,(b) average energy reflectivity versus frequency.
According to the decay constant α,we can define a cut-off depth δ to roughly estimate the decay length of microwaves:
This means that the microwave needs to travel a distance of δ in the actual decay layer to complete the attenuation.Ifδ?xcut-xresonant,which means that the actual decay layer is thick enough so that the microwave will decay to zero before reaching the resonant point and all energy will be reflected.Ifδ≈ or>xcut-xresonant,the actual decay layer is thin,the microwave cannot fully decay.Thus,some energy will pass through the resonance point,and this is what we called the tunneling effect.The comparison between the actual decay layer and the cut-off depth is shown in figure 12(b).
For EAST’s USPR system,its operating frequency is 52-92 GHz.For microwaves in this frequency band,energy tunneling hardly occurs,so this effect will not affect the operation of the current USPR system.However,this effect should be taken into account if the USPR system is to be extended to the lower-frequency band in the future,in order to have the ability to diagnose lower-density plasma regions,and the corresponding band may require higher-power microwave sources and a more sensitive microwave detector.
4.3.O-X-mode conversion
In the EAST plasma,there is not only the external toroidal magnetic field,but also the poloidal magnetic field generated by the plasma current and poloidal field coils.Both magnetic fields vary with the radius.The USPR system of EAST adopts the working mode of the X-mode.As the emitted microwaves continue to propagate into the plasma,the total magnetic field will rotate to a certain extent so that the components of the X-mode will be partially converted into the O-mode,which results in a certain loss of microwave energy received by the detector[20].Generally speaking,the more severe the spatial variation of the poloidal magnetic field,the more obvious this energy loss will be.This study also uses the developed program to simulate the propagation of microwave signals considering the influence of the EAST poloidal magnetic field,and analyze the influence of the conversion between the O-mode and the X-mode on the energy loss of the reflected signal.Figure 13 shows the poloidal magnetic field distribution of EAST and the simulated spectrum of the reflected signal.Figure 13(a) is the poloidal magnetic field profile of EAST shot#98273 in the equilibrium calculated by the equilibrium fitting code program,and figure 13(b) shows the reflected signal energy spectrum obtained under this poloidal magnetic field setting.It can be seen that most of the energy is still received by the detector in the form of X-mode,indicating that the O-X conversion effect has little effect on the energy loss of the reflected signal.
We keep the shape of the poloidal magnetic field profile in figure 13(a) unchanged,and scan the maximum value of the poloidal magnetic field.The relationship between X-mode microwave reflectivity and frequency is obtained under different poloidal magnetic field settings,as shown in figure 14(a).We calculated the relationship between the average energy reflectivity of 52-92 GHz X-mode microwaves and the maximum value of the poloidal magnetic field,as shown in figure 14(b).
5.Summary and future work
In this study,a numerical simulation program for microwave signal propagation was developed for EAST’s USPR system,and the plasma continuity equation was introduced into its numerical model to avoid the numerical instability that may be caused by spatially mixed partial derivatives.Under a simple test profile,the results of the 1D simulation program and the 2D simulation program are compared,and it is verified that the 1D simulation results are consistent with the 2D simulation results.Based on the plasma density profile,toroidal magnetic field profile,and poloidal magnetic field profile of EAST shot#98273,the 1D simulation of the X-mode microwave in the operating frequency band of the USPR system was carried out.The density profile obtained from the simulated reflected signal using the density reconstruction algorithm reproduces the input profile well.Through the spectrum analysis of the reflected signal,it is found that the energy reflectivity of the microwave below 50 GHz is reduced due to the tunneling effect.We give a theoretical explanation for this phenomenon,and the results of theoretical calculations are in good agreement with the simulation results.At the same time,the concept of cut-off depth δ that we introduced can be a criterion to judge whether the tunneling effect will occur.This effect will not have a great impact on the current operating frequency band of the USPR system,but would affect the low-band extension of the diagnostic if the lower limit of the plasma density needs to be improved.Spectral analysis also shows that the energy loss of the reflected signal due to the O-X-mode conversion effect caused by the poloidal magnetic field is negligible.We also scan the poloidal magnetic field,and give the average reflectivity of X-mode microwaves under different poloidal magnetic fields.
In this study,the computation model that we used is based on cold plasma approximation.In order to achieve a more realistic simulation of the microwave propagation in the plasma,pressure and temperature effects will be added to the model in our future work.In addition,we found that the largescale density fluctuation will have a great impact on the simulation results.Large-scale density disturbances appear when pellets are injected into the plasma,which can lead to TOF diagram distortion and incorrect density inversion.However,with some processing it is possible to find the location of the greatest density perturbation,as preliminary analysis shows,which would provide a possible way to find the location of the projectile injection deposit.Since these topics are beyond the scope of this paper,we will perform comprehensive research and analysis combined with relevant experimental data in the future.
Acknowledgments
This work was supported by the National Magnetic Confinement Fusion Energy R&D Program of China (No.2019YFE03030004) and National Natural Science Foundation of China (No.12005144).
 Plasma Science and Technology2023年12期
- Plasma Science and Technology的其它文章
- Automatic recognition of defects in plasmafacing material using image processingtechnology
- Physics design of 14 MeV neutron generator facility at the Institute for Plasma Research
- Matrix effect suppressing in the element analysis of soils by laser-induced breakdown spectroscopy with acoustic correction
- Minimum inhibitory but maximum nonhemolytic concentration of plasma-treated catheters coated with L.tridentata and O.vulgare extracts
- Plasma synthesis of various polymorphs of tungsten trioxide nanoparticles using gliding electric discharge in humid air:characterization and photocatalytic properties
- Effect of different process conditions on the physicochemical and antimicrobial properties of plasma-activated water