Determination of Pyrogallol Using Reversed-phase HPLC and Internal Standard Method
2015-11-06 08:52:52ZHANGLiangliangWANGYongmeiXUManCHENJiahong
生物質化學工程 2015年2期
ZHANG Liang-liang,WANG Yong-mei,XU Man,CHEN Jia-hong
(Institute of Chemical Industry of Forest Products,CAF;National Engineering Lab.for Biomass Chemical Utilization;Key and Open Lab.of Forest Chemical Engineering,SFA;Key Lab.of Biomass Energy and Material,Jiangsu Province,Nanjing 210042,China)
Pyrogallol(1,2,3-trihydroxy benzene),a polyphenol has been exploited in a variety of industrial sectors,for example,as a developer in photography,a mordant for wool,a stain of leather,and used in engraving process,making colloidal solutions of metals,the manufacture of various dyes and the dyeing of fur and hair,etc.In addition,it is used as a reagent for analyzing antimony and bismuth and an active reducer for gold,silver,and mercury salts.In gas analysis,it is used for absorption of oxygen[1-2].Pyrogallol is industrially produced by autoclaving from gallic acid which is obtained from tannins under strong acidic conditions.The literature survey revealed that a few high performance liquid chromarography(HPLC)methods were applicable in analysis of pyrogallol[3-4].A spectroflurimetric method has been developed for the determination of pyrogallol in natural samples[5].There is no report on the HPLC determination of pyrogallol in pyrogallol products.The present investigation describes a precise,accurate,and robust RP-HPLC method for the determination of pyrogallol.
1 Experimental
1.1 Chemicals and reagents
Methanol,HPLC grade,Tianjin Jiangfeng Reagent Corporation;trifluoroacetic acid(TFA),HPLC grade,Aladdin Industrial Corporation,Shanghai;water,HPLC grade,obtained from a Milli-Q water purification system;the pyrogallol and ellagic acid of reference standards,Aladdin Industrial Corporation,Shanghai.
1.2 Apparatus and chromatographic conditions
Chromatographic separation was performed on a SHIMADZU liquid chromatographic system(SHIMADZU Corporation,Japan)equipped with a LC-20AB solvent delivery unit(pump)and UV detector.The separation column was a Thermo Hypersil C18column(250 mm ×4.6 mm,5 μm)under ambient temperature.The mobile phase was composed of methanol and water(0.1%TFA)and the flow rate was 1 mL/min.The gradient conditions were 80%water for 5 min,then 60%water for 5 min,40%water for 15 min.Injection volume was 20 μL and UV detection was performed at 266 nm[6].The peaks of the analytes were confirmed by comparing their retention time and UV spectra with those of the reference standards.
1.3 Preparation of internal standard solution
Precisely took ellagic acid 100 mg in 250 mL volumetric flask,dissolved with methanol,diluted to the mark,and sonicated for 10 min.Then,the obtained solution of concentration 0.4 g/L was used as internal standard solution.
1.4 Preparation of standard solution
The standard stock solution of pyrogallol(2 g/L)was prepared with internal standard solution(0.4 g/L).The working standard solutions(62.5,125,250,500,and 1 000 mg/L)were prepared by diluting the stock solution with the internal standard solution.The stock solution was kept at 4℃ to ensure its stability at least for one month.Standard solutions were daily prepared by diluting the stock solution with internal standard solution.
1.5 Preparation of pyrogallol sample solution
An amount of powder equivalent to 200 mg of pyrogallol was transferred to a 100 mL volumetric flask.Then 70 mL internal standard solution was added and sonicated for 10 min.The volume was made up with internal standard solution to obtain a solution containing 2 g/L of pyrogallol.An aliquot of sample solution was filtered with 0.45 μm filter membrane and then the filtrate was further diluted to get the pyrogallol solution of 1 g/L.
1.6 Application of the method
With the optimal chromatographic conditions,a steady baseline was recorded,then the mixed standard solution was injected and the chromatogram was recorded.The retention times of pyrogallol and ellagic acid were found to be 4.33 min and 19.25 min.This procedure was repeated for the sample solution obtained from the formulation.The peak area ratios of pyrogallol peak areas to the internal standard peak areas of the standard solution and sample solution were calculated.The concentration of the pyrogallol was calculated by using the following formula:
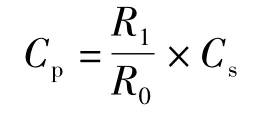
where:Cp—the concentration of pyrogallol,g/L;R1—the peak area ratio of pyrogallol peak area and internal standard peak area of sample solution;R0—the peak area ratio of pyrogallol peak area and internal standard peak area of the standard solution;Cs—the concentration of pyrogallol in the standard solution,g/L.
1.7 Validation of the method
The method was validated by using the following analytical parameters:linearity,precision,accuracy,detection and quantitation limits,and robustness[7].Linearity was evaluated by calculation of a regression equation by using least squares method.Calibration curves were obtained from six different concentrations analyzed three times.Precision was assessed by testing the repeatability of standard and sample solutions six times in the same day(intra-day)and intermediate precision was analyzed with the same standard and sample solutions six times in different days(inter-day).Accuracy was tested by the mean recoveries of three determinations of pyrogallol at three different concentrations precisely prepared and by determination of the relative standard deviation(RSD).Limits of detection(LOD)and quantitation(LOQ)were estimated from the signal-to-noise ratio.The detection limit is defined as the lowest concentration level resulting in a peak area that is three times as larger as that of the baseline noise.The quantitation limit is defined as the lowest concentration level that provides a peak area with a signal-to-noise ratio higher than 10,with precision(%CV)and accuracy(%bias)within ± 10%[8].
2 Results and Discussion
2.1 Optimization of the chromatographic method
Determination of pyrogallol by RP-HPLC method was carried out under optimal chromatographic conditions.Typical chromatograms of standard solution and sample solution of concentration 1 g/L are given in Fig.1.The peak area ratios of pyrogallol and internal standard sample of the standard solution and sample solution were calculated.The assay procedure was repeated for three times and the mean peak area ratios were calculated.
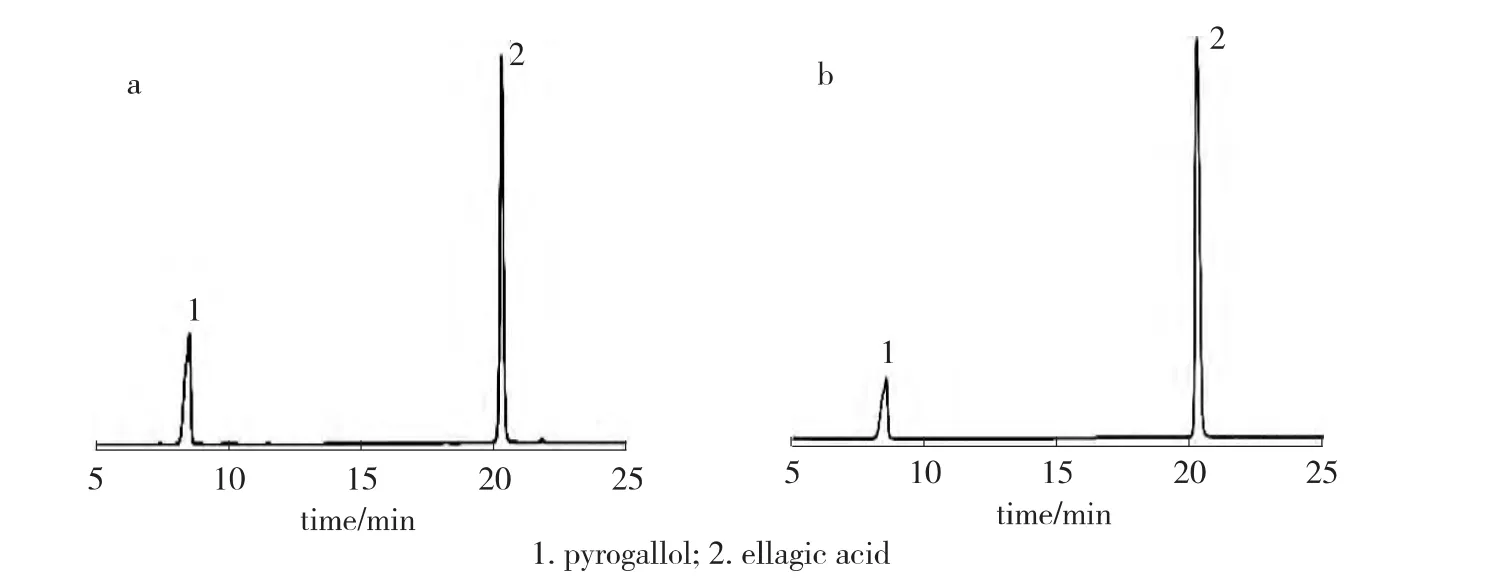
Fig.1 Typical chromatograms of standard solution(a)and sample solution(b)of pyrogallol
2.2 Method validation
2.2.1 Linearity The linearity range of pyrogallol concentration was from 62.5 to 2 000 mg/L(Fig.2).The calibration curve was constructed by plotting peak area ratios of pyrogallol and ellagic acid against concentrations of samples.The fitting equation of calibration curve was y=0.000 138 66x+0.0019 2(R2=0.999 4),where x is the concentration of sample,mg/L,and y is the peak area ratio.The R2obtained was higher than 0.999,as frequently recommended[9].This indicated a good linearity in the proposed range.The results showed that an excellent correlation existed between the peak area ratios and concentrations of sample within the concentration range indicated above.
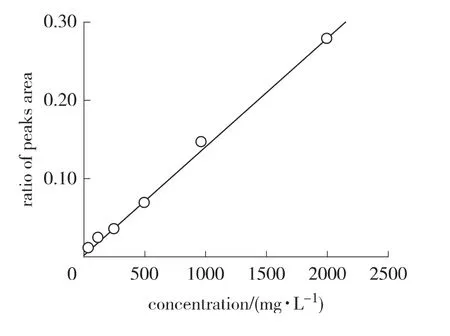
Fig.2 Calibration curve of pyrogallol
2.2.2 Precision The precision of the method was demonstrated by inter-day and intra-day variation studies.In the intra-day studies,six repeated injections of standard and sample solution were made.However,in the inter-day variation studies,six repeated injections ofstandard and sample solutions were conducted in three consecutive days.The peak area ratios and RSD in the two kinds of studies were calculated.Intra-day and inter-day RSD were 2.03%and 1.61%,respectively.These results indicated good precision of the analytical method[10].
2.2.3 Accuracy The accuracy characterizes the proximity between the obtained experimental results and the real results.And it was assessed by the determination of the recovery percentage of a known amount of pyrogallol.Three different standard solutions of 12,58,and 123 mg/L were precisely prepared as described above,and a mean recovery of 103.6%was found after the recovery tests.These results showed the agreement between the obtained experimental values and theorical ones.Thus,it could be emphasized that this method is accurate.
2.2.4 LOD and LOQ The LOD can be defined as the lowest concentration of analyzed substance in a certain sample that can be detected under certain conditions by a given method.LOQ is the lowest concentration that can be determined at an acceptable precision and accuracy.In the present work,the LOD for pyrogallol was found to be 10 μg/L.The LOQ for pyrogallol was found to be 50 μg/L.
2.2.5 Robustness Robustness of the method was determined by making slight changes in the chromatographic conditions.No marked change was observed in the chromatograms,so the developed HPLC method was rugged and robusted.In order to demonstrate the stability of both standard and sample solutions during analysis,theywere analyzed over a period of 6 h at room temperature.The results showed that for both solutions the retention time and peak area of pyrogallol remained almost unchanged(RSD <2.0%,Table 1)and there was no significant degradation within the analyzing period.Thus,it indicated that they were stable for 6 h at least,which was sufficient to complete the whole analytical process.The column efficiency,resolution,and peak asymmetry were calculated with the standard solutions.Theoretical plate/mter and resolution factor were 8865.9 and 3.53,respectively.
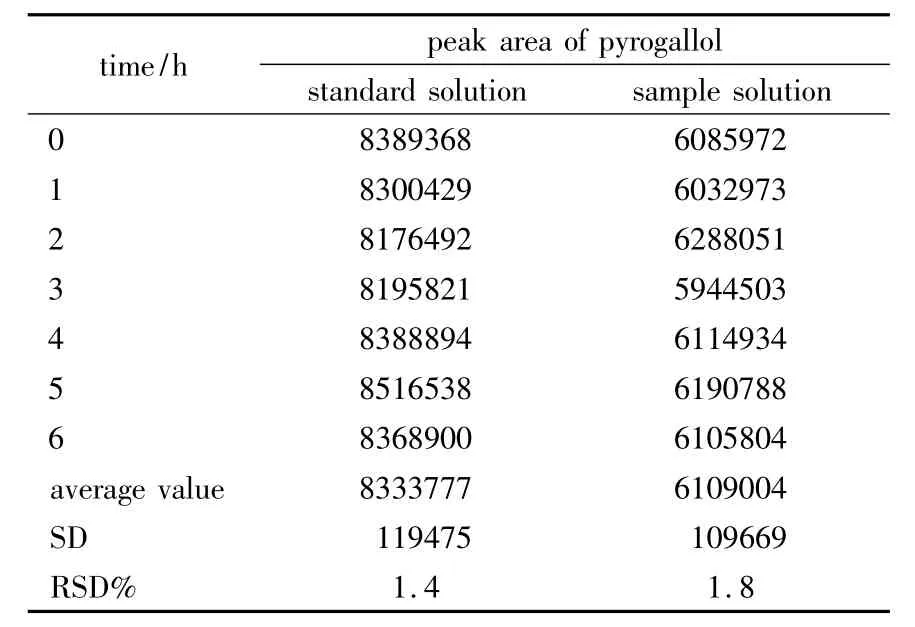
Table 1 The results of stability study
2.2.6 Application of the method The validated method was applied for the determination of pyrogallol in commercially available sources(Zhangjiajie,Hongjiang,and Zhushan).The concentrations of the pyrogallol purchased from Zhangjiajie,Hongjiang,and Zhushan were calculated by using formula 1 to be 99.9% ±1.5%,99.7% ±1.4%,and 99.7% ±3.4%,respectively.
3 Conclusion
Ellagic acid was used as an internal standard,RP-HPLC method for the determination of pyrogallol.The retention time of pyrogallol and ellagic acid was 4.33 and 19.25 min,respectively.The linearity range of pyrogallol concentration was from 62.5 to 2 000 mg/L.The fitting equation of calibration curve was y=0.000 138 66x+0.001 92(R=0.999 7)and a mean recovery of 103.6%was found.The proposed RPHPLC method for the estimation of pyrogallol is accurate,precise,linear,rugged,robust,simple and rapid.Hence,the present RP-HPLC method is suitable for the quality control of the raw materials and pyrogallol products.
[1]KUMAR R A,GUNASEKARAN P,LAKSHMANAN M.Biodegradation of tannic acid by Citrobacter freundii isolated from a tannery effluent[J].Journal of Basic Microbiology,1999,3(39):161-168.
[2]YOSHIDA H,TANI Y,YAMADA H.Isolation and identification of a pyrogallol producing bacterium from soil[J].Agricultural and Biological Chemistry,1982,10(46):2539-2546.
[3]DENG Zi-xi,LIU Lin,LI Wen-juan.A HPLC method for the determination of pyrogallol[J].Fine Chemical Intermediates,2012,42(3):70-72.
[4]CHENG Chun-xi,GENG Qin.Determination of pyrogallol acid in tannic acid extracted from Chinese gallnut by high performance liquid chromatography[J].Chemistry & Bioengineering,2007,24(4):73-74.
[5]MUDASIR M,MUGIYANTI M,HADIPRANOTO N.Spectrophotometric determination of pyrocathecol and pyrogallol based on their redox reaction with iron(III)/phenanthroline system [J].Indonesian Journal of Chemistry,2010,2(3):161-166.
[6]WU Dong-mei,CHEN Jia-hong,WANG Yong-mei,et al.Study on quantitative determination of pyrogallic acid [J].Biomass Chemical Engineering,2007,41(2):41-43.
[7]SARMENTO B,RIBEIRO A,VEIGA F,et al.Development and validation of a rapid reversed-phase HPLC method for the determination of insulin from nanoparticulate systems[J].Biomedical Chromatography,2006,20(9):898-903.
[8]SISTLA R,TATA V,KASHYAP Y V,et al.Development and validation of a reversed-phase HPLC method for the determination of ezetimibe in pharmaceutical dosage forms[J].Journal of Pharmaceutical and Biomedical Analysis,2005,39(3/4):517-522.
[9]EPSHTEIN N A.Validation of HPLC techniques for pharmaceutical analysis[J].Pharmaceutical Chemistry Journal,2004,38(4):212-228.
[10]BRESSOLLE F,BROMET-PETIT M,AUDRAN M.Validation of liquid chromatographic and gas chromatographic methods Applications to pharmacokinetics[J].Journal of Chromatography B:Biomedical Sciences and Applications,1996,686(1):3-10.