Indoor UWB Channel Modeling Based on Test Data
2017-08-07 08:46:41AdamMohamedAhmedAbdoLIYitianZHAOXiongwen
裝備環(huán)境工程 2017年7期
Adam Mohamed Ahmed Abdo,LI Yi-tian,ZHAO Xiong-wen
(School of Electrical and Electronic Engineering,North China Electric Power University, Beijing 102206,China)
Indoor UWB Channel Modeling Based on Test Data
Adam Mohamed Ahmed Abdo,LI Yi-tian,ZHAO Xiong-wen
(School of Electrical and Electronic Engineering,North China Electric Power University, Beijing 102206,China)
Based on indoor UWB measurements,cluster-based tapped-delay-line(CDL)models and novel path-loss models with respect to the transceiver distance and frequency band were developed in the paper.The new path loss models as the function of both the distance and frequency were derived.Meanwhile,the amplitudes of from line-of-sight signal and non-line-of-sight signal met the distribution of Ricean and Rayleigh.The models have great guiding significance for the simulation and design of UWB wireless system.
Cluster-based tapped-delay-line(CDL)model;path-loss model;UWB
Ultrawideband(UWB)radio is important in future short range communications,especially in indoor and rural environments for the fast traffic connections between a UWB transmitter and a computer,and among personal computers.For UWB radio system design,two models are critical.One is the path loss models for radio coverage,and another is the cluster based tapped-delay-line(TDL)channel models for the link level simulations.In most of the open literature[1—7], path loss models are either related to the transceiver distance or the frequency band.In[2],UWB path loss models with the transceiver distances are summarized in detail from the open literature for indoor channel. However for UWB radios,path loss models related to both the distance and frequency band are required in a specific system design and its coverage predictions.
1 Measurement setup and campaign
1.1 Measurement setups
Frequency domain measurement was built by using a vector network analyzer(VNA).In the measurements, the VNA used 3,200 tones to sweep a frequency band of 3-10 GHz which was segmented into two pieces of 3~6.5 GHz and 6.5~10 GHz for enhancing the delay range.The channel impulse responses were obtained by the inverse Fourier transformation of the frequency domain measurement data.To remove the small-scale fading effect,spatial averaging was adopted,i.e.,at each measurement position the measurement wasperformed at 25 grid points with 10 cm grid space in a square[7].
1.2 Measurement campaign
Fig.1 shows the measurement layout in a corridor. Both line-of-sight(LOS)and non-LOS(NLOS) measurements were performed.In the LOS measurements, the transmitter TX was located in the corridor with two meters away from point 1,the receiver was placed in the fixed positions from point 1 to point 12.The measurement started from point 1 and took one meter step corridor with the door,and they follow the Saleh-Valenzuela model[8].
Table I(A)shows the cluster based TDL models for the LOS cases corresponding to the PDPs shown in till point 8 with the door open.Point 9 is at the same position as point 8.However,from point 9 till point 12, the door is closed and the distance step changed as two meters away from each other.The measurements were done after working hours to avoid the effect of moving people.In NLOS measurements,the transmitter was located in the room shown in Fig.1,and the receiver is placed at different positions from point 1 to 10 by way of point 9′with one meter distance away from each other and the door closed.The distance from the transmitter to point 1 is about 5.1 meters.
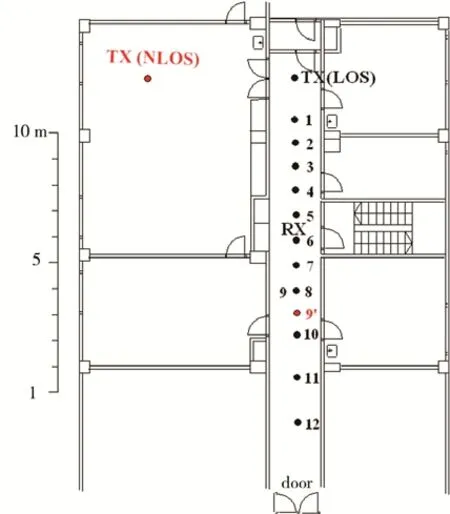
Fig.1 Corridor Measurement layout
2 Cluster based delay line channel models
The power delay profiles(PDPs)for the LOS measurements are plotted in Fig.2a where the receiver is located at different positions as described in II and shown in Fig.1.The 30 dB dynamic range is used for noise cut.From RX1 to RX8,the receiver is away from the transmitter TX(LOS)with the distances from two to nine meters,basically two clusters are observed.At RX8,one more cluster has just started to appear.RX9 is the same position as RX8,the only difference is that starting from RX9 onwards the door is closed.At RX9, three clusters can be obviously seen.The 3rdcluster is much strong compared to the one at RX8.The 2ndcluster at RX8 is now divided into two subclusters at RX9,the two subclusters can be regarded as in one cluster due to small delay range(same as at RX10 and RX12).It’s seen that UWB radio is greatly affected by the change of the environment,e.g.the cluster structures and tap powers are changed when the door is open and closed.
From Fig.2a,another interesting phenomenon is that the clusters(e.g.clusters 2 and 3)are moving when the distances between the transceiver are increasing. The clusters are obviously located at the side of the Fig.2a.Cluster 1 is the main cluster which can contain more taps.Clusters 2 and 3 have less taps,but taps with large excess delays can be observed,which are the critical taps to affect the data transmission rate of thesystem.In Table I(A),the taps with*before mean that they are from the cluster 2,while with**before,the taps are from cluster 3.With no sign before,the taps are from the main cluster.The TDL models are extracted by counting the local peaks in a cluster.
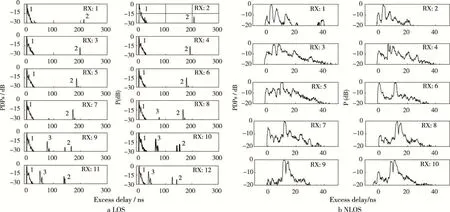
Fig.2 The PDPs at different locations in the corridor
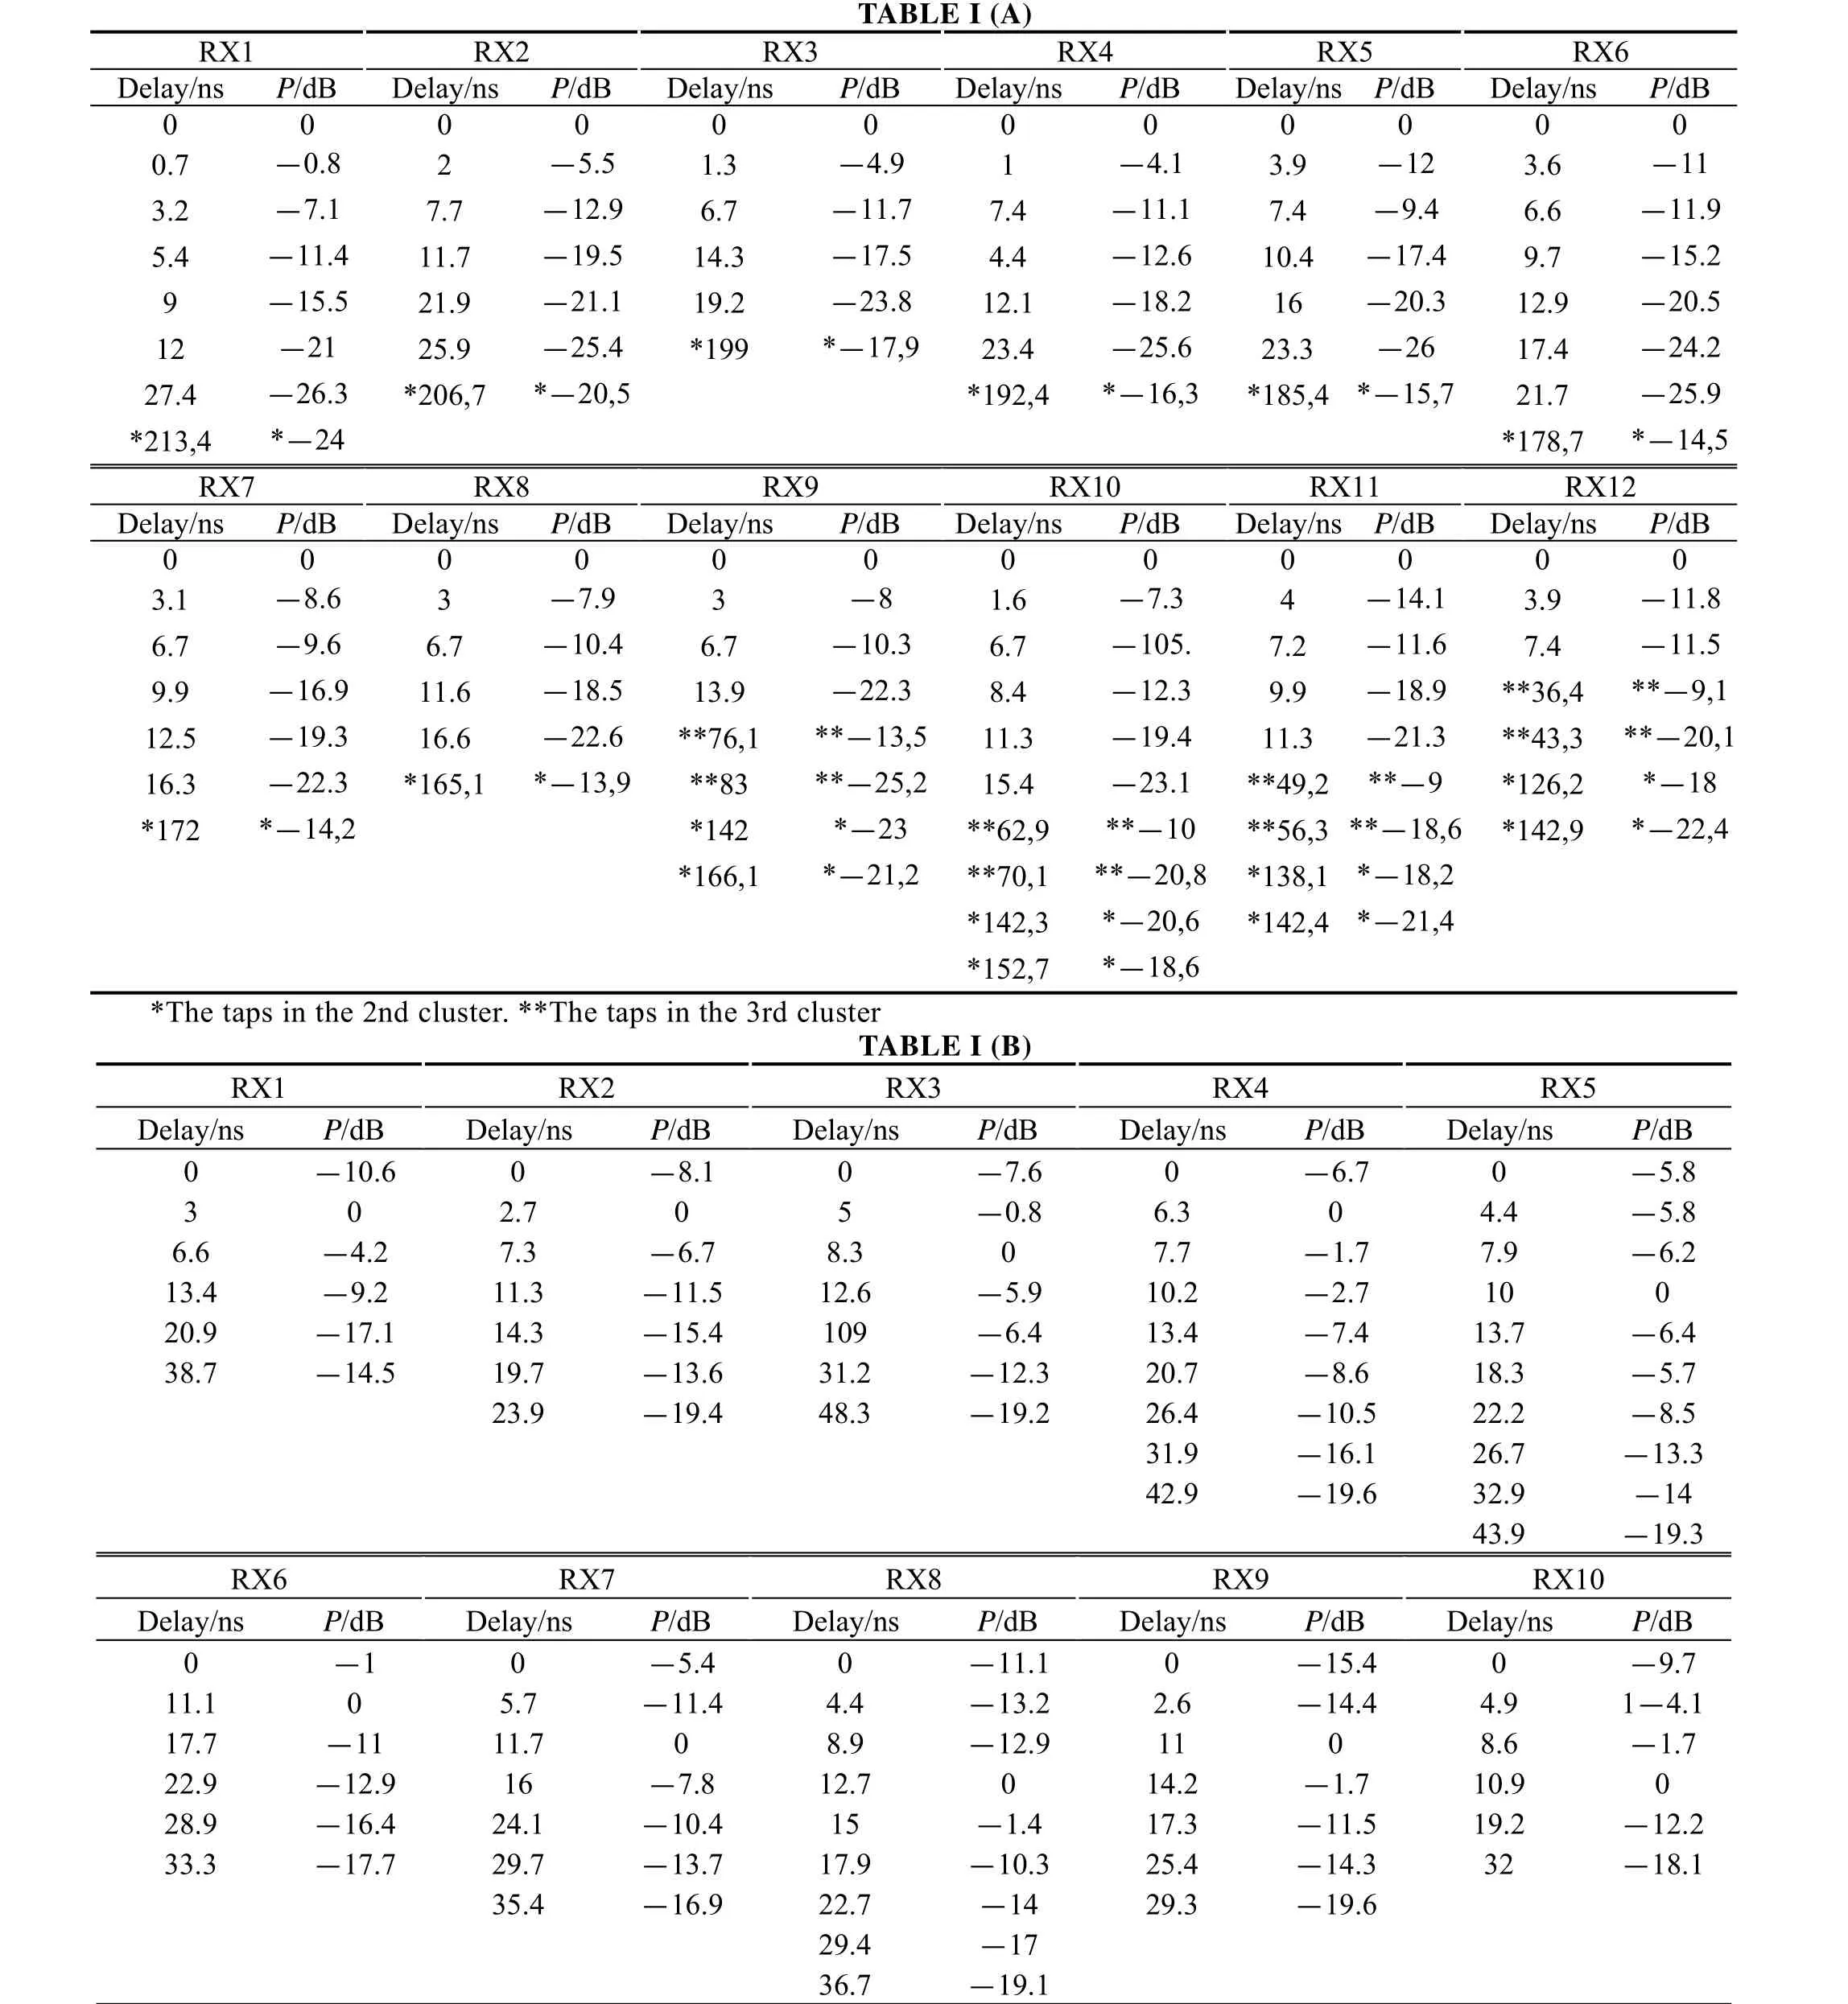
TABLE I Cluster based tapped delay line models(A)LOS.(B)NOLOS
The PDPs for the NLOS measurements are plotted in Fig.2b where the transmitter was located at the room and the receiver was placed from point 1 to point 10 with one meter away from each other by way of point 9. In the NLOS environment,20 dB dynamic range is applied for noise cut.From the NLOS PDPs,it’s seenthat only one cluster is found,with about 50 ns delay range.The first tap with zero excess delay is contributed by the transmission through the wall.The taps with the maximum powers are due to the diffraction from the two edges of the room door or contributed by other multipath in most of the RX positions.The NLOS TDL models are listed in Table I (B).Only the main cluster is found in the NLOS case.
3 Novel path loss models
Path loss models related to both the distance between the transceiver and the frequency are derived by 4.1 and 4.2.
Fig.3 Path-loss with respect to carrier frequencies at RX1 in LOS
3.1 Path loss frequency dependence
The path loss frequency dependences at the locations from RX1 to RX12 in the LOS,and RX1 to RX10 in the NLOS are derived first,where the linear relationship(1)is applied.As an example,Fig.3 shows the path loss vs.frequency band at position RX1 in the LOS measurements.In(1),bis called the intercept andnthe exponent,andfis in GHz.By performing the similar linear regressions at the other locations,the intercepts and 10*exponents are listed in Tables II(A) and(B)for the LOS and NLOS environments, respectively.The fitting standard deviations(stds)for the LOS and NLOS locations are within 4.9~6.3 dB and 5.3~6.2 dB,respectively.

3.2 Distance dependences of the intercept and exponent
In Table II,the corresponding measurement distances between the transceiver are listed in the first column,the next step is to find the relationships of the intercepts and exponents with the distances.An examples,Figs.4a and b show the linear fittings for the intercepts and exponents for the LOS measurements. Similar ways can be applied in the NLOS case as well. The final path loss model was,therefore,related to both the distance and frequency.For LOS case,the path loss model is expressed as for the LOS measurements

The distance can be in 15 meters.In the NLOS case,the path loss model can be derived as

The distance can be within 12 meters.(2)and(3) are the path loss models which are expected to be derived.However,the complicated issue is to estimate the shadow fading(SF),e.g.what are the SF standard deviations for(2)and(3)due to different fitting steps for the path loss and their related parameters.SF depends strongly on the measured environments,but one measurement campaign cannot cover all the possible environments.The SF std can therefore be regarded as an empirical parameter.By open literature, the std for LOS can be within 1~4 dB,and 2~8 dB for NLOS environments[1—2,9].At last,shadow fading in dB can be modeled as random variable with normal distribution with a specific standard deviation.
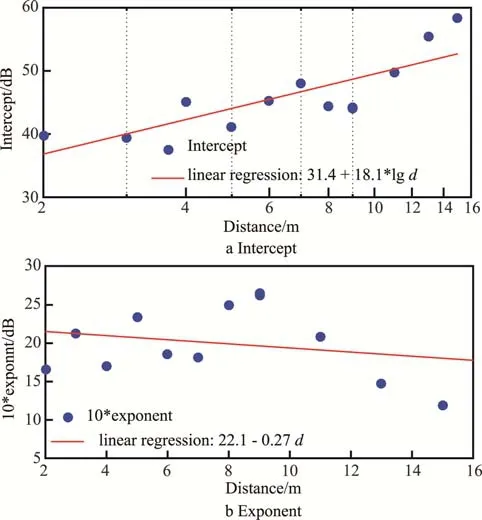
Fig.4 Relationships of the path-loss intercepts and exponents with the distance
4 Validation of the path loss models
The new models(2)and(3)are tested by using them to compare with the path loss model(1)at different receiver locations.Based on(2)and(3),the corresponding intercept and 10*exponent are tabulated in Table II as well to compare with the values obtained by(1).The fitting stds for different receiver positions are listed in the last columns in TableⅡ(A)and(B)by using(1)and(2)for the LOS,and(1)and(3)for the NLOS,respectively.Very good agreement can be found in the most measurement locations,and the final mean stds are 1.0 and 2.0 dB for the LOS and NLOS, respectively.In[1],the path loss frequency dependence is described asfn,whereKlies in 1–3(n=2 is for free space).In this work,we can find thatn(exponent) lies in 1.2~2.7 for the LOS and 1.1~3.3 for the NLOS environments,respectively by(1)(2)(3).
So far,the path loss related to both the distance and frequency are derived.It’s good to show how the received power changes with both of the parameters. Let’s define the received power is the minus value of the path loss and no antenna gains are included.Figs.5 a—c show the received powers vs.the transceiver'sdistances and the frequency bands in free space,the LOS and the NLOS environments.It’s seen that the received power in the LOS corridor is close to the power in free space,but a bit higher power can be received due to guided wave effect.The received power in the NLOS is much lower than that in the free space and in the LOS,especially in larger distances and with higher frequencies.
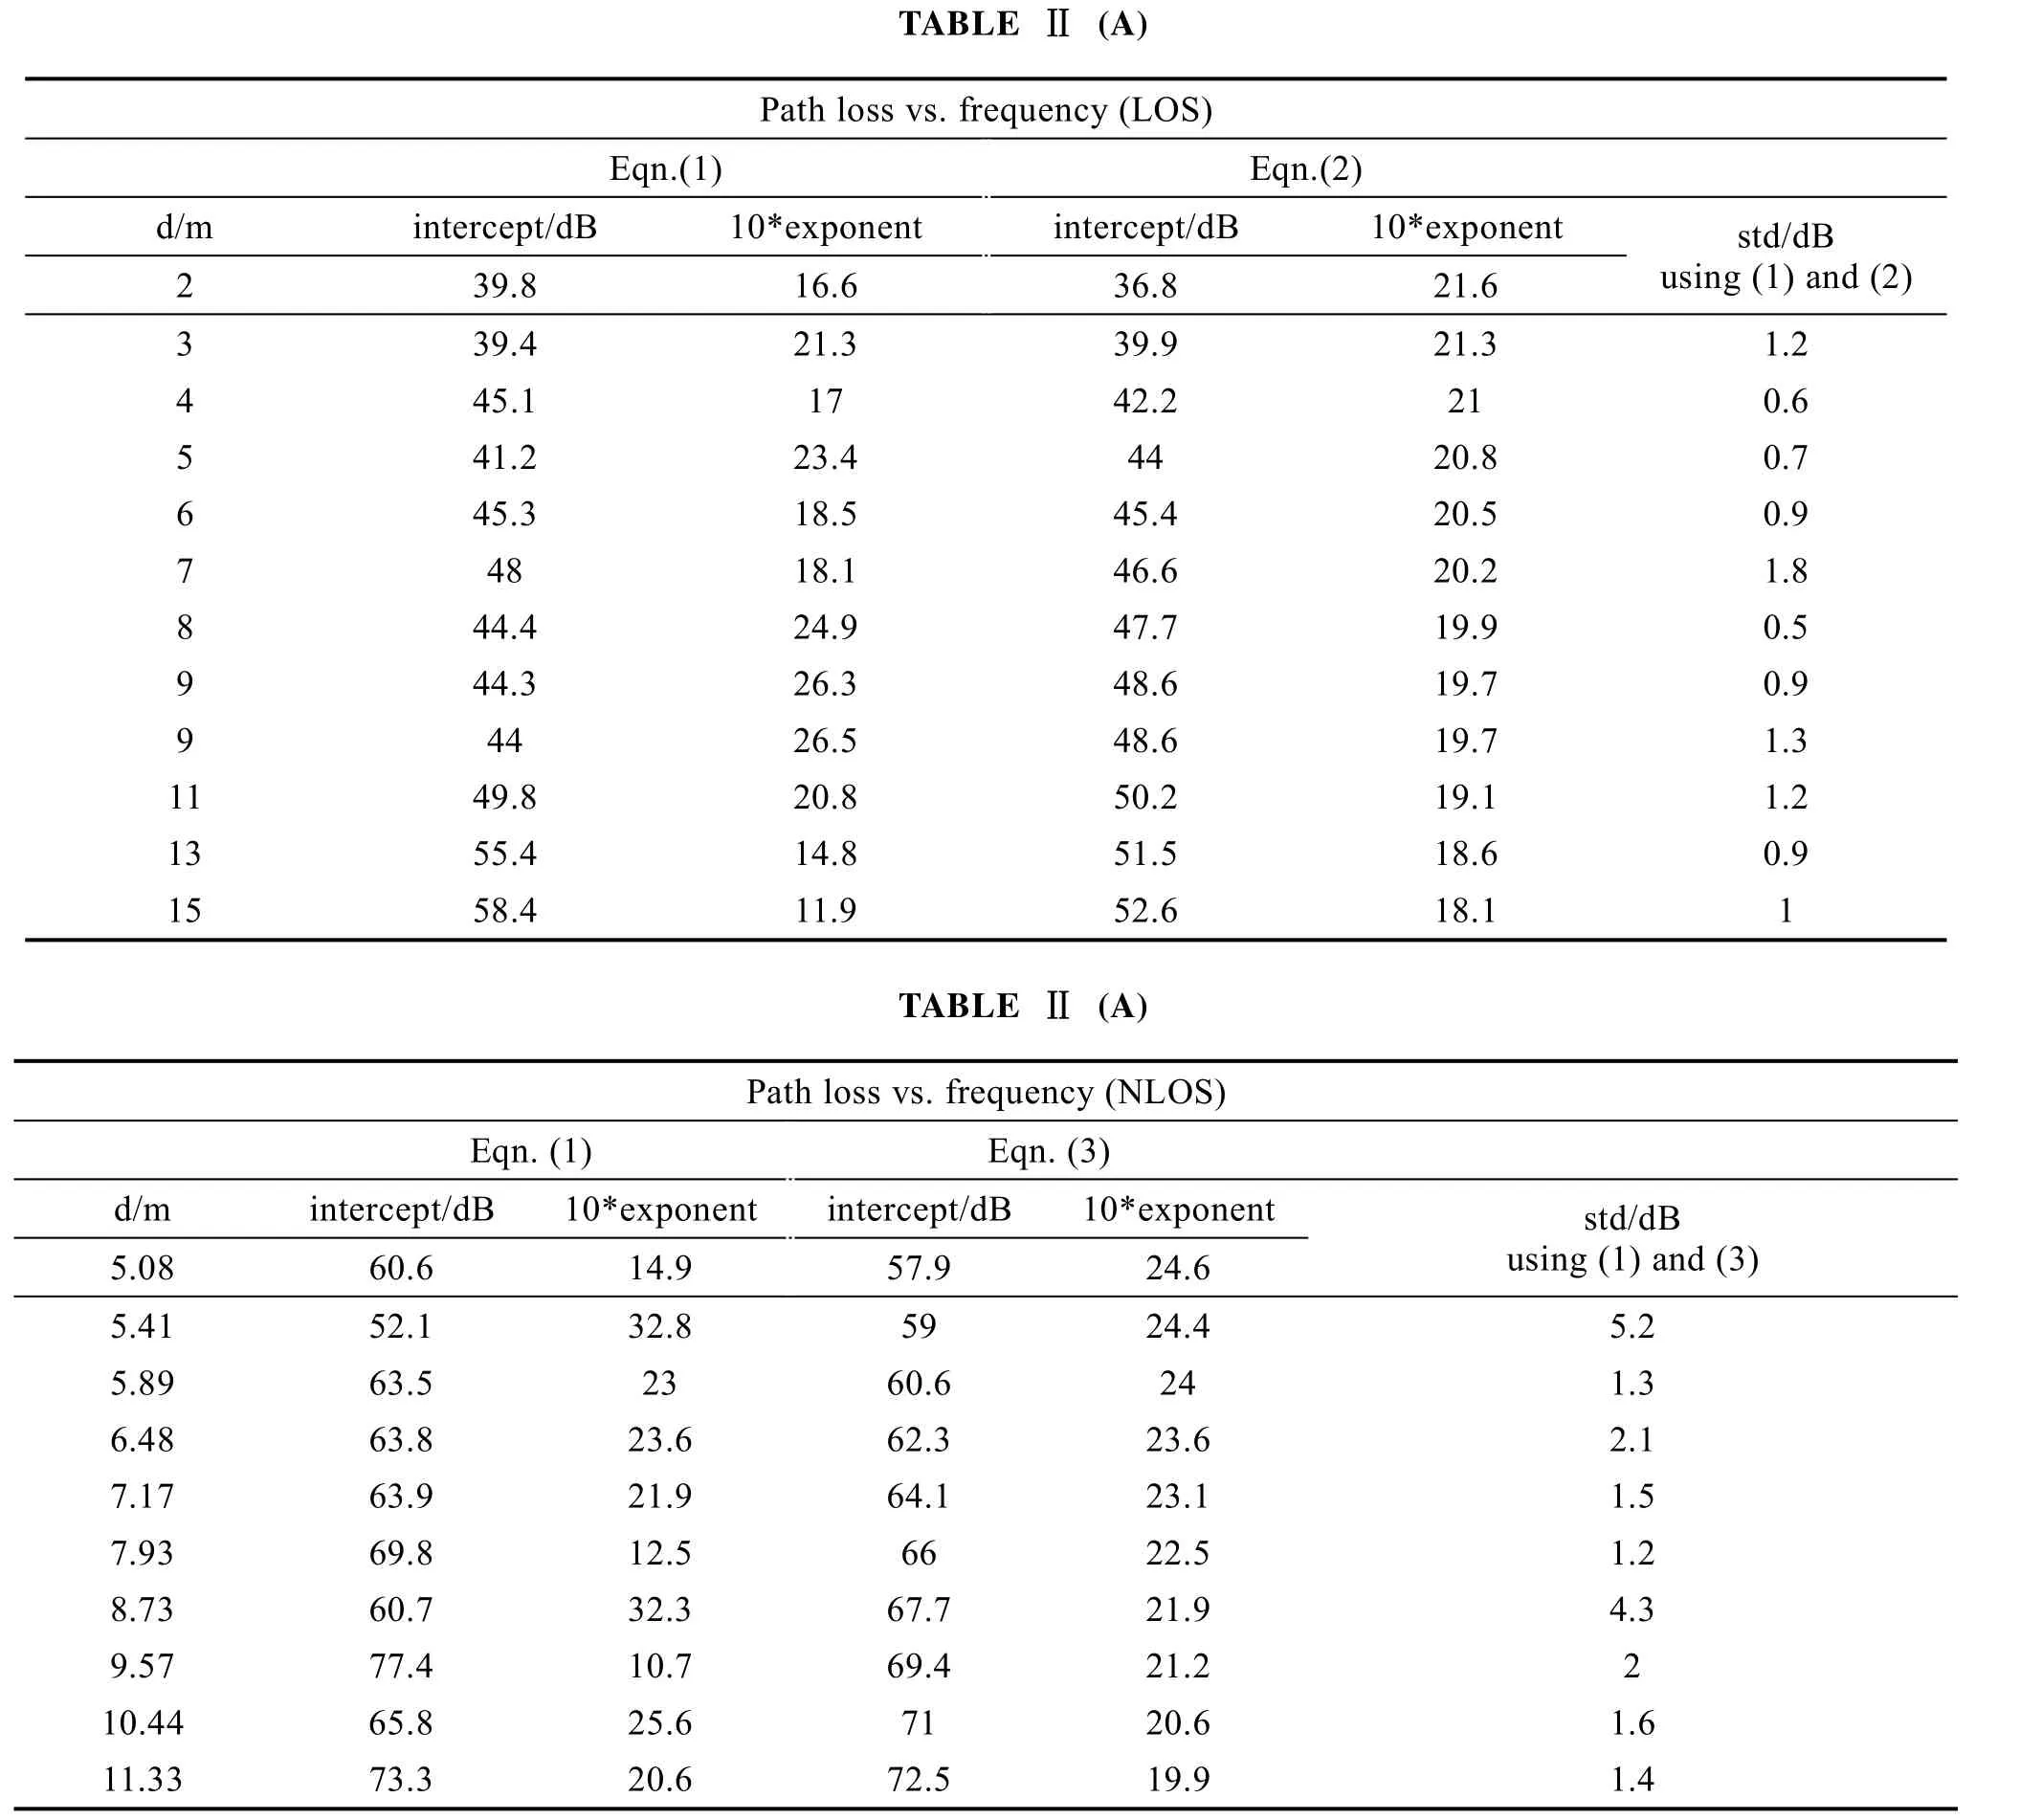
TableⅡPath loss frequency dependent models at different measurement locations(A)LOS.(B)NOLOS
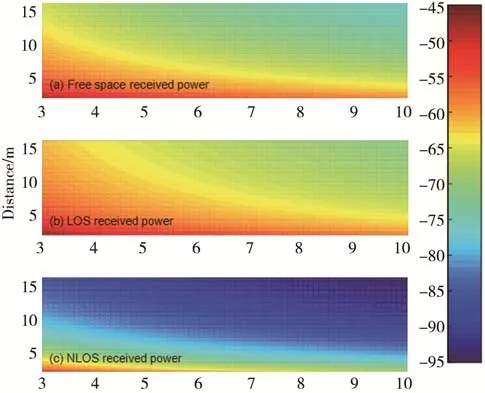
Fig.5 Path loss vs.both of the transceiver distances and carrier frequencies:a)Free space;b)LOS corridor; c)NLOS corridor
6 Conclusion
The TDL and path loss models are derived in this paper based on the corridor measurements.The TDL models are useful for the link level simulations,which is seldom to see in open literature.In most of the locations,the channel are Ricean and Rayleigh for the LOS and NLOS corridor,respectively.The traditional UWB path loss models are either distance or frequency dependence.In this paper,the new path loss models asthe function of both the distance and frequency are derived,with which the UWB radio coverage can be predicted at any given distance and any interested frequency band.
[1]MOLISH F.Ultra-Wide-Band Propagation Channels[J]. Proceedings of the IEEE,2009,97(2):353—371.
[2]DONLAN F,MCKINSTRY D R,BUEHRER R M.The WUB Indoor Channel Large and Small Scale Modelling[J].IEEE Transactions on Wireless Communications,2009,5(10):2863—2873.
[3]GHASSEMZADEH S S,JANA R,RICE C W,et al. Measurement and Modeling of an Ultra-Wideband Indoor Channel[J].IEEE Transactions Communications,2004, 52(10):1786—1796.
[4]DABIN J A,HAIMOVICH A M,GREBEL H.A Statistical Ultra-Wideband Indoor Channel Model and the Effects of Antenna Directivity on Path Loss and Multipath Propagation[J].IEEE Journal on Selected Areas in Communications,2006,24(4):752—758.
[5]THIAGRARAJAH S,ALI B M,ISMAIL M.Empirical UWB Path Loss Models for Typical Office Environments [C]//2005 13th IEEE International Conference on Networks.Malaysia,2005:16—18.
[6]SAADANE R,WANBI M,HAYAR A,et al.Path Loss Analysis Based on UWB Channel Measurements[C]// 2009 IEEE International Conference on Computer Systems and Applications.Rabat,2009:970—974.
[7]GENG S Y,RANVIER S,ZHAO X W,et al.Multipath Propagation Characterization of Ultra-wide Band Indoor Radio Channels[C]//2005 IEEE International Conference on Ultra-Wideband.Zurich,2005:11—15.
[8]SALEH AA M,VALENZUELA R A.A Statistical Model for Indoor Multipath Propagation[J].IEEE Journal on Selected Areas in Communications,1987,5:128—137.
[9]IST-4-027756 WINNER II D1.1.2 V1.1,WINNER II Channel Models[S].
TN928
A
1672-9242(2017)07-0050-06
基于測(cè)試數(shù)據(jù)的室內(nèi)超寬帶信道建模研究
Adam Mohamed Ahmed Abdo,李亦天,趙雄文
(華北電力大學(xué)電氣與電子工程學(xué)院,北京102206)
基于室內(nèi)超寬帶信道測(cè)量研究建立了基于簇的時(shí)延抽頭模型以及與距離和載頻有關(guān)的新穎的路徑損耗模型,建立了路徑損耗同時(shí)與距離和頻率的依賴關(guān)系。同時(shí),研究發(fā)現(xiàn)視距和非視距接收信號(hào)幅度分別滿足萊斯和瑞利分布。該模型對(duì)超寬帶無(wú)線系統(tǒng)仿真和設(shè)計(jì)有重要的指導(dǎo)意義。
簇時(shí)延抽頭模型;路徑損耗模型;超寬帶
10.7643/issn.1672-9242.2017.07.010
2017-03-23;Revised:2017-04-12
Fund:Supported by the National Natural Science Foundation of China(61372051).
Biography:Adam Mohamed Ahmed Abdo(1982—),Male,from Sudan,Ph.D,student.Research focus:millimeter wave technology.
猜你喜歡
童話王國(guó)·奇妙邏輯推理(2024年5期)2024-06-19 16:03:38
體育科技文獻(xiàn)通報(bào)(2022年3期)2022-05-23 13:46:54
天津外國(guó)語(yǔ)大學(xué)學(xué)報(bào)(2021年3期)2021-08-13 08:32:18
遼金歷史與考古(2021年0期)2021-07-29 01:06:54
中學(xué)生數(shù)理化·七年級(jí)數(shù)學(xué)人教版(2020年10期)2020-11-26 08:24:50
數(shù)學(xué)物理學(xué)報(bào)(2020年2期)2020-06-02 11:29:24
科技傳播(2019年22期)2020-01-14 03:06:54
民用飛機(jī)設(shè)計(jì)與研究(2019年4期)2019-05-21 07:21:24
汽車工程學(xué)報(bào)(2017年2期)2017-07-05 08:13:02
光學(xué)精密工程(2016年6期)2016-11-07 09:07:19